Didi Index TSB
- Indicators
- Sonia Tait
- Version: 2.11
O indicador criado por Didi Aguiar, o mestre das Agulhadas!
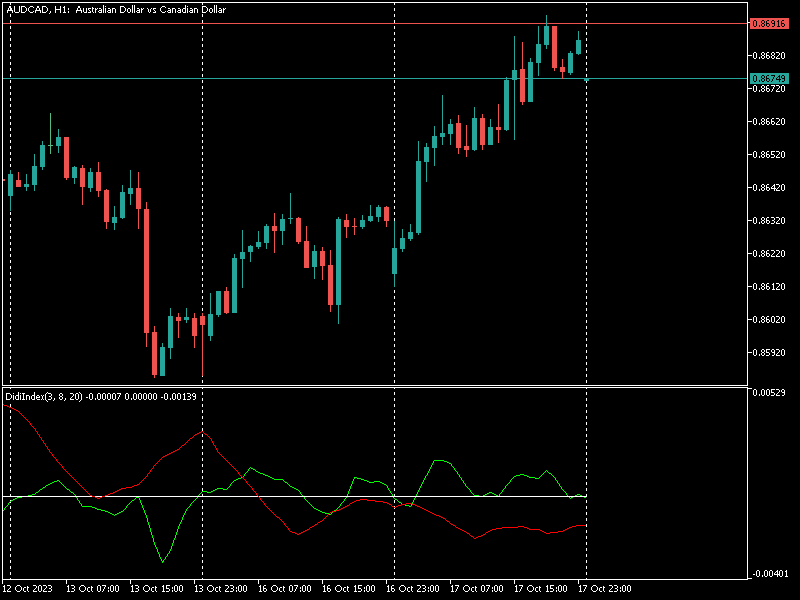
O padrão do indicador é o cruzamento de três médias móveis simples.
Média rápida, período 3.
Média normalizada, período 8.
Média lenta, período 20.
Quando as três médias se cruzam próximas o suficiente, acontece a agulhada!
Pela posição das médias é possível identificar:
Agulhada de compra, agulhada de venda, ponto falso e beijo da mulher aranha.
Quer saber mais? Procure pelo site dos robôs oficiais da Dojistar: tradesystembots.com.br/dojistar
Siga as redes sociais, e fique por dentro das novidades:
@tradesystembots
@didiaguiar_

tooooop