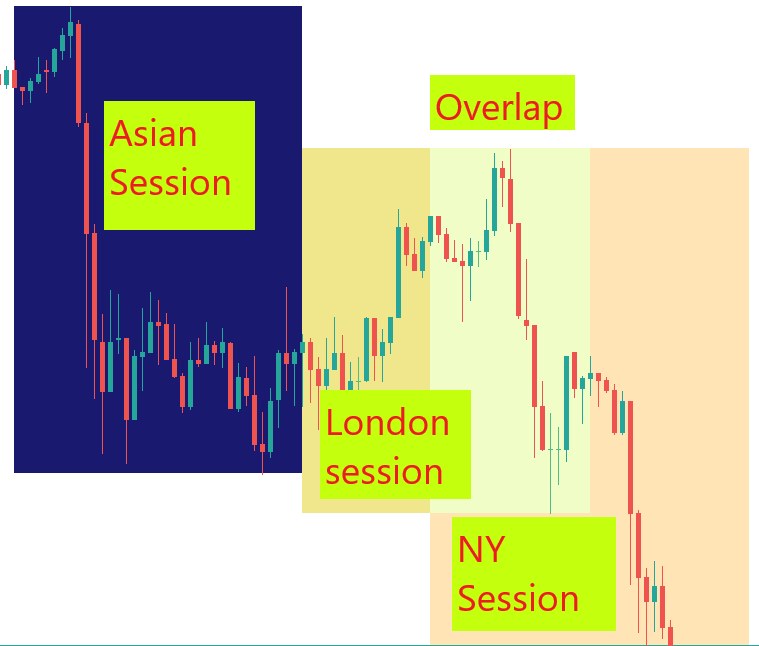
Trading Session Multisession
- Indicators
- Yibeltal Beyabel Eneyew
- Version: 1.11
- Activations: 5
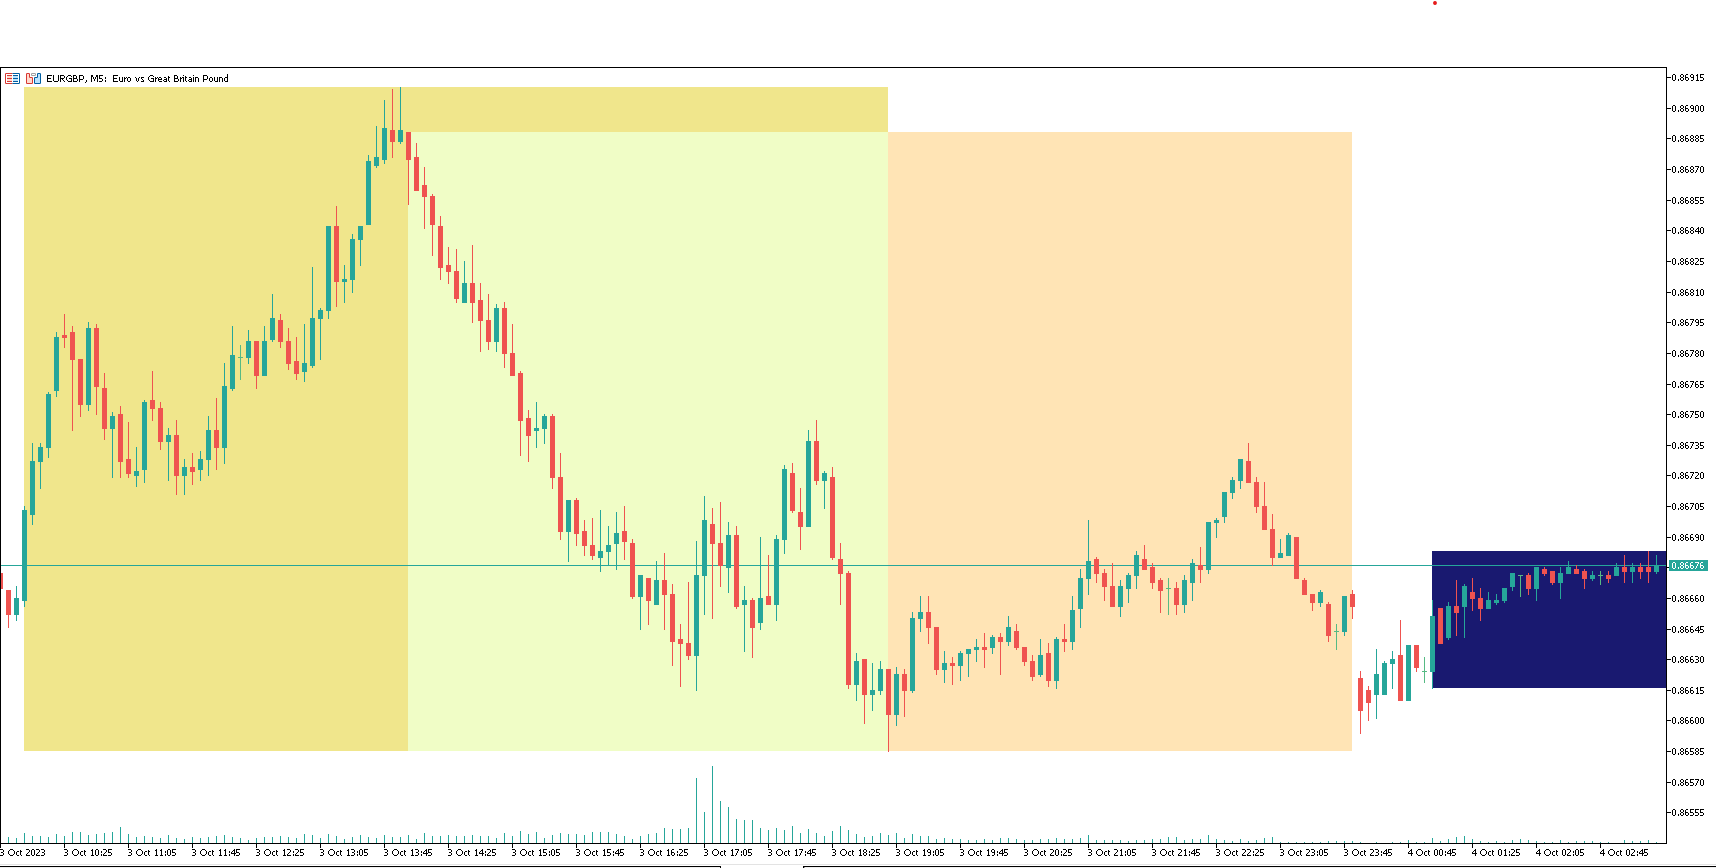
Visual guide which divides the 24 hours into three trading sessions. The default setting is to show Asian, London and New York sessions. But, the session start and end hours can be adjusted as required.
The indicator is useful to develop trading strategies by making it easy to see the market behavior during the three sessions.
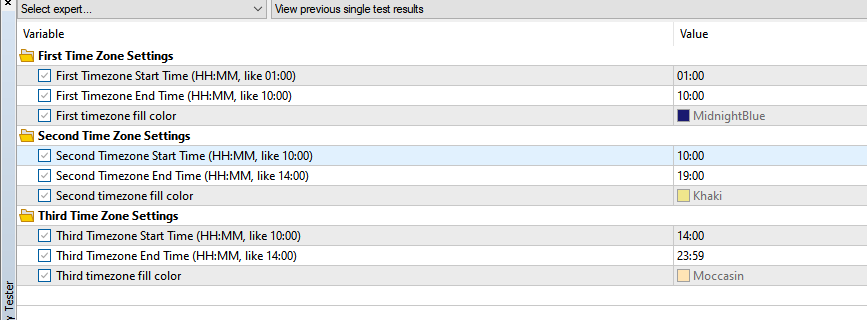
Inputs
- Time Zone Start and End hours
- (Please provide values in HH:MM format, like 02:00, not like 2:00. Both the hours and minutes should have 2 digits)
- Time zone background colors
The indicator will use the brocker time zone. During strategy testing, it uses the time in the history data.
I am pleased to hear any additional features to be included in the next version. .
Thank you for using the product.