RCCZigZagDow Product for MT5
- Indicators
- Yutaka Okamoto
- Version: 1.0
- Activations: 5
A formidable ally for historical testing with Fixed Perspective through ZigZag and Dow Theory, while also supporting ReviewCandleChart. A recommended tool for those troubled by 'lost perspectives.
Overview
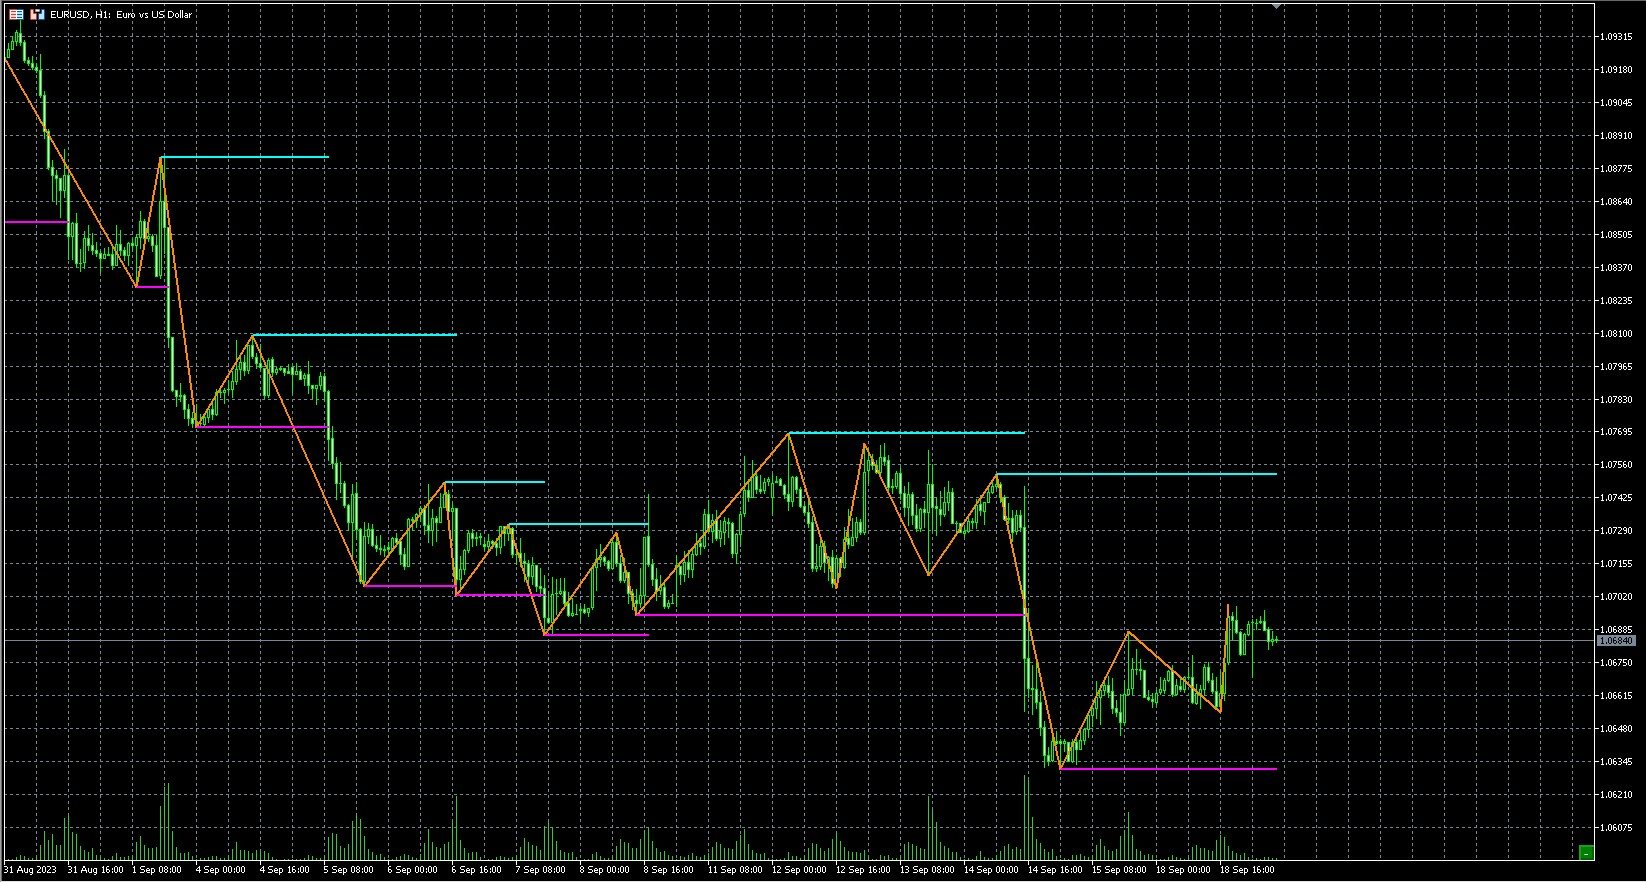
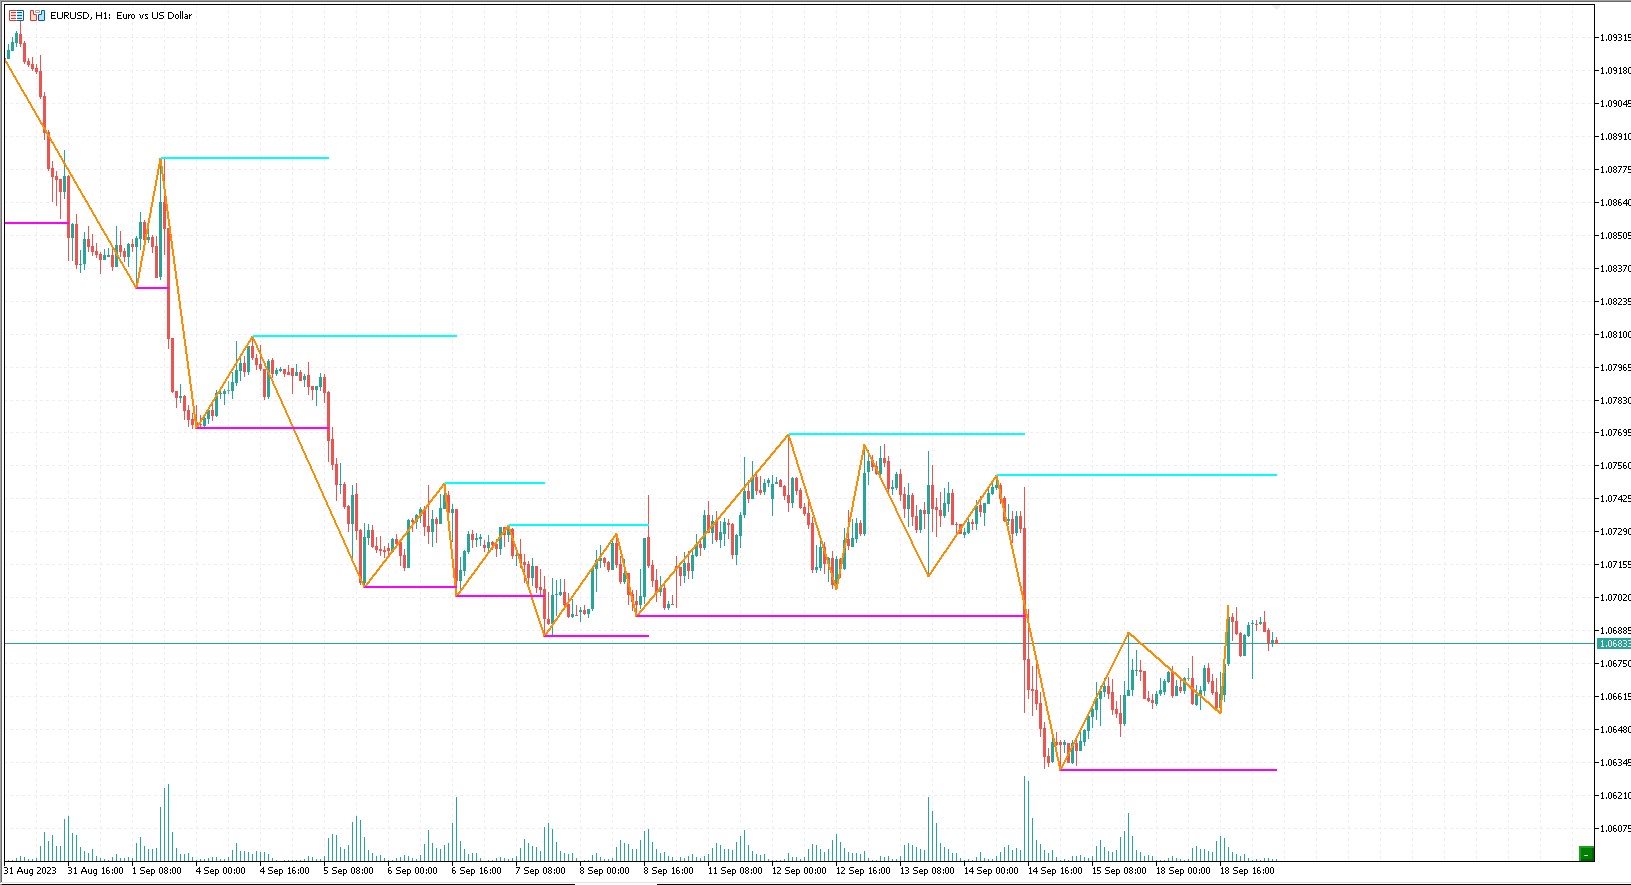
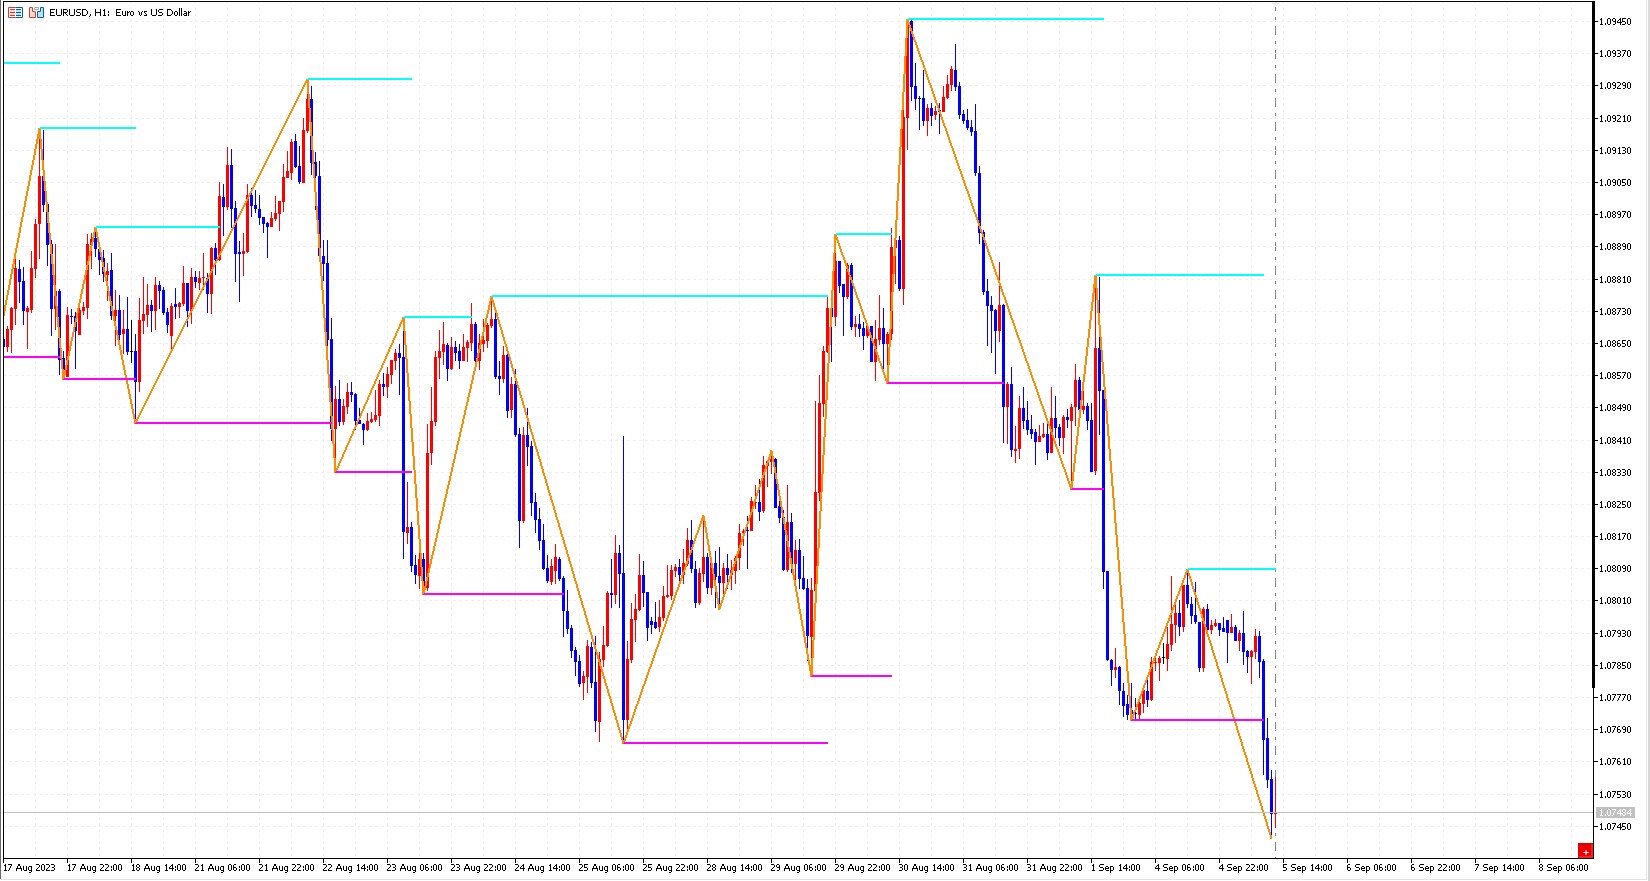
The 'RCCZigZagDow' indicator is a tool that assists in making judgments based on Dow Theory in relation to ZigZag waves. By using ZigZag waves as a basis to derive continuation points according to Dow Theory, it offers the advantage of ensuring that anyone can interpret trends in the same way. The current trend, whether it's 'up,' 'down,' or 'range-bound,' has a clear logic in the waves, and as a result, the perspective on the outcome is also clear. This tool ensures 'objectivity' and 'reproducibility.'
Recommended for those who are troubled by 'lost perspectives.'
Ensuring Objectivity and Reproducibility
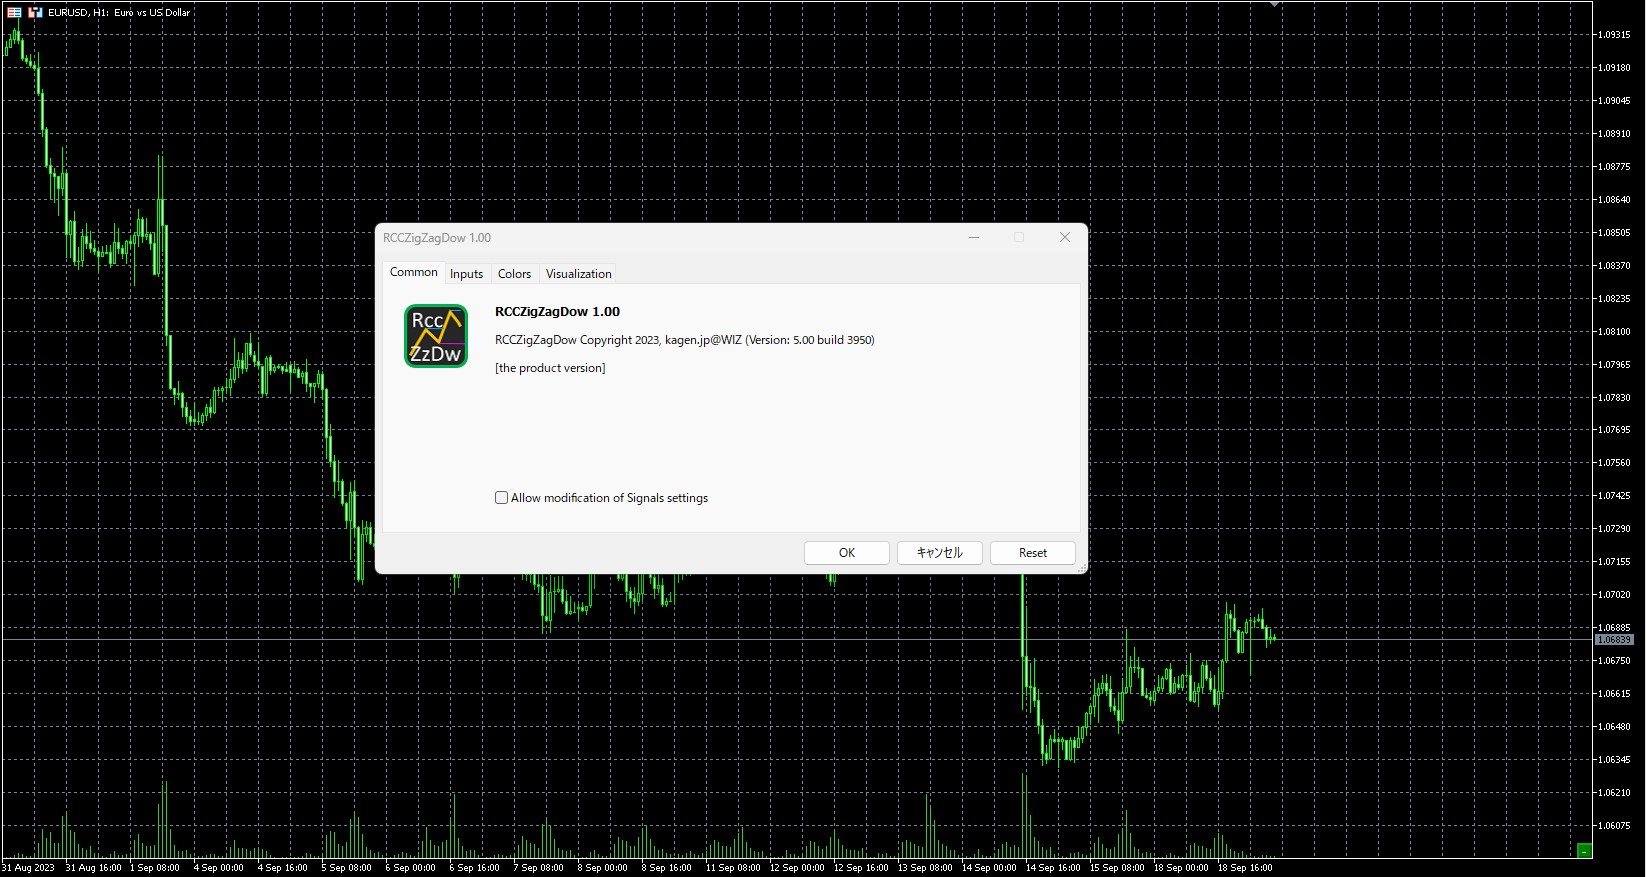
Settings
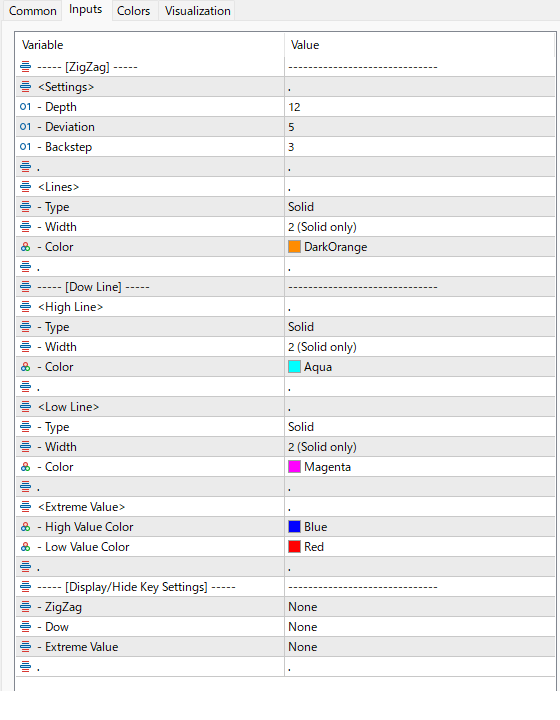
---- [ZigZag] ----<Settings>
- Depth
- Deviation
- Backstep
The default values are Depth: '12,' Deviation: '5,' and Backstep: '3.'
Increasing the Depth value makes the ZigZag peaks and valleys larger, while reducing it makes them smaller.
<Lines>
- Type
- Width
- Color
Configure the ZigZag lines.
---- [Dow Line] ----
<High Line>
- Type
- Width
- Color
<Low Line>
- Type
- Width
- Color
Set the high and low lines for 'rising' and 'falling' Dow Theory.
<Extreme Values>
- High Color
- Low Color
Visualize the values (extreme values) from which ZigZag is calculated.
They are initially set to be hidden.
--- [Show/Hide Key Settings] ---
- ZigZag
- Dow
- Extreme Values
Set keys to control the display and hide options for ZigZag lines.
Set keys to control the display and hide options for Dow's high and low lines.
Set keys to control the display and hide options for extreme values.
The default setting for all is 'None.'
Additional Information (Links)