Watch how to order a trading robot
Read the Rules before you post an order or execute it
How to Order a Trading Robot in MQL5 and MQL4
See a sample Requirements Specification to order a robot
New orders in the category:
30+ USD
30 - 100 USD
100 - 300 USD
30 - 70 USD
50 - 60 USD
Specification
Hello,
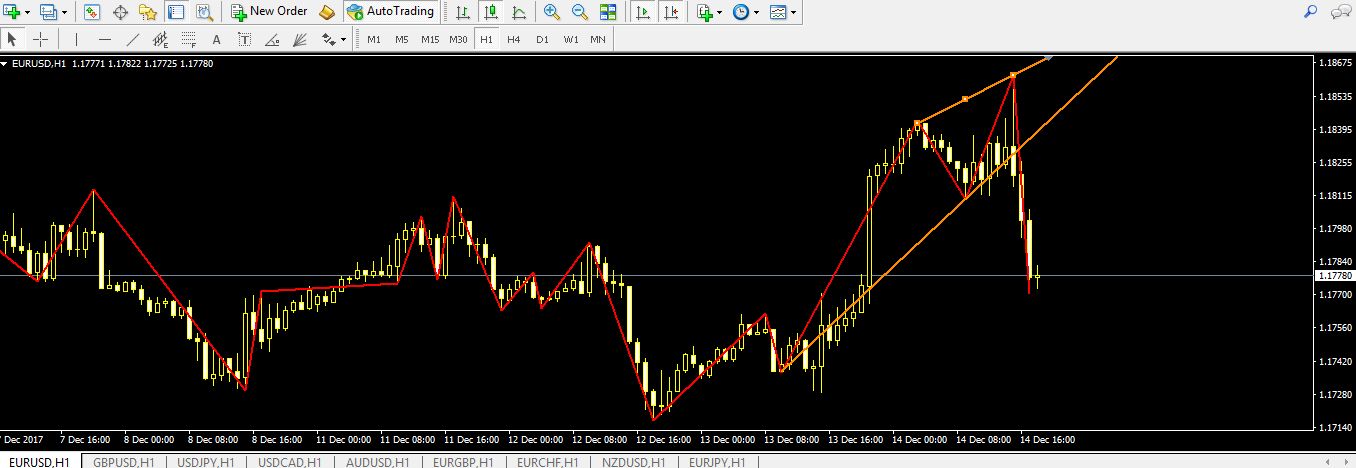
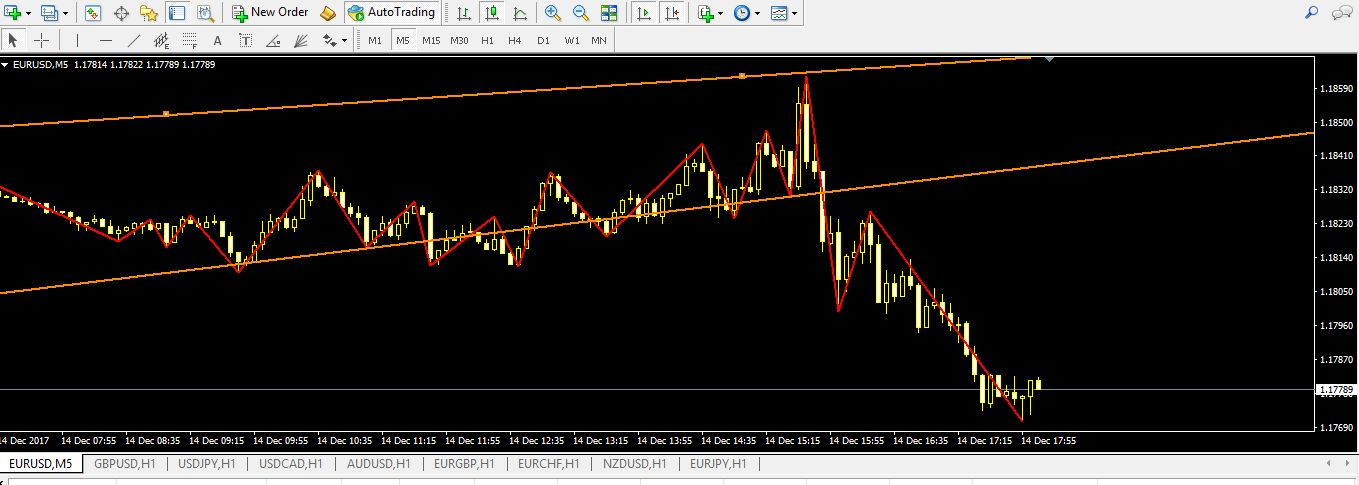
I would like an indicator on timeframe 1H based on zigzag and 2 trenlines.
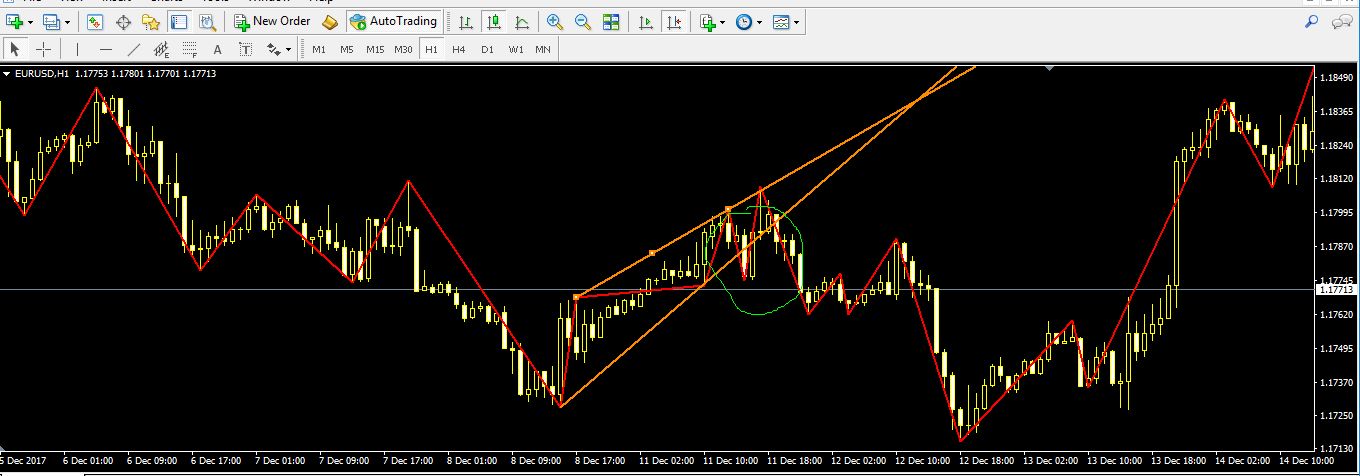
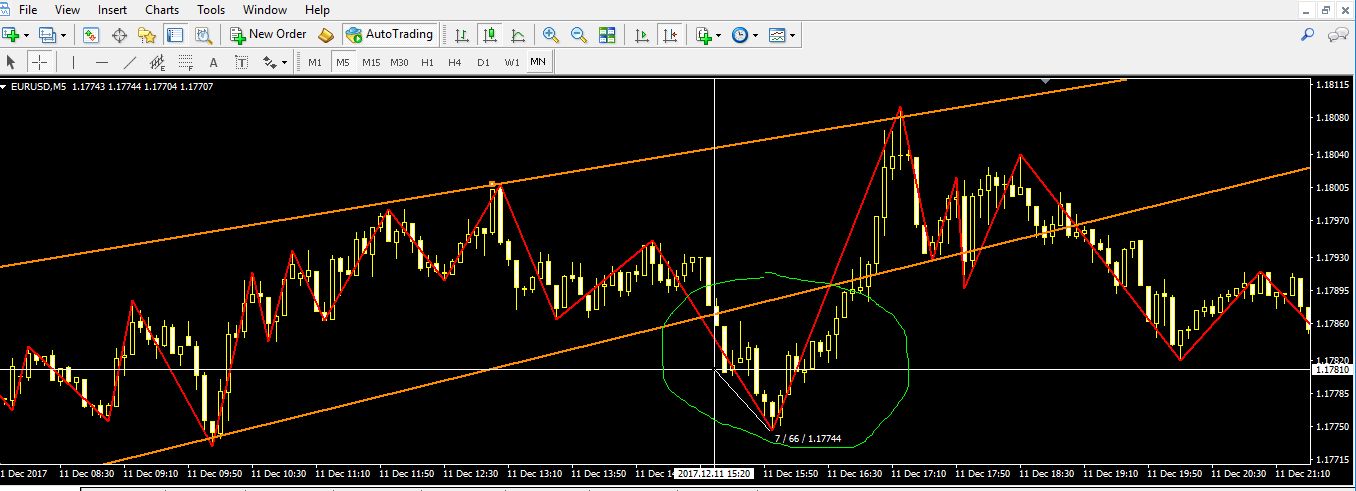
The main function is to draw trendlines between the last 2 high points and last 2 low points of the zig zag that has next characteristic (Depth 5, Deviation 1, Backstep 3). It should keep drawing on the last 2 high/low points. When the second (2nd) complete candle crosses a trendline on time frame M5 it should alert to buy or sell.
PS : The trendlines should not be redraw when timeframes are changed. They should be fixed on H1
There are also wierd situations like the in the image 3 and 4, but price would go down eventually. Don't know if i got lucky or not. Looks like a double top.
Responded
1
Rating
Projects
590
70%
Arbitration
14
43%
/
7%
Overdue
28
5%
Free
2
Rating
Projects
621
38%
Arbitration
39
23%
/
64%
Overdue
93
15%
Free
3
Rating
Projects
193
61%
Arbitration
7
14%
/
29%
Overdue
2
1%
Free
4
Rating
Projects
70
43%
Arbitration
6
33%
/
50%
Overdue
19
27%
Free
5
Rating
Projects
8
13%
Arbitration
10
10%
/
70%
Overdue
2
25%
Free
6
Rating
Projects
6
67%
Arbitration
2
0%
/
50%
Overdue
0
Free
7
Rating
Projects
280
42%
Arbitration
18
61%
/
6%
Overdue
29
10%
Free
8
Rating
Projects
216
49%
Arbitration
1
0%
/
0%
Overdue
25
12%
Free
9
Rating
Projects
933
47%
Arbitration
302
59%
/
25%
Overdue
125
13%
Loaded
10
Rating
Projects
73
16%
Arbitration
13
8%
/
92%
Overdue
37
51%
Free
11
Rating
Projects
162
40%
Arbitration
20
15%
/
75%
Overdue
73
45%
Free
12
Rating
Projects
22
59%
Arbitration
2
0%
/
50%
Overdue
2
9%
Free
Similar orders
Source code for indicator
30+ USD
good day i have an indicator but need the source for this reason The indicator only work on a single Time frame open trade, and close with only a single TF i will like the indicator work on multiple time frame just like other installed indicator My coder said the reason it cannot work like other indicator installed is because it has no buffer First confirm if you have the source code because its a popular indicator
Hello! I am looking for an experienced Pine Script coder to create a custom indicator for mapping market structure based on fractals. The developer must be skilled in Pine Script and have a solid understanding of how to code market structure indicators. Looking forward to working with a talented developer
Hello developers, I would like to hire someone can convert the Radar Signal indicator: https://www.youtube.com/watch?v=5DmKcy7rb-U  ; to it's TradingView equivalent. Radar signal indicator is the combination of 7 classic MT4 indicators. They include ADX, RSI , CCI , OsMA, ATR, WPR. The indicator shows the values of these indicators in blue and red. Red color indicates a bearish market condition and the blue shows
Hi , i want a indicator that shows the trades history on the chart, just for current day, like : first trade : -54 Second trade : -52 Third trade : +126 , and after three trades, display "No more trades"
AngelShark system
30+ USD
Hello i need someone who can convert a trading view indicator into an mt5 indicator that can work smoothly also need to add an alert on the indicator i will require to test the indicator run it for 1-2days to confirm all is okay thank you
Here's a clearer step-by-step guide to checking the last 50 candles on your chart and applying Fibonacci retracement levels based on their colors: Identify Candle Color: Start from the 100th candle from the left on the chart and check its color. If the 100th candle is green (i.e., the close is higher than the open): Draw a Fibonacci Retracement: From the highest price to the lowest price of this candle. Check the
Here's a clearer step-by-step guide to checking the last 50 candles on your chart and applying Fibonacci retracement levels based on their colors: Identify Candle Color: Start from the 100th candle from the left on the chart and check its color. If the 100th candle is green (i.e., the close is higher than the open): Draw a Fibonacci Retracement: From the highest price to the lowest price of this candle. Check the
I have an equity reporter. This equity reporter displays the maximum and minimum equity reached over a specific interval. So, if the interval is set to 24 hours, the script will generate data in the format: "Profit ATT" (profit AtThatTime) shows max./min. during the specific interval This specific report shows data in pips. It can also be set to display in price or percentages. The interval is also easily adjustable
I want you to make me an indicator in Training View. Its idea is very simple, and I want it to have an alarm. Here's a clearer step-by-step guide to checking the last 50 candles on your chart and applying Fibonacci retracement levels based on their colors: Identify Candle Color: Start from the 100th candle from the left on the chart and check its color. If the 100th candle is green (i.e., the close is higher than the
Selection of pairs from provided signal for MT4
30 - 50 USD
Hello, is it possible to be made accommodation of provided signal for Forex for mt4? I bought a signal for multiple pairs. it is executing all pair.I want to use it on couple of pairs.Is it possible to be made some modifications?I do not have codes for the signal
Project information
Budget
30+ USD
VAT (19%):
5.7
USD
Total:
35.7
USD
For the developer
27
USD