 All orders
 Rules
Rules
Job finished

Specification
==================================================================================================================================================
I require an MT4 Indicator that will read a specific CSV file, and use the Information obtained from the CSV file to plot out the Daily Support and Resistance Zones / Levels based on my requirements.
Plus the Indicator will need to check for any latest updates made onto the CSV file. I've already made the Input Parameters for this Indicator. I have explained in detail below on what i need done
==================================================================================================================================================
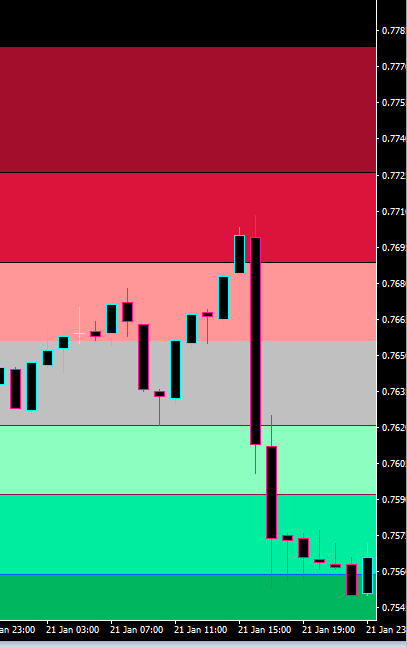
So we have Four Types of Zones and Three Type of Support / Resistance Lines:
a) Pivot Zone
b) Normal Zone / Normal Line (Support & Resistance Zones/Lines)
c) Strong Zone / Strong Line (Support & Resistance Zones/Lines)
d) Extreme Zone / Extreme Line (Support & Resistance Zones/Lines)
* Each Zone / Line should cover one trading day, and not the entire MT4 Chart.
Example of the Three Types of Zones
==================================================================================================================================================
Pivot Zones Information:
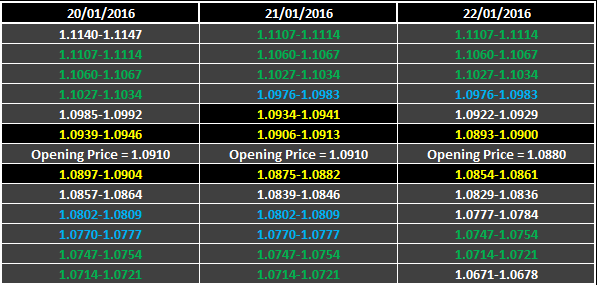
The Pivot Zones have two type of conditions:
Condition 1 = (If the Opening Price is not within any Price Zone like shown on 20/01/2016)
The area between the first zone above the opening price and first zone below the opening price, will be considered as our Pivot Area - so therefore the Pivot Area will be from 1.0897 to 1.0946 in the above Photo example on 20/01/2016.
Condition 2 = (If the Opening Price is between any Price Zone like shown on above example on 21/01/2016, the Opening Price was at 1.0910 and it was between the Price Zone 1.0906 to 1.0913)
If this condition happens then the Zone which contains the Opening Price should be considered Invalid, and therefore the First Zone above the Invalid Zone and the First Zone below the Invalid Zone will be considered as the Pivot Area - so the Pivot Area will be from 1.0875 to 1.0941 in the above photo example on 21/01/2016.
Pivot Zone Examples:
Pivot Zone drawn from 1.0864 to 1.0985 (20/01/2016)
Pivot Zone drawn from 1.0846 to 1.0976 (21/01/2016)
Pivot Zone drawn from 1.0836 to 1.0922 (22/01/2016)
==================================================================================================================================================
Normal Zones Information
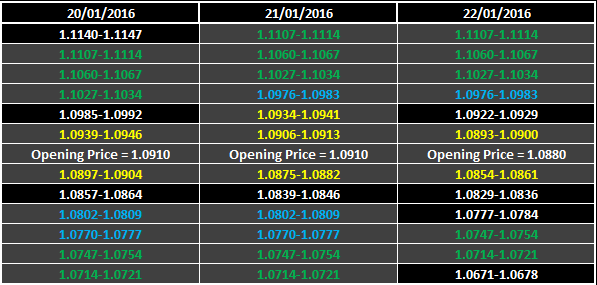
These Zones appear when the Current Price Zone didn't have an Identical Price Zone on the Previous Day, some examples can been seen in the above picture as they have marked using in a White Text Font on a Black Background.
Normal Zone Examples:
Resistance Normal Zone drawn from 1.0985 to 1.1027 (20/01/2016)
Resistance Normal Zone drawn from 1.1140 to 1.1147 (20/01/2016)
Support Normal Zone drawn from 1.0864 to 1.0809 (20/01/2016)
Support Normal Zone drawn from 1.0846 to 1.0809 (21/01/2016)
Resistance Normal Zone drawn from 1.0922 to 1.0976 (22/01/2016)
Support Normal Zone drawn from 1.0836 to 1.0784 (22/01/2016)
Support Normal Zone drawn from 1.0784 to 1.0754 (22/01/2016)
Support Normal Zone drawn from 1.0678 to 1.0671 (22/01/2016)
==================================================================================================================================================
Strong Zones Information
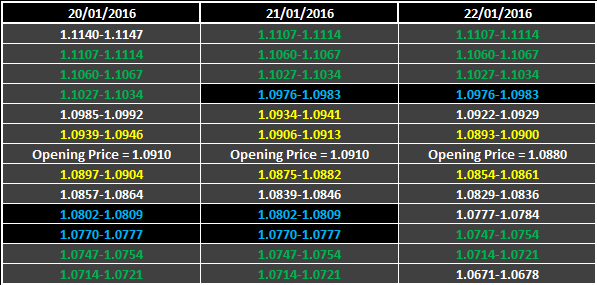
These Zones appear when the Current Price Zone has an Identical Price Zone on the Previous Day, some examples can been seen in the above picture as they have marked using in a Blue Text Font on a Black Background.
Strong Zone Examples:
Support Strong Zone drawn from 1.0809 to 1.0777 (21/01/2016)
Support Strong Zone drawn from 1.0777 to 1.0754 (21/01/2016)
Resistance Strong Zone drawn from 1.0976 to 1.1027 (22/01/2016)
==================================================================================================================================================
Extreme Zones Information
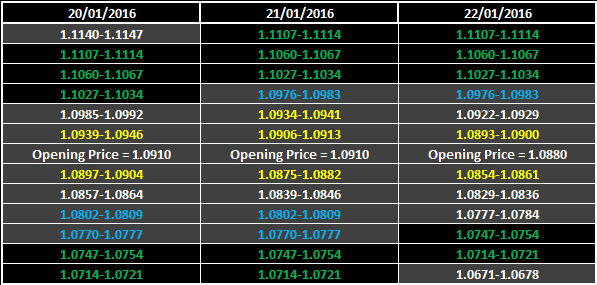
These Zones appear when the Current Price Zone had the same Identical Price Zone on the last two previous days, some examples can been seen in the above picture as they have marked using in a Green Text Font on a Black Background.
Extreme Zone Examples:
Resistance Extreme Zone drawn from 1.1027 to 1.1060 (22/01/2016)
Resistance Extreme Zone drawn from 1.1060 to 1.1107 (22/01/2016)
Resistance Extreme Zone drawn from 1.1107 to 1.1114 (22/01/2016)
Support Extreme Zone drawn from 1.0754 to 1.0721 (22/01/2016)
Support Extreme Zone drawn from 1.0721 to 1.0678 (22/01/2016)
==================================================================================================================================================
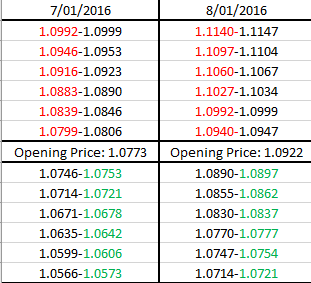
Normal Line = Exactly the same conditions as the Normal Zone, but the Support Line is shown at the Right Price Value and the Resistance Line is shown at the Left Price Value.
Strong Line = Exactly the same conditions as the Strong Zone, but the Support Line is shown at the Right Price Value and the Resistance Line is shown at the Left Price Value.
Extreme Line = Exactly the same conditions as the Extreme Zone, but the Support Line is shown at the Right Price Value and the Resistance Line is shown at the Left Price Value.
So therefore if the Zones are above the Opening Price, then Price Value on the Left Side will be the Line Level for that Line Type.
Now if the Zones are below the Opening Price, then Price Value on the Right Side will be the Line Level for that Line Type.
Here's an Example:
==================================================================================================================================================
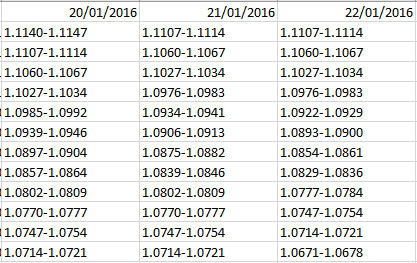
The above photo shows the layout of the CSV Price Zones that the Indicator will need to read and plot the Zones & Support / Resistance Lines.