All orders
 Rules
Rules
Job finished
Specification
TAG Indicator
I would like to build an indicator under name TAG.
On Meta Trader 4 platform for 5 digits ONLY.
I have an indicator, but it is now finished and does not have everything what I need.
On the attached pictures, you can see in details what is inside of this not fully working indicator.
The main thing is that this indicator should look for candles with long tails and wicks. (pins)
After the candle will meet the requirements, the indicator should draw a solid line with a color that will describe the next action.
The indicator should have an option to choose from which time frame to take the data from (candles with long tails or wicks) and draw the lines. (already in the source code)
The default set up should be 1 hour time frame.
The lines from these special candles on 1 hour chart, should be drawn and extended every minute.
They should be seen on every time frame (smaller than 60 min, like 60 M, 30M, 15M, 5M 1M. ) until the time when on 1h time frame the next special candle will show up.
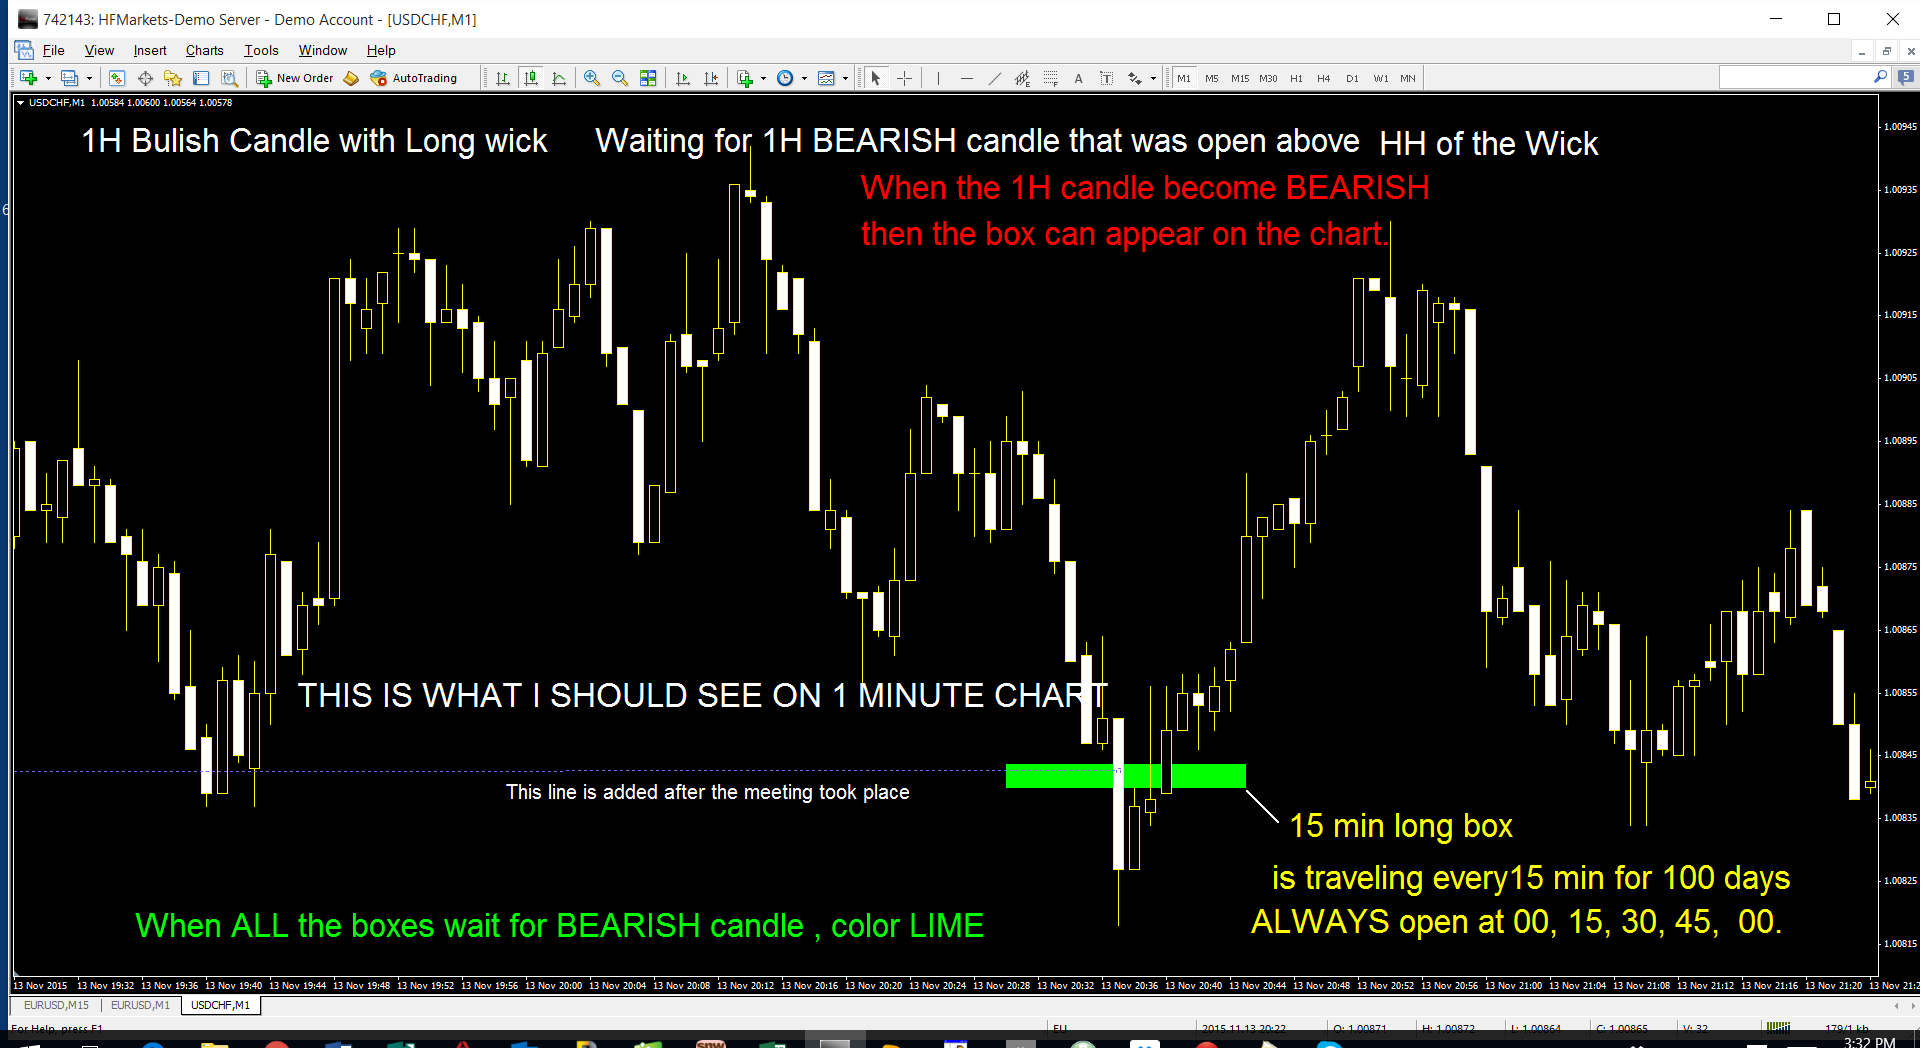
BUT on 1M time frame there should be a traveling box. Please have a look at the picture.
During that time when the line will travel horizontally on the 1H chart until the meeting will take place, at the same time on 1-minute chart,
there should be a visible small box 15 min long and 6 points high, with the option to choose color and length and height.
The box should jump every 15 min. Exactly at 00,15,30,45,00 every quarter UNDER ONE CONDITION!!!
“If the 1 hour signal candle was bearish, the indicator is ONLY looking for a bullish 1H candle.
And if there was Bullish 1H signal candle the indicator only looks for a bearish 1H candle to meet.
On 1M time frame, the indicator should draw boxes with 2 different colors.
If there is a possible meeting (on 1H chart) : Bearish candle is coming towards Bullish Signal Candle with minimum >100 points Tail or Wick, I should see on 1M chart a small box with LIME color (option to change the color, and the size of the box) waiting for any candle on 1M chart to come to this box.
The box is traveling every 15 minutes until one candle will touch it or pierce the box. THEN the box will stop to travel. At the same time there should be drawn a line between the Signal Candle Tail or Wick at the same level when the candle touched the box.
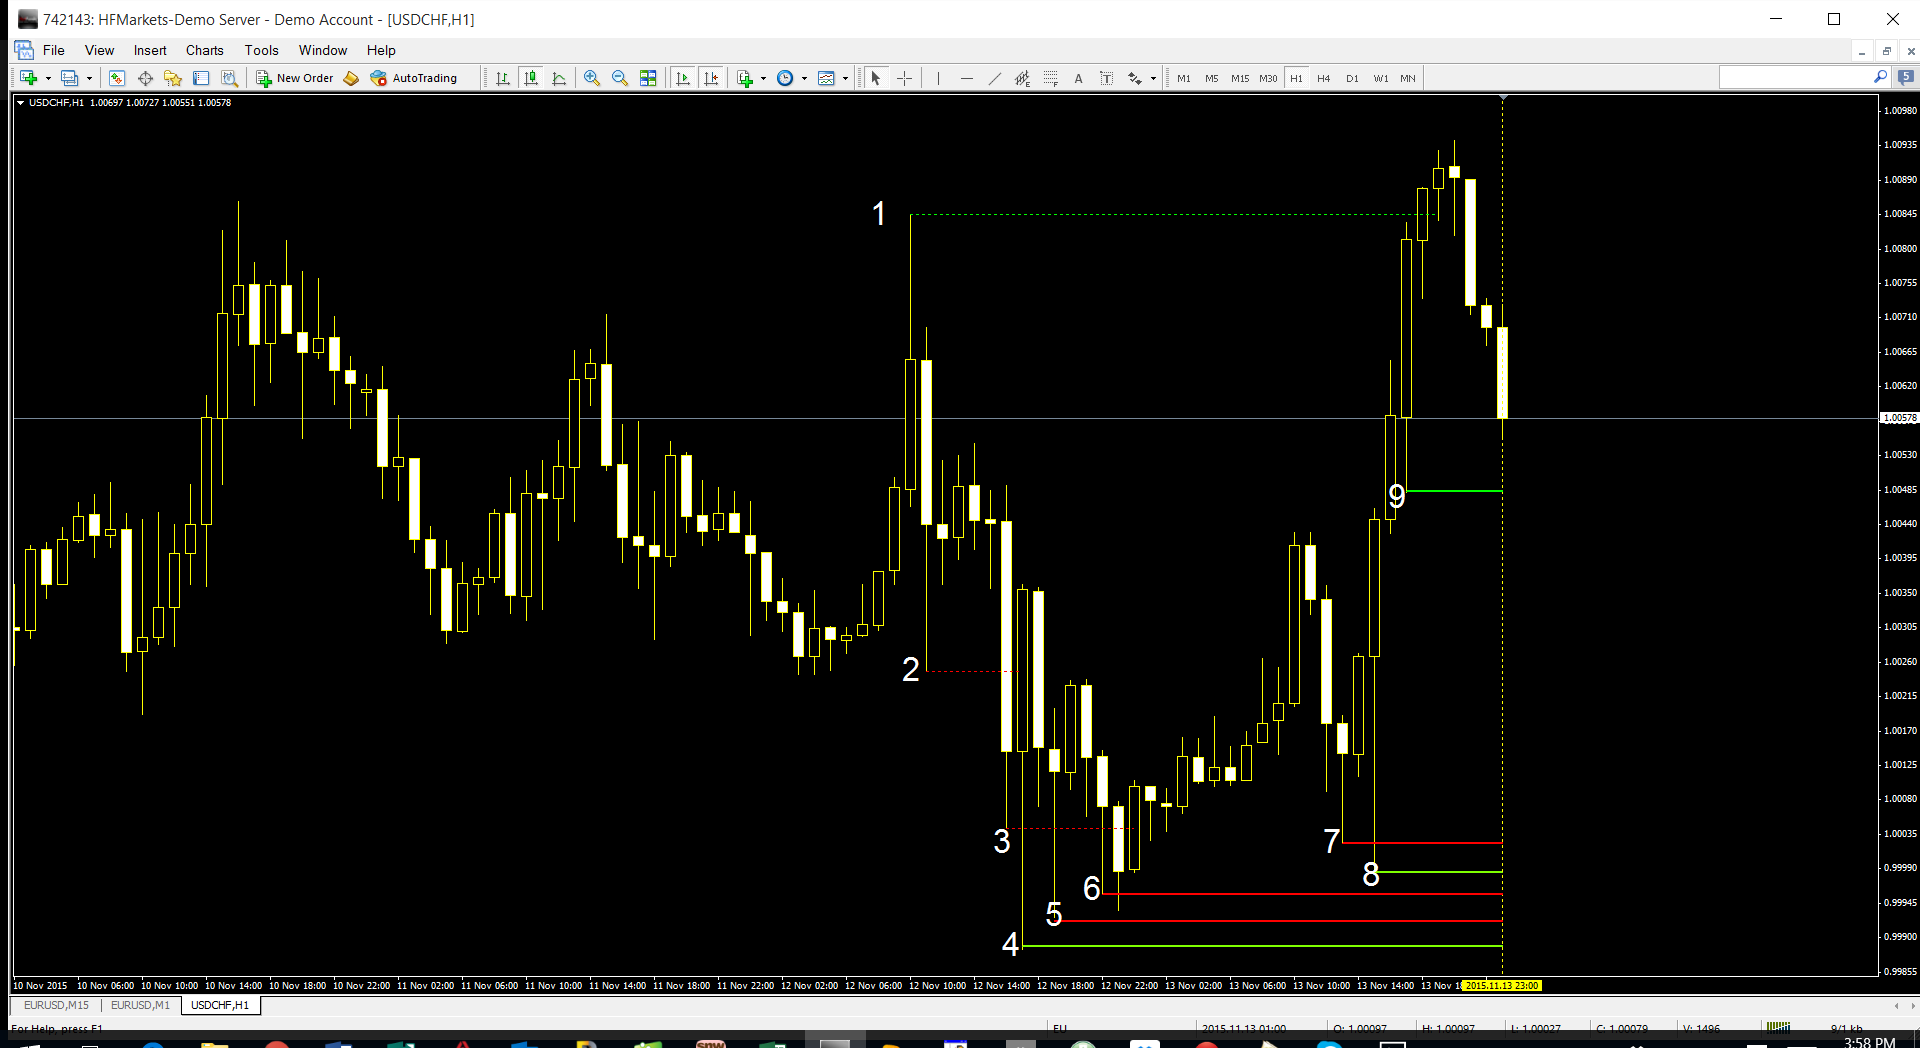
Explanation to the picture 11 :
No1 there is a dotted green line, it means that the meeting took place, and the two level are visible.
It was a Bullish Candle with a long wick and that candle was reunited with a Bearish candle that was open higher than the HH of that wick, then the bearish Candle Bounce back and closed as a Bullish candle. But it was open higher than the HH of the wick
No2 Red dotted line, it means the indicator already marked the meeting, it is over. It was a Bearish candle with a long wick and it was reunited by a Bullish candle that was open below the Lowest Low of that Wick.
No3 another Red dotted line, it means the indicator already marked the meeting, it is over. It was a Bearish candle with a long wick and it was reunited by a Bullish candle that was open below the Lowest Low of that Wick 7 -8 hours later
No4 Green solid line starting from a Bullish candle with a long tail, waiting for a bearish 1h candle to come to that level.
No5 Red solid line starting from a Bearish Candle with a long wick, waiting for a bullish candle to come to meet and reunite. The bullish candle will have to be open BELOW the Lowest Low of that wick.
No6 Another Red solid line starting from a Bearish Candle with a long wick , waiting for a bullish candle to come to meet and reunite. The bullish candle will have to be open BELOW the Lowest Low of that wick.
No7 Another Red solid line starting from a Bearish Candle with a long wick , waiting for a bullish candle to come to meet and reunite. The bullish candle will have to be open BELOW the Lowest Low of that wick.
No8 Another Green solid line starting from a Bullish candle with a long tail, waiting for a bearish 1h candle to come to that level
No9 Another Green solid line starting from a Bullish candle with a long tail, waiting for a bearish 1h candle to come to that level
Attention No 9 . Because that bearish candle is already close to the meeting place. ON 1M chart there should be a 15 min long GREEN Box waiting for the candle to enter it. When any 1M candle since that moment will touch the green box, the meeting will be completed. And the box will not travel any longer. The Box will remain for the next 100 days as a sign of that meeting and on 1H chart there should be a small green dotted line as a sign that the meeting was completed.
All colors, lines should be in the menu to change.
Copy rights to Jack Wheadon
www…….
Source code in English only please.