Specification
Hi,
I want to create 2 indicator below. The explanation here is quite long since it is exactly what you need when you code.
Thank you,
HHC
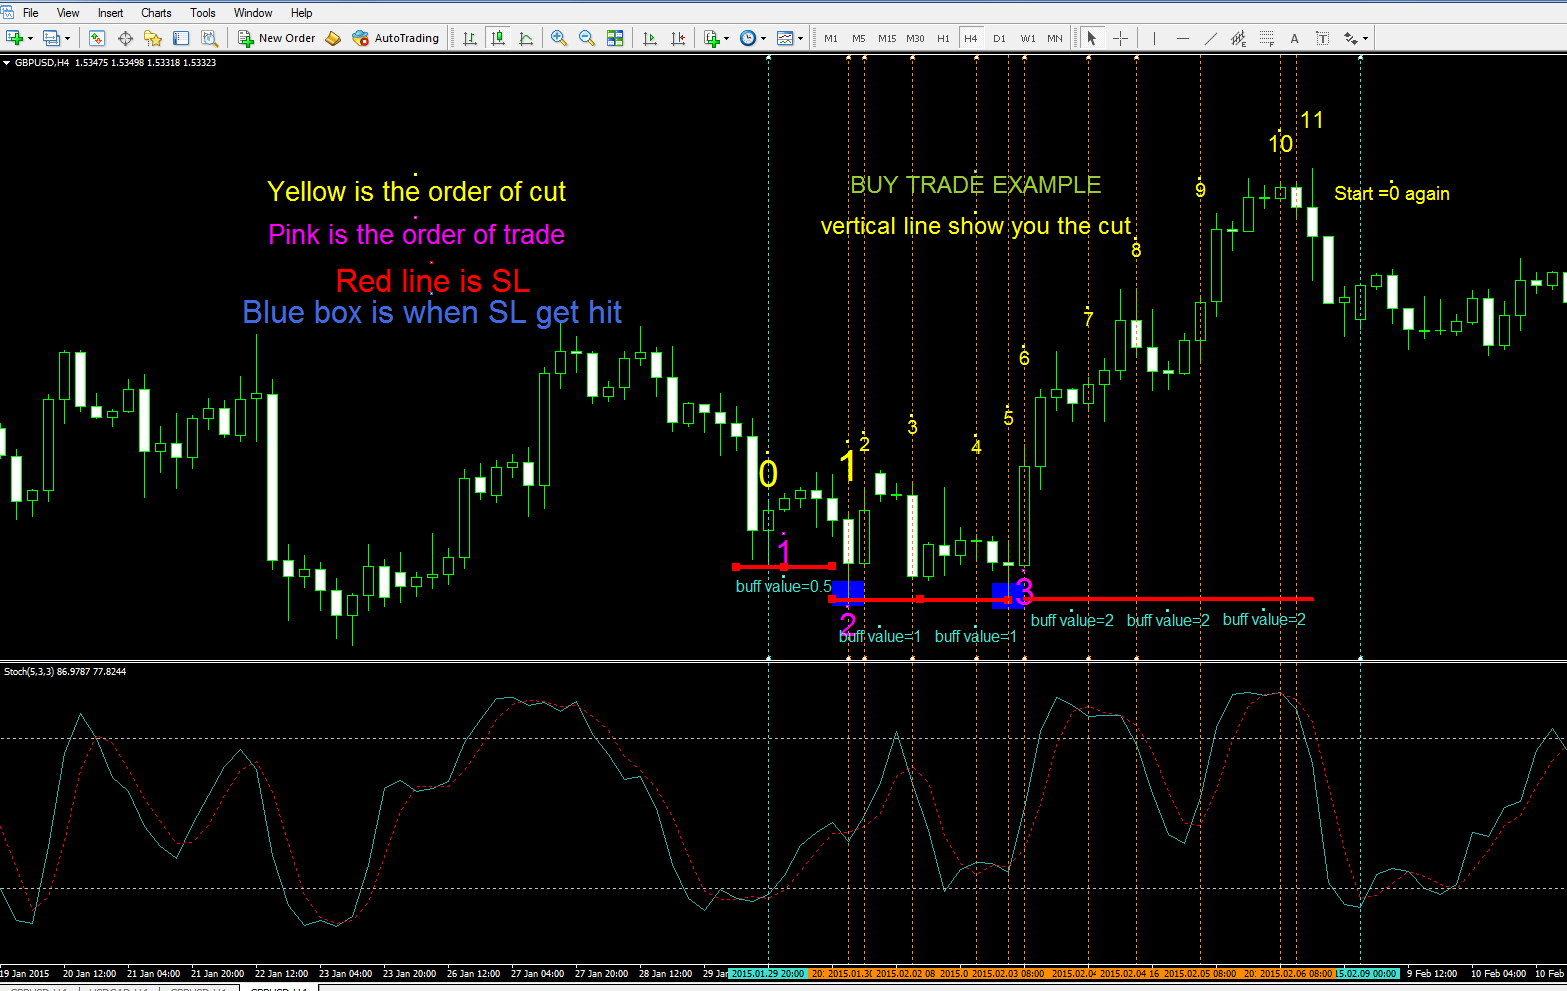
Picture example is on GBPUSD 2015.01.29 H4
Both indicator use (for i=; ; i++) I want (i++)
Indicator 1.
Name: Sto_cut_order
When sto cut up from below 25, start tracking any time Sto Cut (up or down)
The indicator will return Buffer value name “Sto_cut_up_order” that take value from 1 to n.
Anytime Sto cut, this buffer increase value by 1
Only bar with sto cut has Buffer value.
The series end when cut happened at below 25 again.
Similarly, you create “Sto_cut_down_order” Buffer starting when sto Cut down from 75.
So when Sto keep stay below 25 and make cut, you will have a number of 1, 1 , 1.
(in the picture, I mistakenly code it to start from 0. Should be 1 at beginning)
Please make “input double” on the level 25 and 75
Put it in separate window and DRAW_HISTOGRAM
“Sto_cut_up_order” take value 0 1 2 3..
“Sto_cut_down_order” take value 0 -1 -2 -3..
Indicator 2.
Name: trade_order
Buffer 1: Number_loss_buy
At each cut bar[i] taken from Indicator1, give SL= Low of [i,i+1,i+2]
Parameter on the number of bar to calculate SL
Start the tracking process.
1. Starting from Sto_cut_up_order=1, put Number_loss_trade=0.5 (I don’t choose 0 since 0 will not show up on Histogram). Then when SL[Sto_cut_up_order=1] is hit, put Number_loss_trade=1;
2. Starting from this bar (where SL is hit), track the next cut (including the cut occur in this bar). When SL is hit, give Number_loss_trade=2
3. And continue tracking for the rest of the series.
Note, this buffer has value for all bars. So it
look like that
0.5 0.5 0.5 1 1 1 1 2 2 2
Do the same for Sell series. Number_loss_sell
Put it in separate window and DRAW_HISTOGRAM
“Number_loss_buy” take value 0.5 1 2 3..
“Number_loss_sell” take value -0.5 -1 -2 -3..