 All orders
 Rules
Rules
Job finished

Specification
I have an indicator, it's an oscillator. I want to plot a sine wave on it that fits its shape closely: for this it needs to change amplitude, phase and period (frequency) all the time (because the oscillator is based on the market, which is not periodic). One of the buffers in the code should be the period of the sine wave: this is what I am interested in as an input for other indicators, so I should be able to use that: comment in the code which buffer it is in, and the code should be written that it is easy for me to take that value as an input for another indicator, or other code that will be added by me. So the idea is to break down an existing indicator into sine waves: decompose the signal with a 1 term Fourier decomposition f(x) = a0 + a1*cos(x*w) + b1*sin(x*w). Fourier theory states that if the signal is stationary, you can break down any signal using sine and cosine functions as basis functions.
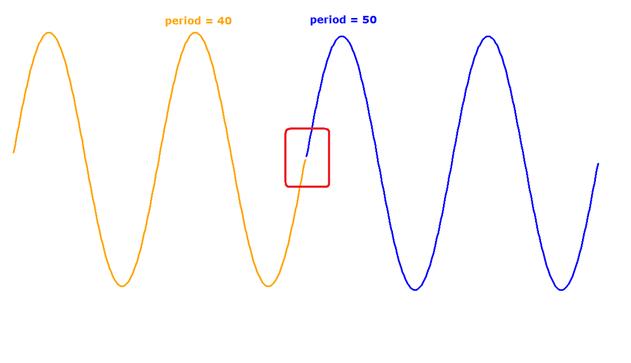
The transition from the first sine wave (orange) with the first period (40) into the next sine wave (blue) with the next period (50) can be smooth if the difference in periods is not too large and the phase of the next wave is chosen to smoothly continue the previous one: the key thing is that the phase will have a value as if it was continuing the same wave: only the period and amplitude change: if you look at the red rectangle, you see that the blue curve is almost a continuation of the orange curve: in sine wave terminology this means that the phase of the combined wave only changed a little more than what one would expect if the orange wave would continue.
The important element here is that the shape needs to be continuous: no sudden changes unless the input signal (indicator it’s calculated on) changes really suddenly.
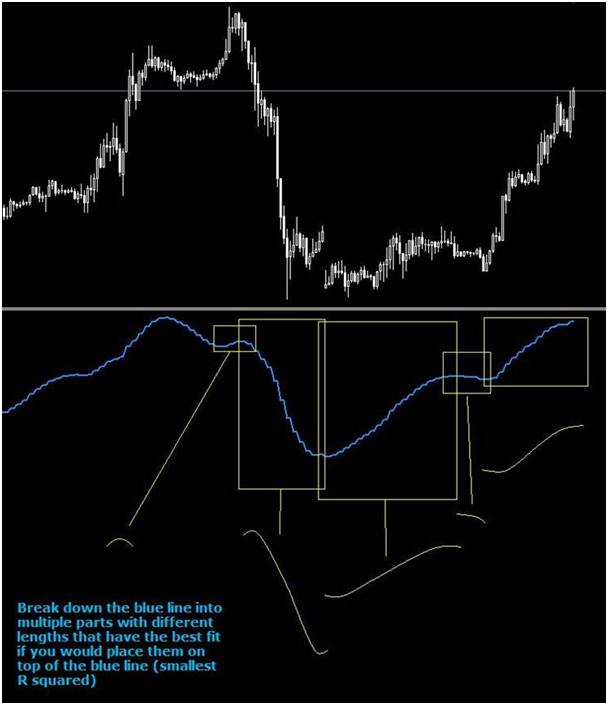
So above the picture is somewhat wrong because it thinks of this task as trying to fit segments of sines to the input signal: this is not really the case: you need to use the trick with the phase (use previous’ bar sine’s phase) to create a continuous output signal.
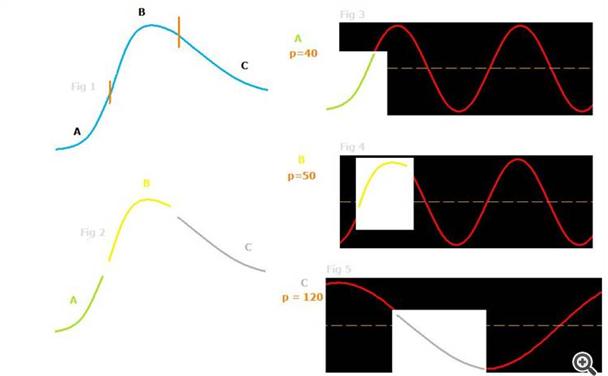
Above, if you look at the blue curve in Figure 1, you see that it first goes up, it accelerates its increase, then it reaches a maximum and then it goes down: first a bit quicker, then a bit slower. Now if you cut the blue line where the small vertical red lines are drawn you get pieces A, B & C as in Figure 2: green, yellow and gray respectively. Now if I look at the sine wave indicator that I attached, and leave the phase at 0 and the period at 1, and I play a bit with the period variable to get a sine wave from which part A could be cut out of, I see, after a bit of trial and error, that part A could be a part from a sine wave with a period of 40 (approximately: I did this manually, so I'm probably off by a more than a few digits): as you see in Figure 3: the red curve (sine wave with period 40) can pretty much follow the green curve (part A) without any interruption. The same goes for Figure 4 where the yellow curve (more or less: remember I drew it manually) is the start for a continuously flowing sine wave with period 50. In Figure 5 we see again that part C fits right into a part of a sine wave with period 120.
So in this example, the blue line is a combination of 3 sine waves: one with period 40, that turns into one with period 50, that gradually transforms into one with period 120. The interesting element is that we can see this in real time: if the period of the wave would be a constant 40,like in part A, there would be no fit any more. In fact there is probably an increase between part A and B: I should have put another piece in there because the blue line keeps increasing too long: this is where the period should be increased, and maybe even the amplitude also. So you are actually continuously fitting pieces of sine waves onto your input data.
Please use this type of loop:
int start()
{
int limit;
//double ...;
int counted_bars=IndicatorCounted();
if(counted_bars<0) return(-1);
if(counted_bars>0) counted_bars--;
limit=Bars-counted_bars;
for(int i=0; i<limit; i++)
{
// here comes your code
}
return(0);
}
The indicator will be given in a private message once you accept the project. I can also give you a primitive sine wave indicator in mql4 (that doesn't change phase, frequency and amplitude) and a linear regression indicator.