Job finished
Specification
i want an EA for MT4, the strategy itself is not important, i just want to learn how to write an EA that when i drag the EA, on the chart, it will plot all indicators all buy & sell signals, cut loss and targeted profit
We can use a very simple
extern int Profit_target=200;
extern int Stop_loss=100;
input int Magic_num = 0001;
extern double Lot_size = 10;


void OnTick()
  {
//---
   // Get the profit target price and the stop loss price
   double Long_TakeProfitLevel = Bid + Profit_target*Point; //0.0001
   double Long_StopLossLevel = Bid - Stop_loss*Point;
   double Short_TakeProfitLevel = Ask - Profit_target*Point; //0.0001
   double Short_StopLossLevel = Ask + Stop_loss*Point;

   // Check if the long condition happen and place order accordingly
   if (Enter_long()&& OrdersTotal()==0 ) y
   {

   Open_Enter_long(Lot_size,Long_TakeProfitLevel,Long_StopLossLevel,"First_Enter");

   }
   else if (Exit_long() && OrdersTotal()>0)
   {
      Close_Exit_long("Close_Exit_long");
   }

   // Check if the short condition happen and place order accordingly
   if (Enter_short()&& OrdersTotal()==0 ) //if more the one signal, could be Enter_long1, Enter long2 or Signal1, Signal2... //OrdersTotal depend on strategy
   {

   Open_Enter_short(Lot_size,Short_TakeProfitLevel,Short_StopLossLevel,"First_Enter");

   }
   else if (Exit_short() && OrdersTotal()>0)
   {
      Close_Exit_short("Close_Exit_short");
   }

  }
EMA crossing strategy for this EA (As i said, the strategy is not important at all) to demonstrate what i want
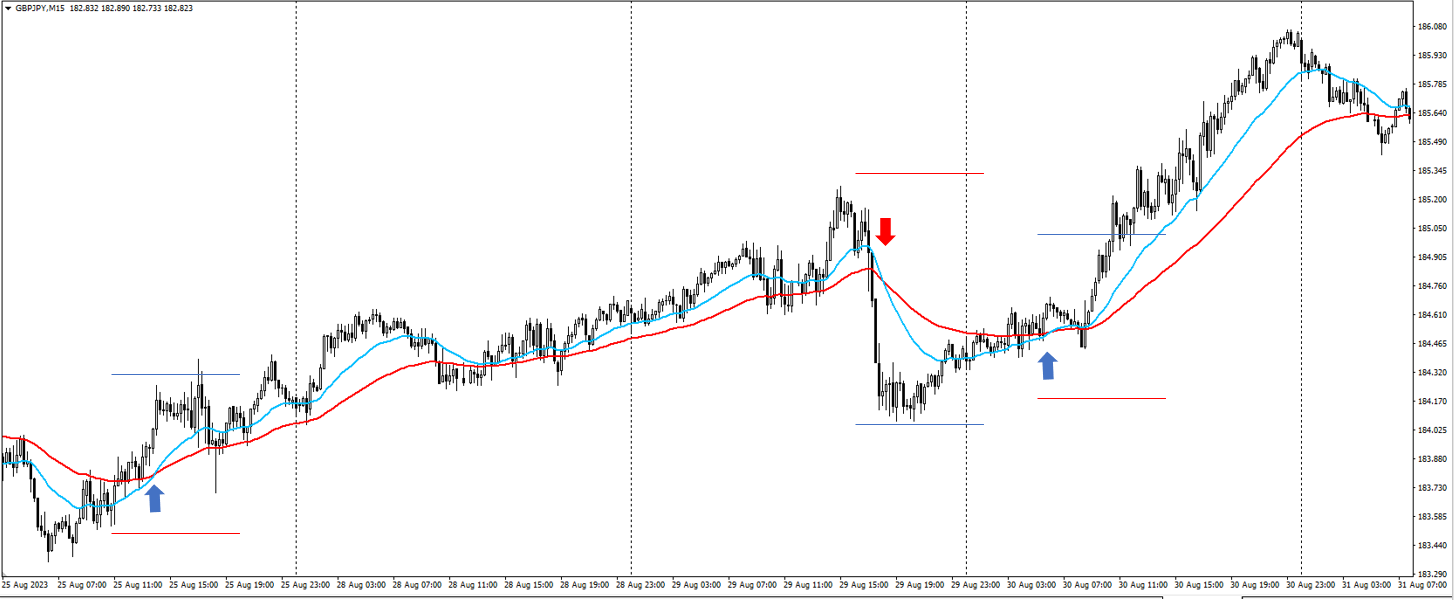
you can see i use arrows to plot all crossing up and down (buy and sell signal), i don’t know can it be coded, if not, pls provide a suggestion that can make me clear to see buy and sell signal
And i use Red and Blue horizontal lines to demonstrate Cut loss price and targeted-profit price, and again, i don’t know can it be coded, if not, pls provide a suggestion
Moreover. want the code will write as the follow format, which using function() for easy apply to other EA (the code is incomplete and may wrong, cos i am not good at it)
void OnDeinit(const int reason)
  {
//---

  }
//+------------------------------------------------------------------+
//| Expert tick function                                             |
//+------------------------------------------------------------------+

//1.Basic Settng
// Define global variables
extern int Profit_target=200;
extern int Stop_loss=100;
input int Magic_num = 0001;
extern double Lot_size = 10;


//2.Basic detect Enter & Exit


void OnTick()
  {
//---
   // Get the profit target price and the stop loss price
   double Long_TakeProfitLevel = Bid + Profit_target*Point; //0.0001
   double Long_StopLossLevel = Bid - Stop_loss*Point;
   double Short_TakeProfitLevel = Ask - Profit_target*Point; //0.0001
   double Short_StopLossLevel = Ask + Stop_loss*Point;

   // Check if the long condition happen and place order accordingly
   if (Enter_long()&& OrdersTotal()==0 )
   {

   Open_Enter_long(Lot_size,Long_TakeProfitLevel,Long_StopLossLevel,"First_Enter");

   }
   else if (Exit_long() && OrdersTotal()>0)
   {
      Close_Exit_long("Close_Exit_long");
   }

   // Check if the short condition happen and place order accordingly
   if (Enter_short()&& OrdersTotal()==0 )
   {

   Open_Enter_short(Lot_size,Short_TakeProfitLevel,Short_StopLossLevel,"First_Enter");

   }
   else if (Exit_short() && OrdersTotal()>0)
   {
      Close_Exit_short("Close_Exit_short");
   }

  }
Enter long = EMA 24 cross up EMA 60
Enter short = EMA 24 cross down EMA 60
Exit long = EMA 24 cross down EMA 60
Exit short = EMA 24 cross up EMA 60
And since it is a learning of how to plot all indicators and all buy & sell signals, so pls write some description for elaboration