 All orders
 Rules
Watch how to order a trading robot
Read the Rules before you post an order or execute it
How to Order a Trading Robot in MQL5 and MQL4
See a sample Requirements Specification to order a robot
New orders in the category:
30+ USD
30 - 2000 USD
30 - 60 USD
30+ USD
30 - 250 USD
Job finished
Execution time 1 day

Feedback from customer
Great developer! Finished the project on time. And exactly as requested.
Specification
I am looking for a developer that has some strong experience in developing indicators, since I'm hoping to have this project completed rather quickly. I am looking for this indicator to help me define when to open trades in my trading project. To save time, please provide a summary of your previous development work and history. If not, I will ask for that information and that will just take more time.
I REALLY appreciate the level of skill and expertise that exists here among the developers on MQL5.
I believe that the rules are rather simple, so the coding should be quite straight forward.
The source code is to be delivered at the completion of the project.
Thank you!
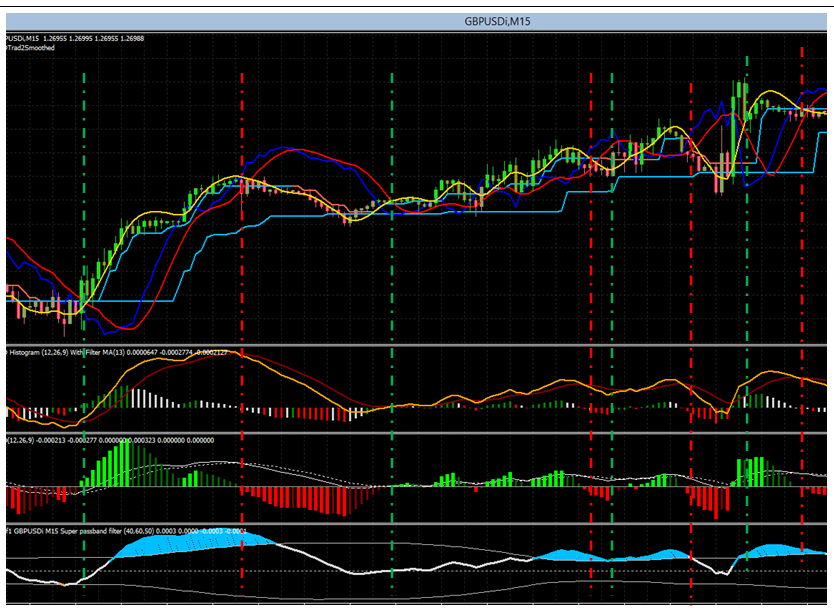
The definition of this indicator is as follows...
Rules for Trade Open Signals (BUY Example, SELL signals use the opposite rules)
1. MACD Trad2 Smoothed Blue Line is below the candle body at the close of the candle AND
2. OT3MA (yellow line) is UP AND
3. MACD Histogram Wis is above zero AND
4. Scrolling back to the first candle where the body of the candle is above MACD Trad2 Blue Line, there was no other BUY signal (This condition MIGHT be at the closed candle... but this rule just allows for MACD Histogram Wis to 'catch up' if it is behind in crossing above zero)
5. THEN display a LIME bar with a value of +1 in the new indicator window (SELL Signals are -1 and display a RED bar)
Rules for Trade Close Signals (BUY Example, SELL signals use the opposite rules)
1. The previous signal generated by this indicator was a BUY signal AND
2. The MACD Histogram Wis bar at the closed candle is lower than the same indicator at the previously closed candle AND
3. Super Passband Indicator is BLUE or WAS BLUE at its most recent high
4. THEN display a GREEN bar with a value of +1 in the new indicator window (SELL signals are -1 and display an ORANGE bar)
Secondary rules for Trade Close Signals (BUY Example, SELL signals use the opposite rules)
1. The previous signal generated by this indicator was a BUY signal AND
2. The MACD Histogram Wis bar at the closed candle is lower than the same indicator at the previously closed candle AND
3. MACD Histogram Wis bar at the previously closed candle was a minimum of (Minimum Close MACD Size) AND
4. Super Passband Indicator is DOWN
5. THEN display a GREEN bar with a value of +1 in the new indicator window (SELL signals are -1 and display an ORANGE bar)
Responded
1
Rating
Projects
1736
49%
Arbitration
55
67%
/
16%
Overdue
38
2%
Free
2
Rating
Projects
53
38%
Arbitration
8
13%
/
38%
Overdue
8
15%
Free
3
Rating
Projects
3428
68%
Arbitration
78
49%
/
14%
Overdue
343
10%
Working
Published: 1 code
4
Rating
Projects
200
12%
Arbitration
39
38%
/
33%
Overdue
5
3%
Free
Published: 2 codes
Similar orders
//+------------------------------------------------------------------+ //| Durban Gold Hunter.mq5 (v3.00) | //| Multi-pair EA for MetaTrader 5 (Razor Markets, XM). | //| Strategy modules (each can be switched on/off): | //| 1. EMA crossover | //| 2. 714 method (EMA 7 + RSI 14) | //| 3. CRT (Candle Range Theory: range sweep and close back inside)| //| 4. Trend line breakout (auto-drawn from swing highs/lows) | //| 5
I want NinjaTrader to behave like Tradovate. When I hover over a candlestick, the cursor should automatically snap to the center of that candle across all open charts. For example, when I hover over a 30-minute candle, the cursor should align with the center of the corresponding candles on the 15-minute and other chart timeframes. I also want vertical lines drawn on one chart to automatically align with the center of
Hello, I already have an MT5 Expert Advisor for XAUUSD based on Fibonacci, market structure, BOS/CHoCH and swing trading. I need an experienced MQL5 developer to modify my existing EA, not develop a completely new one. Required modifications: Partial take-profit system with multiple TP levels. Keep profit targets conservative, using Fibonacci extension levels. Stop-loss placement beyond liquidity areas, not exactly
Hello, I am an independent developer selling an Expert Advisor (EA) on the MQL5 Market. I am looking for an experienced Forex affiliate marketing company or professional marketer to promote my existing MT5 trading robot to customers worldwide. My proposed partnership offers a 35% commission per verified sale, with the possibility of a long-term collaboration. I would like to know: Do you promote third-party MT5
The objective is to develop a custom technical indicator for MetaTrader 5 (MQL5) that replicates the exact visual structure, inputs, and features of the "AYN-Indicator by Snurk" as shown in the provided screenshot. The indicator must analyze price actions based on a flexible lookback period, plot dynamic trend filters, and render precise Buy/Sell breakout labels without any lagging or repainting
Requirements Specification: Debug & Error Fixing: Review the entire source code of the MQL expert advisor. Identify and fix all logical errors, bugs, and performance issues that cause trades to close prematurely or yield extremely low profits. Strategy Restructuring & Optimization: Fully analyze and optimize the current entry and exit strategy for USDJPY and GBPUSD. Modify, upgrade, or completely rewrite the entry
Winter
500+ USD
I am looking for an MQL5 developer to independently review an existing EA’s execution and position management logic. The review should focus on duplicate orders, trade isolation by symbol and magic number, broker price and volume constraints, error handling, and recovery after a terminal restart. This order is for an audit report. Please do not modify the source or change the trading strategy. For each finding
Title: Fully Automatic MT5 Trading Bot (Expert Advisor) with Risk Management I want a fully automated trading robot (Expert Advisor) for MetaTrader 5, written in MQL5. The bot must automatically analyse market data, identify trading opportunities, execute BUY and SELL orders, manage open positions, and close trades according to predefined rules without requiring manual confirmation for each trade. Requirements
The Traffic Rush
250 - 500 USD
Subject: Inquiry: MQL4 Optimization & Refinement for Proprietary Binary Suite (Pine-to-MT4) I am seeking an experienced MQL4 / MetaTrader developer to optimize and finalize a custom binary options trading suite. Project Summary Core Architecture: Multi-pair Regime Scanner (22-pair FX basket monitoring state/score) and a Signal Engine operating on M1 charts. Strategy Sequence: Pre-Alert Dot: Placed on a candle closing
Tradingview pine script bot
30+ USD
Hello I want some that can help with my strategy signal I have the video that you are going to watch if you know you can help me with kindly do well to bid and let discussed it an urgent project and also if you can not work before you get paid please don bid thanks
Project information
Budget
50 - 150 USD
Deadline
from 1 to 2 day(s)