Job finished
Specification
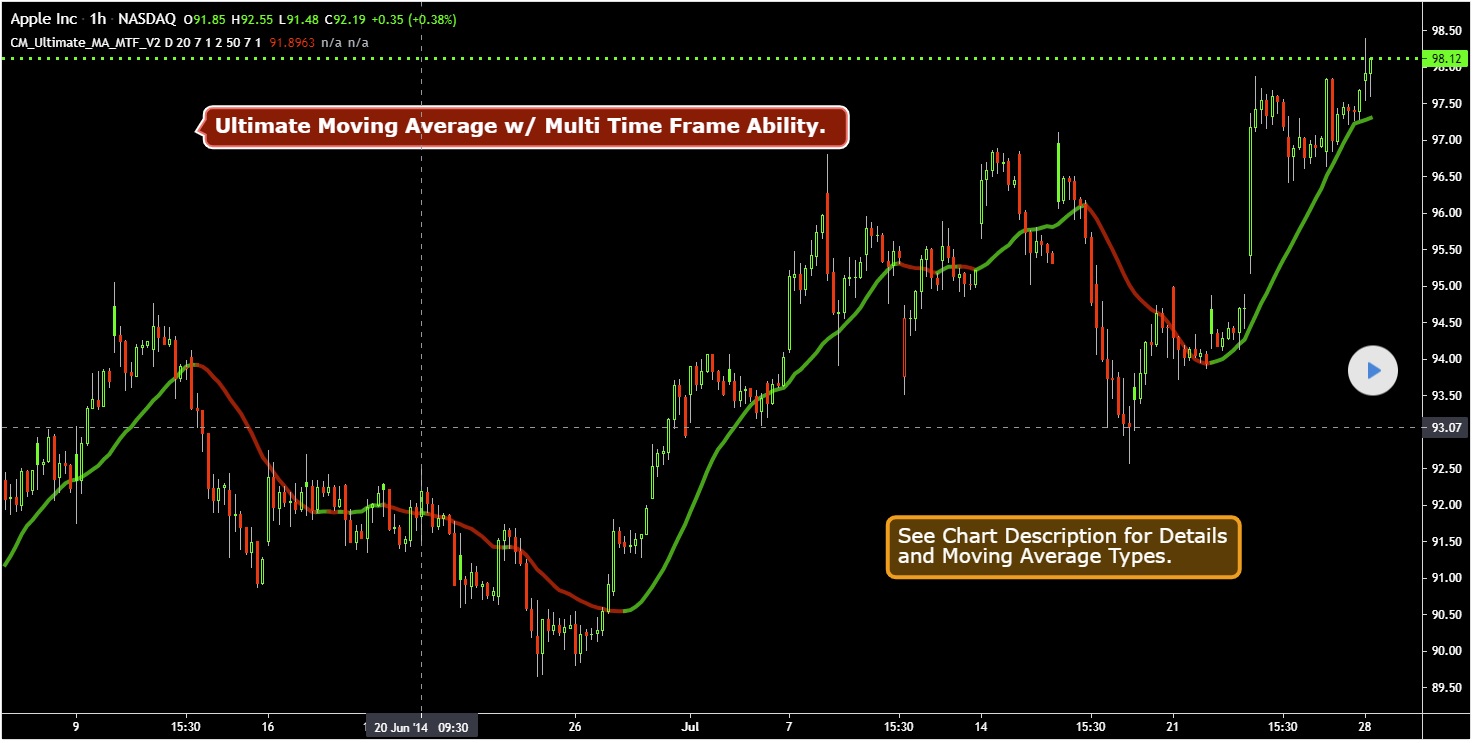
Hi I would like to have a trading robot build based on a trading view indicator (Moving Average) and then supplemented with extra settings.
In the attachment I have added the script with a screenshot of the indicator
The robot must perform the following: When the color/direction changes, the open position must be closed and a new one opened based on the new color/direction. The new position will then remain open until the color/direction changes again. This should keep repeating until you turn off the robot
I would like to have the following options on it:
· Stoploss with the function to turn it on or off and then the number of points distance
· The ability to automatically bring the stop loss to the breakeven level and then a few points just above it so that any commissions are covered. This option must be able to be turned on or off and then the distance at which it is activated in points.
· The lot size specified on which the Expert Advisor will trade.
· The ability to activate a trailing stop which can then be turned on or off with the distance in points at which it follows the stock market
· Defaults to Current Timeframe on Chart.
· Ability to set Moving Averages to Custom Chart TimeFrame. Example Daily Mon on 60 Minute chart. Many Different Options from Weekly to 1 Minute. (just like in the indicator on tradingview)
· Use different timeframe what you can select.
· Change color based on direction in the graph. just like in the indicator
· The moving averange length - lookback period adjustable in days. Just like in the indicator on tradingview.
· The ability to set how the moving range goes. 1=SMA 2=EMA 3=WMA 4=HullMA. Just like in the indicator on tradingview.
· Everything must be operated/changed with a simple menu, nothing complicated.
Below is a copy of the script of the indicator on tradingview on which the Expert Advisor should be based
Moving Averages Supported in Inputs Tab
SMA - Simple Moving Average
EMA - Exponential Moving Average
WMA - Weighted Moving Average
HullMA - Hull Moving Average
VWMA - Volume Weighted Moving Average
Script:
//Created by user ChrisMoody 4-24-2014...Updated 7/28/2014 added Tilson T3
//Modified on 5-5-14 for 4apprentice08 with Optional BarColor based on Price Crossing MA #1, or #2
//Modified on 7-25-2014 to Add in Tilson T3
//Plots The Majority of Moving Averages
//Defaults to Current Chart Time Frame --- But Can Be Changed to Higher Or Lower Time Frames
//2nd MA Capability with Show Crosses Feature
study(title="CM_Ultimate_MA_MTF_V2", shorttitle="CM_Ultimate_MA_MTF_V2", overlay=true)
//inputs
src = close
useCurrentRes = input(true, title="Use Current Chart Resolution?")
resCustom = input(title="Use Different Timeframe? Uncheck Box Above", type=resolution, defval="D")
len = input(20, title="Moving Average Length - LookBack Period")
//periodT3 = input(defval=7, title="Tilson T3 Period", minval=1)
factorT3 = input(defval=7, title="Tilson T3 Factor - *.10 - so 7 = .7 etc.", minval=0)
atype = input(1,minval=1,maxval=8,title="1=SMA, 2=EMA, 3=WMA, 4=HullMA, 5=VWMA, 6=RMA, 7=TEMA, 8=Tilson T3")
spc=input(false, title="Show Price Crossing 1st Mov Avg - Highlight Bar?")
cc = input(true,title="Change Color Based On Direction?")
smoothe = input(2, minval=1, maxval=10, title="Color Smoothing - Setting 1 = No Smoothing")
doma2 = input(false, title="Optional 2nd Moving Average")
spc2=input(false, title="Show Price Crossing 2nd Mov Avg?")
len2 = input(50, title="Moving Average Length - Optional 2nd MA")
sfactorT3 = input(defval=7, title="Tilson T3 Factor - *.10 - so 7 = .7 etc.", minval=0)
atype2 = input(1,minval=1,maxval=8,title="1=SMA, 2=EMA, 3=WMA, 4=HullMA, 5=VWMA, 6=RMA, 7=TEMA, 8=Tilson T3")
cc2 = input(true,title="Change Color Based On Direction 2nd MA?")
warn = input(false, title="***You Can Turn On The Show Dots Parameter Below Without Plotting 2nd MA to See Crosses***")
warn2 = input(false, title="***If Using Cross Feature W/O Plotting 2ndMA - Make Sure 2ndMA Parameters are Set Correctly***")
sd = input(false, title="Show Dots on Cross of Both MA's")
res = useCurrentRes ? period : resCustom
//hull ma definition
hullma = wma(2*wma(src, len/2)-wma(src, len), round(sqrt(len)))
//TEMA definition
ema1 = ema(src, len)
ema2 = ema(ema1, len)
ema3 = ema(ema2, len)
tema = 3 * (ema1 - ema2) + ema3
//Tilson T3
factor = factorT3 *.10
gd(src, len, factor) => ema(src, len) * (1 + factor) - ema(ema(src, len), len) * factor
t3(src, len, factor) => gd(gd(gd(src, len, factor), len, factor), len, factor)
tilT3 = t3(src, len, factor)
avg = atype == 1 ? sma(src,len) : atype == 2 ? ema(src,len) : atype == 3 ? wma(src,len) : atype == 4 ? hullma : atype == 5 ? vwma(src, len) : atype == 6 ? rma(src,len) : atype == 7 ? 3 * (ema1 - ema2) + ema3 : tilT3
//2nd Ma - hull ma definition
hullma2 = wma(2*wma(src, len2/2)-wma(src, len2), round(sqrt(len2)))
//2nd MA TEMA definition
sema1 = ema(src, len2)
sema2 = ema(sema1, len2)
sema3 = ema(sema2, len2)
stema = 3 * (sema1 - sema2) + sema3
//2nd MA Tilson T3
sfactor = sfactorT3 *.10
sgd(src, len2, sfactor) => ema(src, len2) * (1 + sfactor) - ema(ema(src, len2), len2) * sfactor
st3(src, len2, sfactor) => sgd(sgd(gd(src, len2, sfactor), len2, sfactor), len2, sfactor)
stilT3 = st3(src, len2, sfactor)
avg2 = atype2 == 1 ? sma(src,len2) : atype2 == 2 ? ema(src,len2) : atype2 == 3 ? wma(src,len2) : atype2 == 4 ? hullma2 : atype2 == 5 ? vwma(src, len2) : atype2 == 6 ? rma(src,len2) : atype2 == 7 ? 3 * (ema1 - ema2) + ema3 : stilT3
out = avg
out_two = avg2
out1 = security(tickerid, res, out)
out2 = security(tickerid, res, out_two)
//Formula for Price Crossing Moving Average #1
cr_up = open < out1 and close > out1
cr_Down = open > out1 and close < out1
//Formula for Price Crossing Moving Average #2
cr_up2 = open < out2 and close > out2
cr_Down2 = open > out2 and close < out2
//barcolor Criteria for Price Crossing Moving Average #1
iscrossUp() => cr_up
iscrossDown() => cr_Down
//barcolor Criteria for Price Crossing Moving Average #2
iscrossUp2() => cr_up2
iscrossDown2() => cr_Down2
ma_up = out1 >= out1[smoothe]
ma_down = out1 < out1[smoothe]
col = cc ? ma_up ? lime : ma_down ? red : aqua : aqua
col2 = cc2 ? ma_up ? lime : ma_down ? red : aqua : white
circleYPosition = out2
plot(out1, title="Multi-Timeframe Moving Avg", style=line, linewidth=4, color = col)
plot(doma2 and out2 ? out2 : na, title="2nd Multi-TimeFrame Moving Average", style=circles, linewidth=4, color=col2)
plot(sd and cross(out1, out2) ? circleYPosition : na,style=cross, linewidth=15, color=aqua)
//barcolor Plot for Price Crossing Moving Average #1
barcolor(spc and iscrossUp() ? (iscrossUp() ? yellow : na) : na)
barcolor(spc and iscrossDown() ? (iscrossDown() ? yellow : na) : na)
//barcolor Plot for Price Crossing Moving Average #2
barcolor(spc2 and iscrossUp2() ? (iscrossUp2() ? yellow : na) : na)
barcolor(spc2 and iscrossDown2() ? (iscrossDown2() ? yellow : na) : na)