All orders
 Rules
Rules
Job finished

Specification
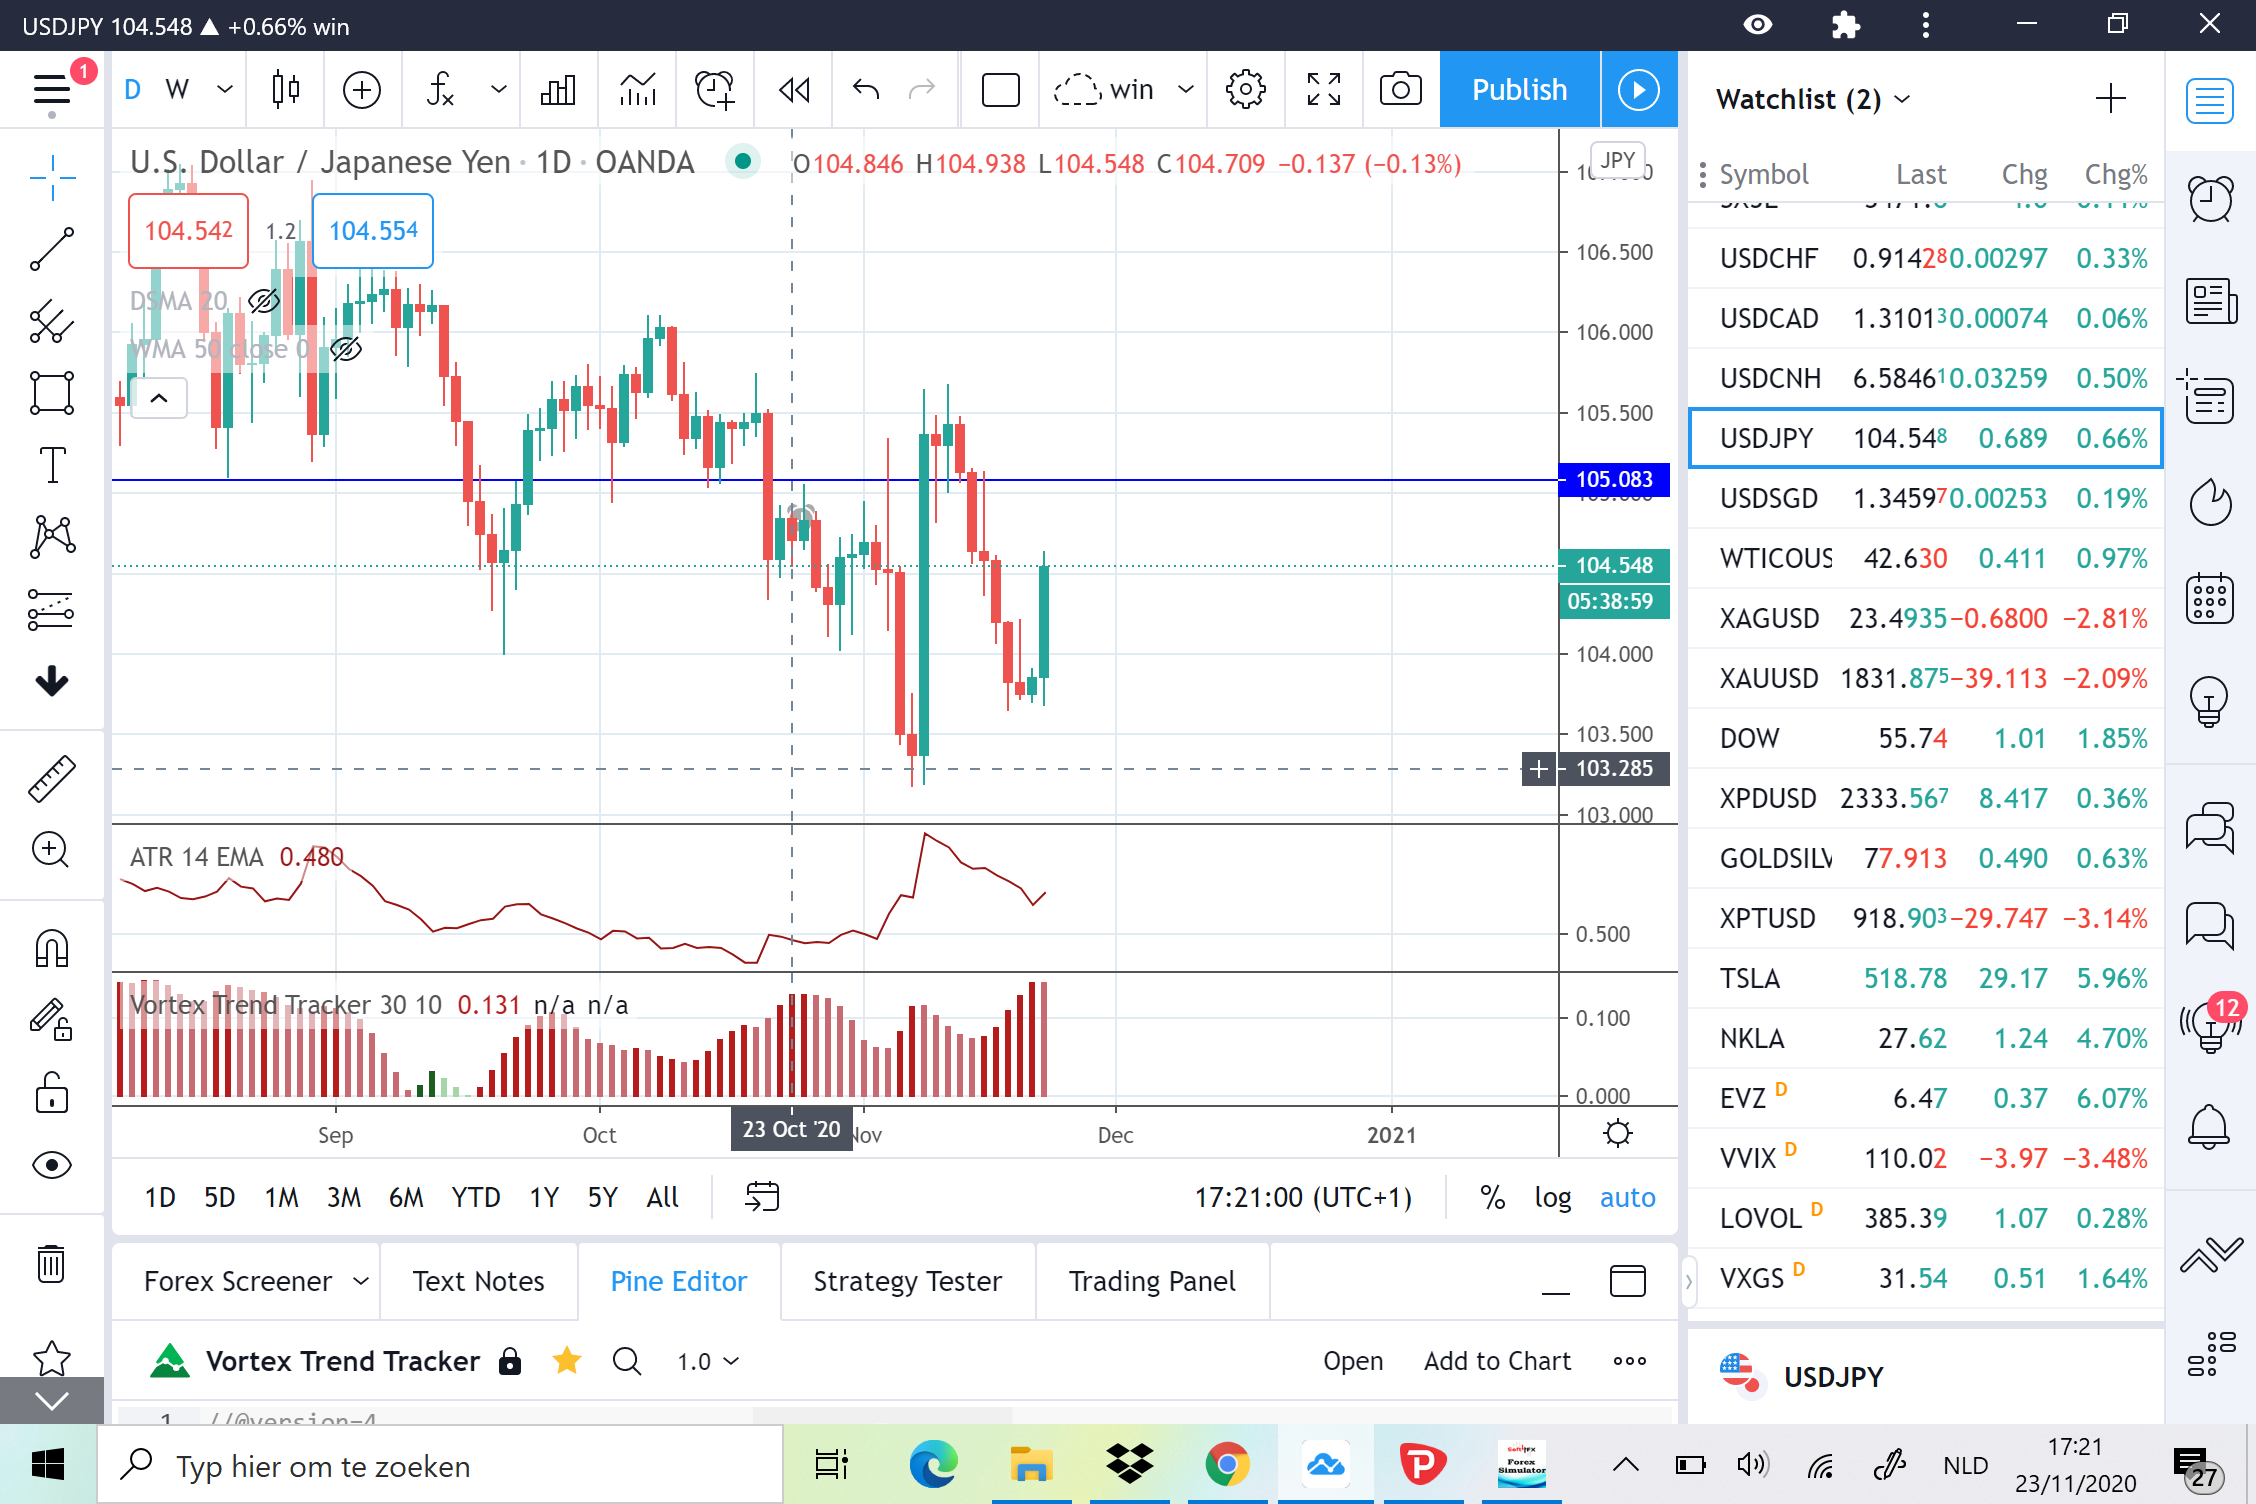
Hi, I need the indicator vortex trend tracker translated into mt4, it needs to be 100% the same, with histogram and colors being darker when there is a clear trend signal
mql5 doesn't let me insert the link, but it is vortex trend tracker of profitprogrammers on tradingview
//@version=4
study("Vortex Trend Tracker")
// INPUT VARIABLES FOR VORTEX:
vortexLen = input(30, title="Length for Vortex", minval=1)
emaLen = input(10, title="Length of Positive and Negative EMA's", type=input.integer, minval=1)
colorBars = input(true, title="Color Price Bars Based on Vortex?")
plotVLines = input(false, title="Plot VI+ and VI- Lines?")
// VORTEX CALCULATION:
//Returns positive and negative trendlines.
vortex(posSum, negSum, vLen)=>
tRange = sum(atr(1), vLen)
vmPlus = posSum / tRange
vmNeg = negSum / tRange
[vmPlus, vmNeg]
[vPlus, vNeg] = vortex(sum(abs(high - low[1]), vortexLen), sum(abs(low - high[1]), vortexLen), vortexLen)
plusEMA = ema(vPlus, emaLen)
negEMA = ema(vNeg, emaLen)
vDiff = abs(plusEMA - negEMA)
// PLOTTING:
var color vColor = na
vColor := plusEMA > negEMA and plusEMA >= plusEMA[1] ? #1b5e20 : plusEMA > negEMA and plusEMA < plusEMA[1] ? #a5d6a7 : negEMA >= plusEMA and negEMA > negEMA[1] ? #b71c1c : negEMA > plusEMA and negEMA < negEMA[1] ? #c76a72 : nz(vColor[1])
plot(vDiff, style=plot.style_histogram, color=vColor, linewidth=3, transp=0)
plot(plotVLines ? plusEMA : na, title="VI +", color=color.green, linewidth=2)
plot(plotVLines ? negEMA : na, title="VI -", color=color.red, linewidth=2)
barcolor(colorBars ? vColor : na)