Watch how to order a trading robot
Read the Rules before you post an order or execute it
How to Order a Trading Robot in MQL5 and MQL4
See a sample Requirements Specification to order a robot
New orders in the category:
30+ USD
50 - 400 USD
30+ USD
30 - 100 USD
100 - 300 USD
Job finished
Execution time 3 days
Feedback from employee
Was pleasure to work with. Would definitely like to work again. Thanks for the job.
Feedback from customer
did a good job, was good to deal with, recommended
Specification
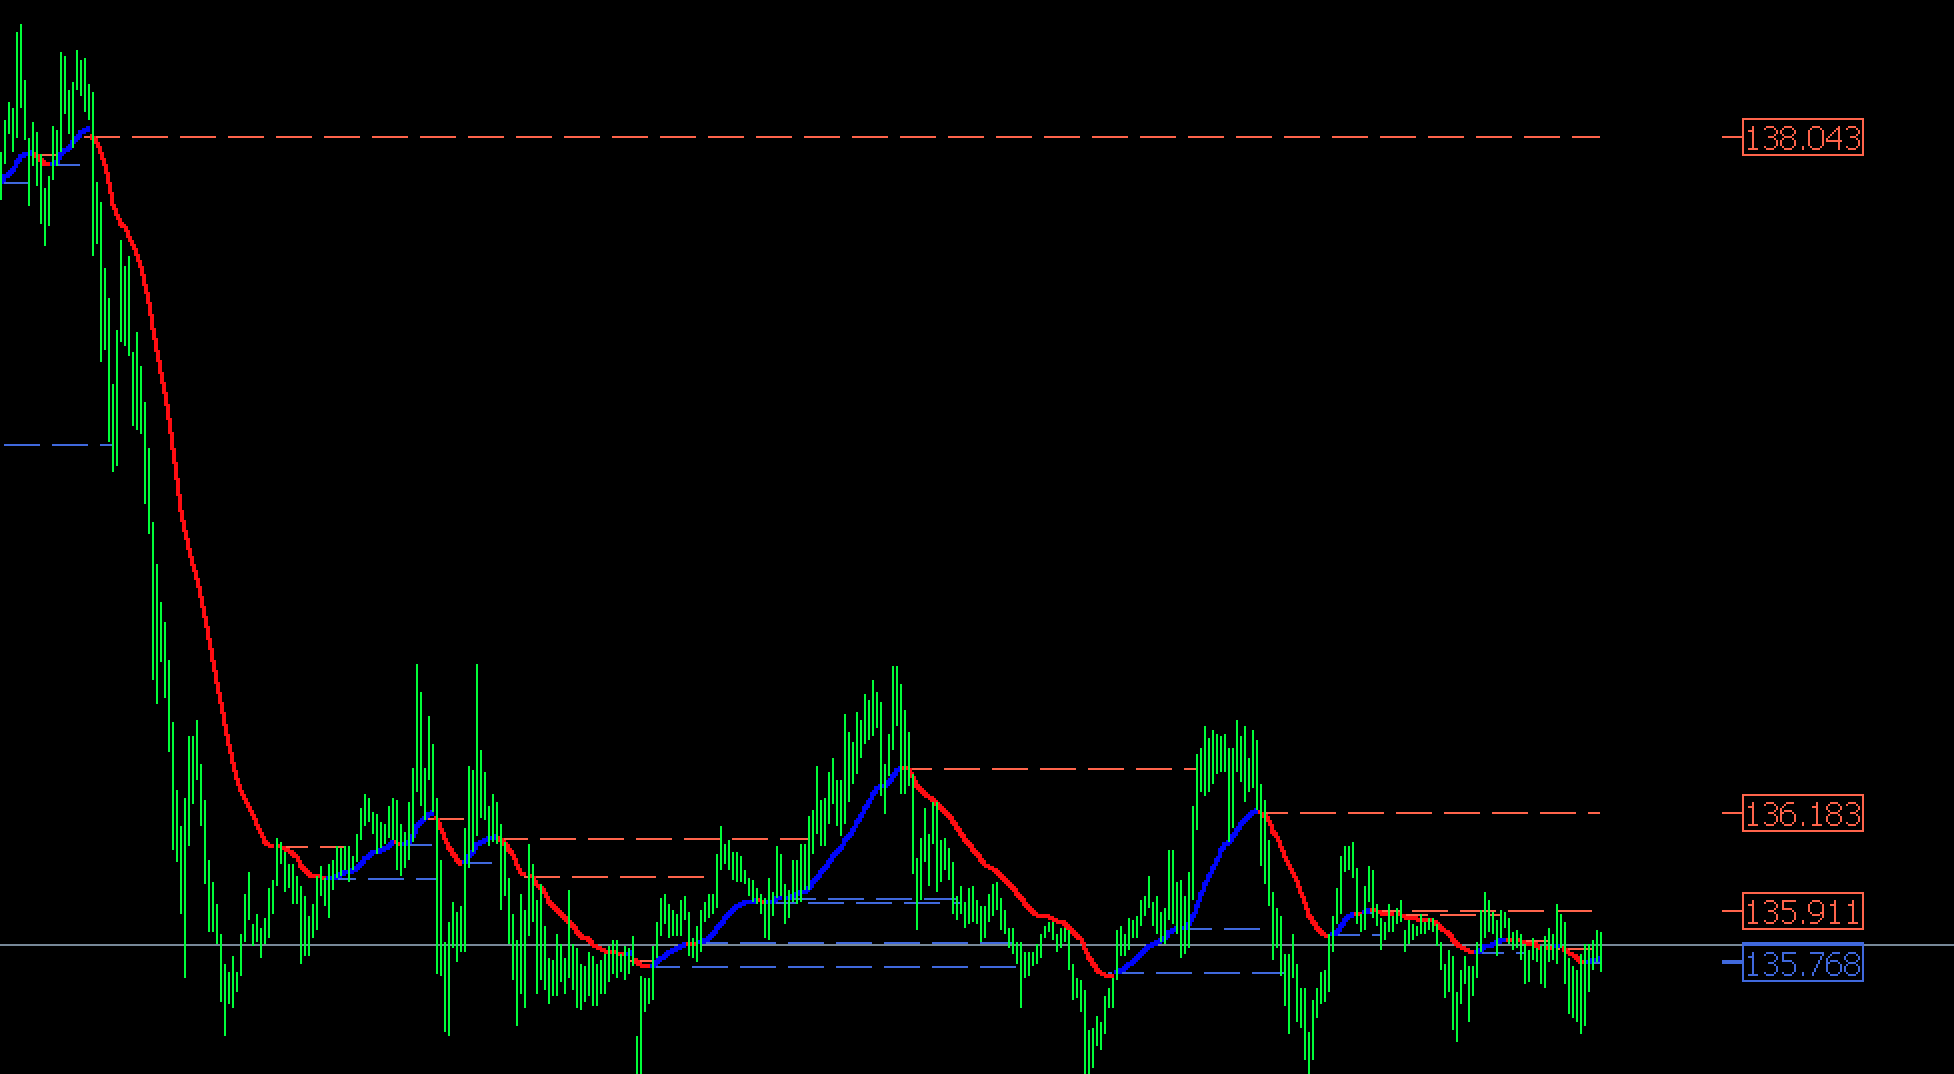
IM looking for someone to code an indicator that already exists, i can example the requirement,.
indicator draws a line when price closes above or below the ema.
Indicator can have the parameters adjusted
indicator line disappears when price revisits the swing line
can be used on all timeframes pairs etc.
must also supply the code thanks
Responded
1
Rating
Projects
96
40%
Arbitration
13
38%
/
62%
Overdue
25
26%
Free
2
Rating
Projects
3075
66%
Arbitration
77
48%
/
14%
Overdue
340
11%
Free
3
Rating
Projects
121
43%
Arbitration
12
33%
/
50%
Overdue
17
14%
Free
4
Rating
Projects
224
33%
Arbitration
27
26%
/
26%
Overdue
23
10%
Free
5
Rating
Projects
3
0%
Arbitration
4
0%
/
100%
Overdue
1
33%
Free
6
Rating
Projects
90
13%
Arbitration
3
33%
/
0%
Overdue
0
Free
7
Rating
Projects
71
30%
Arbitration
8
0%
/
88%
Overdue
5
7%
Free
Similar orders
Hello! I am looking for an experienced Pine Script coder to create a custom indicator for mapping market structure based on fractals. The developer needs to know a lot about coding market structure indicators and be proficient in Pine Script. excited to collaborate with a gifted developer
I have list of free indicators in tradingview and i would like to convert them into an mt4 ea, But the EA will have and work based on the indicators features The list of the are listed as follows :> 1. Market Structure Break And Order block. By EmreKb 2. Rainbow Adaptive RSI by LuxAlgo 3. Multiple MA (21,50,100) 4. SuperTrend My budget for this 80$ max
Code mt4 ea with tradingview indicators sript
50 - 60 USD
I have list of free indicators in tradingview and i would like to convert them into an mt4 ea, But the EA will have and work based on the indicators features The list of the are listed as follows :> 1. Market Structure Break And Order block. By EmreKb 2. Rainbow Adaptive RSI by LuxAlgo 3. Multiple MA (21,50,100) 4. SuperTrend Please don't apply if can't do this, So we won't ourselves time
Source code for indicator
30+ USD
good day i have an indicator but need the source for this reason The indicator only work on a single Time frame open trade, and close with only a single TF i will like the indicator work on multiple time frame just like other installed indicator My coder said the reason it cannot work like other indicator installed is because it has no buffer First confirm if you have the source code because its a popular indicator
Hello! I am looking for an experienced Pine Script coder to create a custom indicator for mapping market structure based on fractals. The developer must be skilled in Pine Script and have a solid understanding of how to code market structure indicators. Looking forward to working with a talented developer
Hello developers, I would like to hire someone can convert the Radar Signal indicator: https://www.youtube.com/watch?v=5DmKcy7rb-U  ; to it's TradingView equivalent. Radar signal indicator is the combination of 7 classic MT4 indicators. They include ADX, RSI , CCI , OsMA, ATR, WPR. The indicator shows the values of these indicators in blue and red. Red color indicates a bearish market condition and the blue shows
Hi , i want a indicator that shows the trades history on the chart, just for current day, like : first trade : -54 Second trade : -52 Third trade : +126 , and after three trades, display "No more trades"
AngelShark system
30+ USD
Hello i need someone who can convert a trading view indicator into an mt5 indicator that can work smoothly also need to add an alert on the indicator i will require to test the indicator run it for 1-2days to confirm all is okay thank you
Here's a clearer step-by-step guide to checking the last 50 candles on your chart and applying Fibonacci retracement levels based on their colors: Identify Candle Color: Start from the 100th candle from the left on the chart and check its color. If the 100th candle is green (i.e., the close is higher than the open): Draw a Fibonacci Retracement: From the highest price to the lowest price of this candle. Check the
Here's a clearer step-by-step guide to checking the last 50 candles on your chart and applying Fibonacci retracement levels based on their colors: Identify Candle Color: Start from the 100th candle from the left on the chart and check its color. If the 100th candle is green (i.e., the close is higher than the open): Draw a Fibonacci Retracement: From the highest price to the lowest price of this candle. Check the
Project information
Budget
30 - 100 USD
For the developer
27
- 90
USD
Deadline
from 1 to 5 day(s)