Watch how to order a trading robot
Read the Rules before you post an order or execute it
How to Order a Trading Robot in MQL5 and MQL4
See a sample Requirements Specification to order a robot
New orders in the category:
30 - 70 USD
50 - 60 USD
30+ USD
30+ USD
Job finished
Execution time 1 day
Feedback from employee
Was pleasure to work with. Thanks a lot for the job. Would definitely like to work again.
Specification
Hi,
I need a hep with an indicator I am getting wrong trend information from the higher time frame. I will need somebody to get it to be able to extract the correct information from the higher time frame.
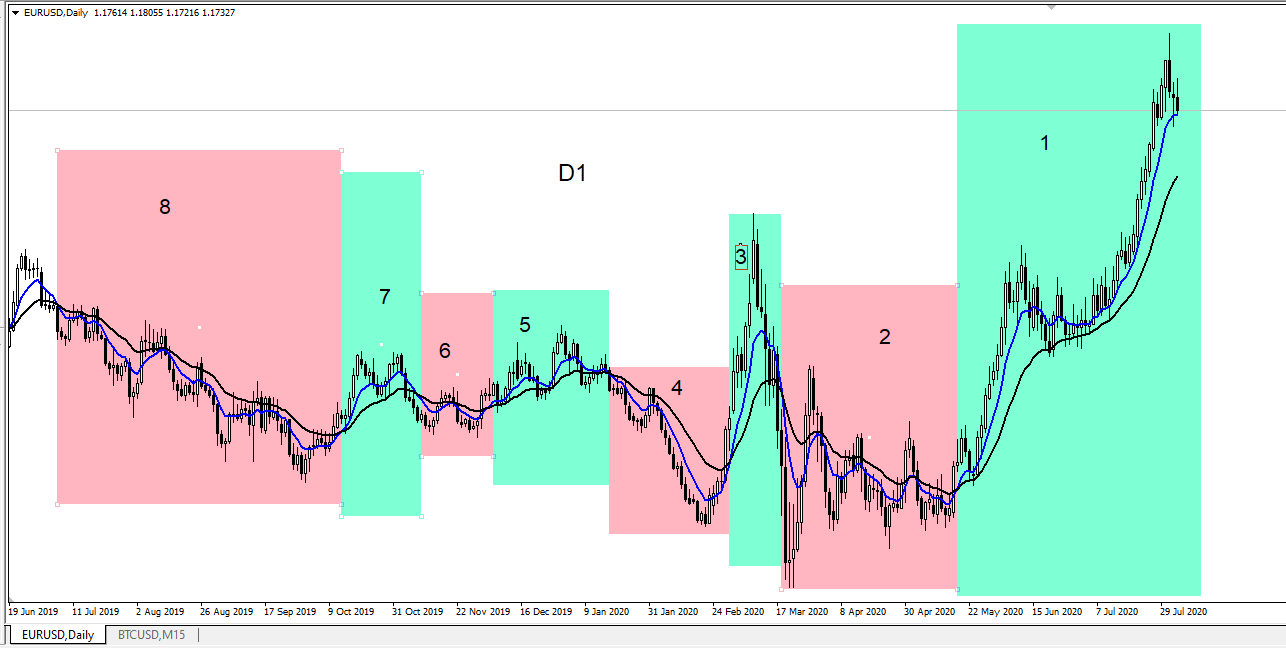
I have split the trends into different colours to identify the trends Green for up and pink for down trend. when I witch to the lower time frames I can see if the signals are following the upper trend or not. Unfortunately it is not working.
From the screen short below you can see it is not following the higher time frame.
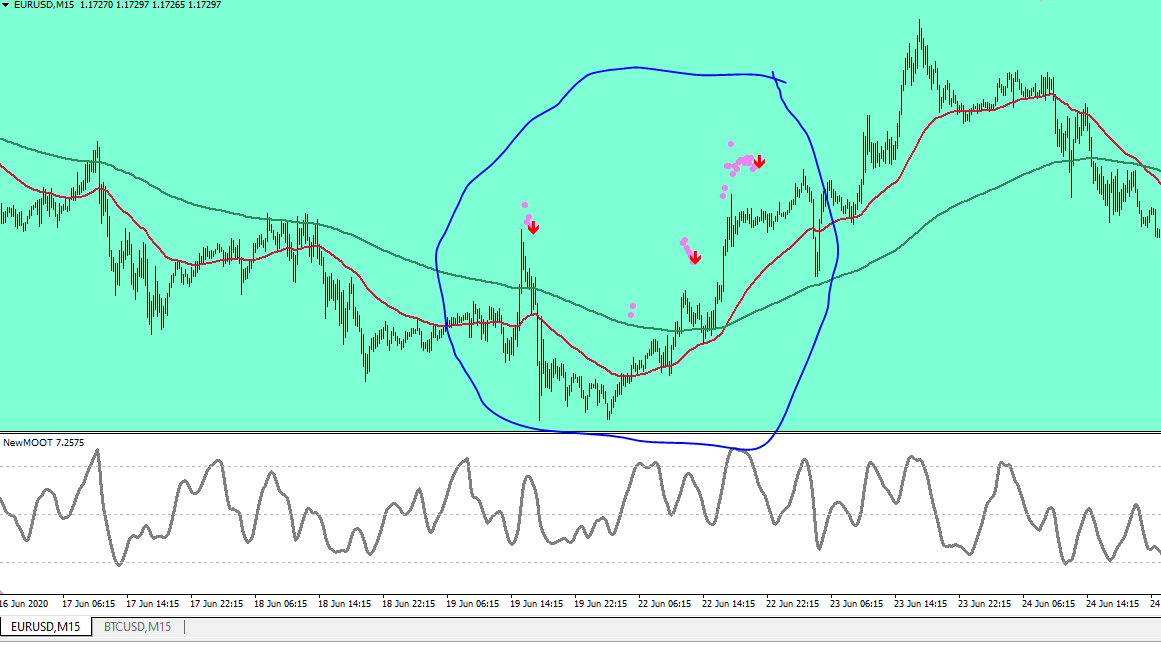
if you can get it working properly let me know and i will send you the code.
Responded
1
Rating
Projects
224
33%
Arbitration
27
26%
/
26%
Overdue
23
10%
Free
2
Rating
Projects
1052
40%
Arbitration
47
49%
/
23%
Overdue
84
8%
Free
3
Rating
Projects
9
0%
Arbitration
1
100%
/
0%
Overdue
3
33%
Free
4
Rating
Projects
12
25%
Arbitration
0
Overdue
1
8%
Free
Similar orders
Here's a clearer step-by-step guide to checking the last 50 candles on your chart and applying Fibonacci retracement levels based on their colors: Identify Candle Color: Start from the 100th candle from the left on the chart and check its color. If the 100th candle is green (i.e., the close is higher than the open): Draw a Fibonacci Retracement: From the highest price to the lowest price of this candle. Check the
Here's a clearer step-by-step guide to checking the last 50 candles on your chart and applying Fibonacci retracement levels based on their colors: Identify Candle Color: Start from the 100th candle from the left on the chart and check its color. If the 100th candle is green (i.e., the close is higher than the open): Draw a Fibonacci Retracement: From the highest price to the lowest price of this candle. Check the
I have an equity reporter. This equity reporter displays the maximum and minimum equity reached over a specific interval. So, if the interval is set to 24 hours, the script will generate data in the format: "Profit ATT" (profit AtThatTime) shows max./min. during the specific interval This specific report shows data in pips. It can also be set to display in price or percentages. The interval is also easily adjustable
I want you to make me an indicator in Training View. Its idea is very simple, and I want it to have an alarm. Here's a clearer step-by-step guide to checking the last 50 candles on your chart and applying Fibonacci retracement levels based on their colors: Identify Candle Color: Start from the 100th candle from the left on the chart and check its color. If the 100th candle is green (i.e., the close is higher than the
Selection of pairs from provided signal for MT4
30 - 50 USD
Hello, is it possible to be made accommodation of provided signal for Forex for mt4? I bought a signal for multiple pairs. it is executing all pair.I want to use it on couple of pairs.Is it possible to be made some modifications?I do not have codes for the signal
I want to receive an alert from the indicator
30 - 60 USD
I have an MT4 indicator, I want to receive an alert on WhatsApp when the indicator gives a buy or sell signal, I already have an API that will send the message, just send the json with the content, I will pass the API link when I have the proposal: { "symbol": "xauusd", "cellphonenumber": "00000000", "message": "test" }
KILL MODE
30 - 60 USD
i Need an expert advisor that trade by signal moving average indictors.it must check and correct the process of possible errors in trading operations. The main criteria of opening and closing positions direction of average moving,price of last bar and set the number of lots to trade as an input parameter
Create an own index or basket which can be traded
30 - 200 USD
Creating a chart composed of different assets, weighted by their trading lot size & quantity. Using this chart to trade the assets in those lot sizes &quantity (by hand or with an EA ) In other words: composing a private index or pair, plotting that as a chart and have the ability to trade it directly with an EA and/or one order click. Inspired by Basket Chart Creator
Hello, I am highly in need of a professional and expert developer who is capable to convert my tradingview indicator to MT5, if you can perfectly do this project kindly meet me at the comment section to proceed
You must have knowledge of forex tester. Don't bother unless you do The indicator to convert from trading view to FOREX TESTER 5 -- wave trend 3d by JDEHORTY Please note this is a multi time frame indicator. Im not interested in any other wave trend indicator. It has to be a conversion of this indicator. Forex tester conversion https://www.youtube.com/watch?v=S64LjZVr9jE code python
Project information
Budget
30+ USD
For the developer
27
USD
Deadline
to 3 day(s)