Watch how to order a trading robot
Read the Rules before you post an order or execute it
How to Order a Trading Robot in MQL5 and MQL4
See a sample Requirements Specification to order a robot
New orders in the category:
30+ USD
30+ USD
50 - 400 USD
30+ USD
30 - 100 USD
100 - 300 USD
Specification
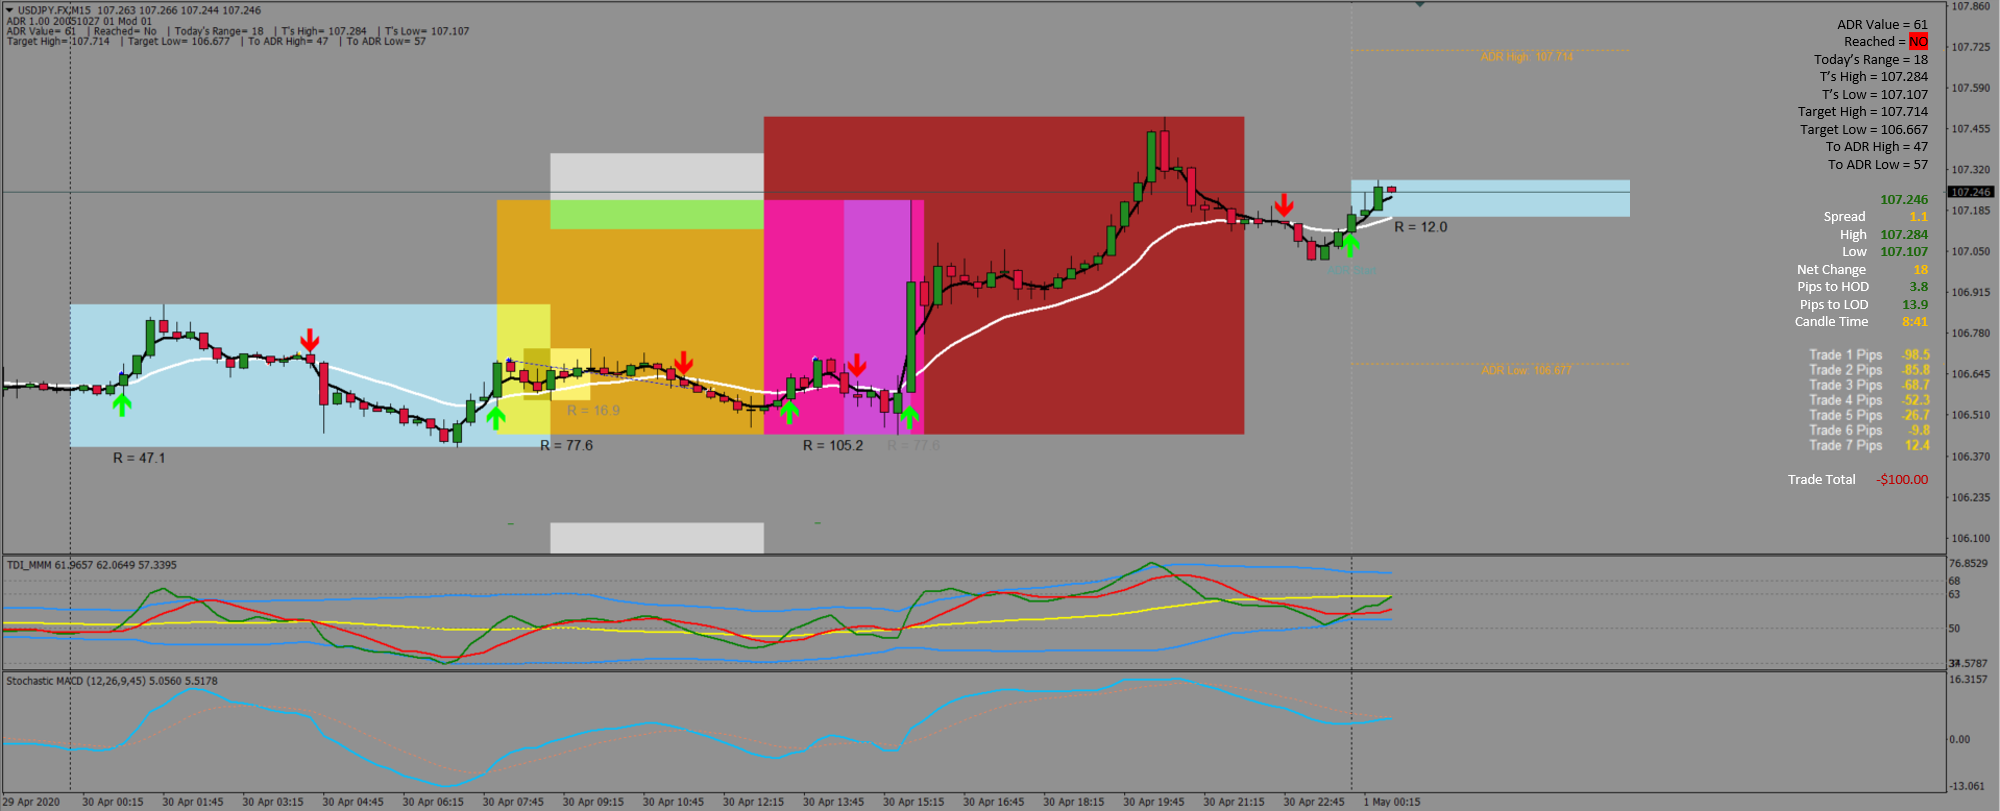
Looking to merge capabilities from a few indicators (stats, ADR, Crossover, ex4 files attached) into single indicator with alerts, arrows upon candle close, and EA buy/sell signal buffer.
Exclusive rights with MQL4 codebase required.
Overall simple breakdown of the sequence of events for a buy position example (opposite for a sell position):
- ADR is exceeded because the price goes below the ADR Low (open candle)
- The ADR lines on the chart changes from dotted to solid as being (reached for the day)
- Fast MA crosses over from under to above the Slow MA
- Crossover BUY arrow is painted on chart at the end of the current candle closure
- Trigger is met and the indicator sends BUY_ORDER to EA
- EA manages trade
Inputs:
- ADR Section
- ADR Start Time - Time to reset the Averaging each day (Default=00:00)
- ADR Days Prior - Number of days in past used to calculate ADR (Default = 15)
- ADR Back Paint - How many days to paint to the chart (Example, if the user selects 50 days in the past to paint, the ADR would be calculated from the ADR Days Prior input and show up as horizontal lines (dotted or solid - if the ADR was reached on that day or not) and the calculations on the )
- ADR Color (Default = Red)
- ADR Line thickness (Default = 2)
- Moving Average Section
- Fast Moving Average (Default = 5)
- Fast Moving Average Type (Options: Simple/Exponential/Smoothed, Default = Simple)
- Slow Moving Average (Default = 15)
- Slow Moving Average Type (Options: Simple/Exponential/Smoothed, Default = Simple)
- Trading Options Sections
- Maximum Spread (Default = 1.5) Will only trigger the order if the spread is at or below the desired amount.
- Trading Start Time (Default = 00:00) Trading signals will only be initiated during the specified times. If the triggers are met outside of the specified time window, symbols will not paint to screen and trade signal buffer will not be sent to the EA
- Trading End Time (Default = 23:59) Trading signals will only be initiated during the specified times. If the triggers are met outside of the specified time window, symbols will not paint to screen and trade signal buffer will not be sent to the EA
- Enforce ADR? - True/False to make it so the buy/sell trigger sent to the EA for action does not happen unless the ADR is exceeded for the day (Default = True). False would essentially turn this indicator into a moving average buy/sell trigger if that is desired.
- Enforce ADR/Moving Average Direction? - True/False to make it enforce if the ADR direction logic (Default = True). This will make it so that if the ADR low of the day is exceeded, it will only pass along a buy order for that day IF and ONLY IF the Fast Moving Average crossover goes above the Slow Moving Average (vice versa for the sell order at the high of the day).
- ADR Percentage (Default = 100%) This refers to if the user wants to allow trades to initiate if the price comes within X percentage of the high/low of the ADR
- ADR Trigger Only - (Default = False) This will allow a buy/sell order to take place if the price comes within the "ADR Percentage". For example, price goes below the low of the day (or ADR Percentage),
Visuals on the chart similar to the screenshot:
- Average Daily Range is hit or close (within user defined % or pip count) - Email/sms sent (Main settings from ADR.ex4)
- Range of days to count into average
- Time Start (hours and minutes to account for different brokers)
- Manual ADR Value Pips (if the calculated ADR is not desired)
- Line style/thickness/color 1 (prior to limit reached)
- Line style/thickness/color 2 (post limit reached)
- From right side of chart, how far down from top offset setting (Similar to stats.ex4)
- Display ADR Value
- Reached? Calculated from current start of day to the ADR high/low
- Today's Range
- Count of pips to ADR High and Low
- Text size
- Number of days to back paint to keep the values as time goes on
- Chart Stats
- Pips high/low of the day is hit (Main settings from stats.ex4)
- Current price
- Spread
- High of day
- Low of day
- Net Change (current range)
- Pips to HOD
- Pips to LOD
- Candle Time to Close
- Trade pip count per trade
- Trade Total (actual dollars profit/loss for the chart)
- From right side of chart, how far down from top offset setting (similar to stats.ex4)
Alerts
- Buy/Sell Signal Buffer for EA
- If possible, need to be able to calculate everything in the Strategy Tester to tweak settings
Responded
1
Rating
Projects
320
35%
Arbitration
64
13%
/
56%
Overdue
83
26%
Free
2
Rating
Projects
3075
66%
Arbitration
77
48%
/
14%
Overdue
340
11%
Free
3
Rating
Projects
121
43%
Arbitration
12
33%
/
50%
Overdue
17
14%
Free
4
Rating
Projects
537
75%
Arbitration
9
44%
/
0%
Overdue
24
4%
Free
5
Rating
Projects
3461
88%
Arbitration
73
40%
/
15%
Overdue
265
8%
Free
6
Rating
Projects
334
55%
Arbitration
14
36%
/
29%
Overdue
1
0%
Free
7
Rating
Projects
2
0%
Arbitration
7
0%
/
86%
Overdue
0
Free
8
Rating
Projects
143
34%
Arbitration
10
10%
/
60%
Overdue
26
18%
Free
Similar orders
Project Description : I need an experienced programmer to convert the TradingView indicator "TTD Middle Right Normal" into a MetaTrader 5 (MT5) format. The indicator should function identically to the original and be fully compatible for integration into an Expert Advisor (EA) on MT5. Requirements : Convert "TTD Middle Right Normal" from TradingView to a .mq5 file for MT5. Ensure all indicator features and visual
I want to create an indi to push notification when the candlestick chart forms 3 peaks or 3 bottoms forming a straight line: - 1,2,3 are 3 points in a straight line or NEARLY straight For example: Straight: NEARLY straight : means the peak/bottom of candle number 3 is NEAR the straight line connecting 1 and 2. Candle number 3 may or may not have crossed the straight line, as long as the peak/bottom of candle number 3
Hello! I am looking for an experienced Pine Script coder to create a custom indicator for mapping market structure based on fractals. The developer needs to know a lot about coding market structure indicators and be proficient in Pine Script. excited to collaborate with a gifted developer
I have list of free indicators in tradingview and i would like to convert them into an mt4 ea, But the EA will have and work based on the indicators features The list of the are listed as follows :> 1. Market Structure Break And Order block. By EmreKb 2. Rainbow Adaptive RSI by LuxAlgo 3. Multiple MA (21,50,100) 4. SuperTrend My budget for this 80$ max
Code mt4 ea with tradingview indicators sript
50 - 60 USD
I have list of free indicators in tradingview and i would like to convert them into an mt4 ea, But the EA will have and work based on the indicators features The list of the are listed as follows :> 1. Market Structure Break And Order block. By EmreKb 2. Rainbow Adaptive RSI by LuxAlgo 3. Multiple MA (21,50,100) 4. SuperTrend Please don't apply if can't do this, So we won't ourselves time
Source code for indicator
30+ USD
good day i have an indicator but need the source for this reason The indicator only work on a single Time frame open trade, and close with only a single TF i will like the indicator work on multiple time frame just like other installed indicator My coder said the reason it cannot work like other indicator installed is because it has no buffer First confirm if you have the source code because its a popular indicator
Hello! I am looking for an experienced Pine Script coder to create a custom indicator for mapping market structure based on fractals. The developer must be skilled in Pine Script and have a solid understanding of how to code market structure indicators. Looking forward to working with a talented developer
Hello developers, I would like to hire someone can convert the Radar Signal indicator: https://www.youtube.com/watch?v=5DmKcy7rb-U  ; to it's TradingView equivalent. Radar signal indicator is the combination of 7 classic MT4 indicators. They include ADX, RSI , CCI , OsMA, ATR, WPR. The indicator shows the values of these indicators in blue and red. Red color indicates a bearish market condition and the blue shows
Hi , i want a indicator that shows the trades history on the chart, just for current day, like : first trade : -54 Second trade : -52 Third trade : +126 , and after three trades, display "No more trades"
AngelShark system
30+ USD
Hello i need someone who can convert a trading view indicator into an mt5 indicator that can work smoothly also need to add an alert on the indicator i will require to test the indicator run it for 1-2days to confirm all is okay thank you
Project information
Budget
50 - 200 USD
For the developer
45
- 180
USD
Deadline
from 1 to 7 day(s)