Watch how to order a trading robot
Read the Rules before you post an order or execute it
How to Order a Trading Robot in MQL5 and MQL4
See a sample Requirements Specification to order a robot
New orders in the category:
30 - 45 USD
Specification
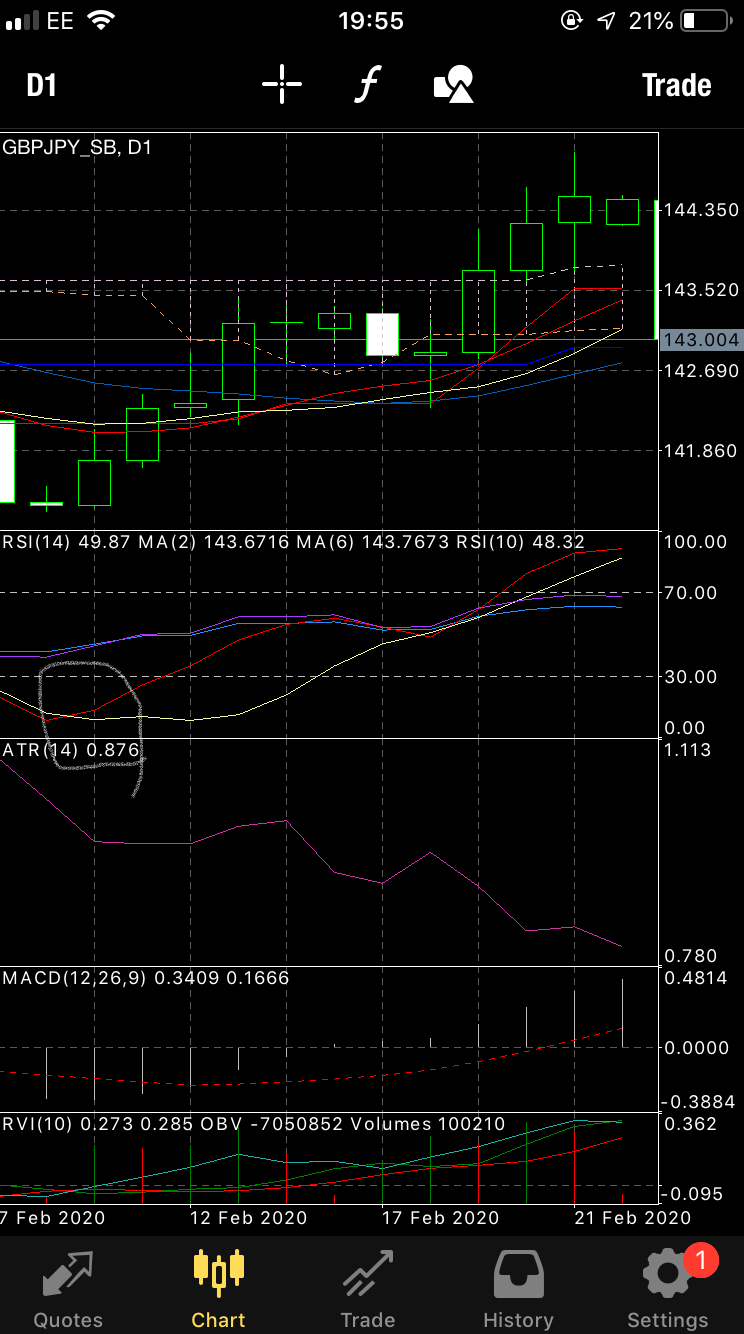
Hello, i have an indicator on MT4 called RSIOMA, which i would like modified.
As it stands the indicator has a buy and sell trigger at 30 and 70.
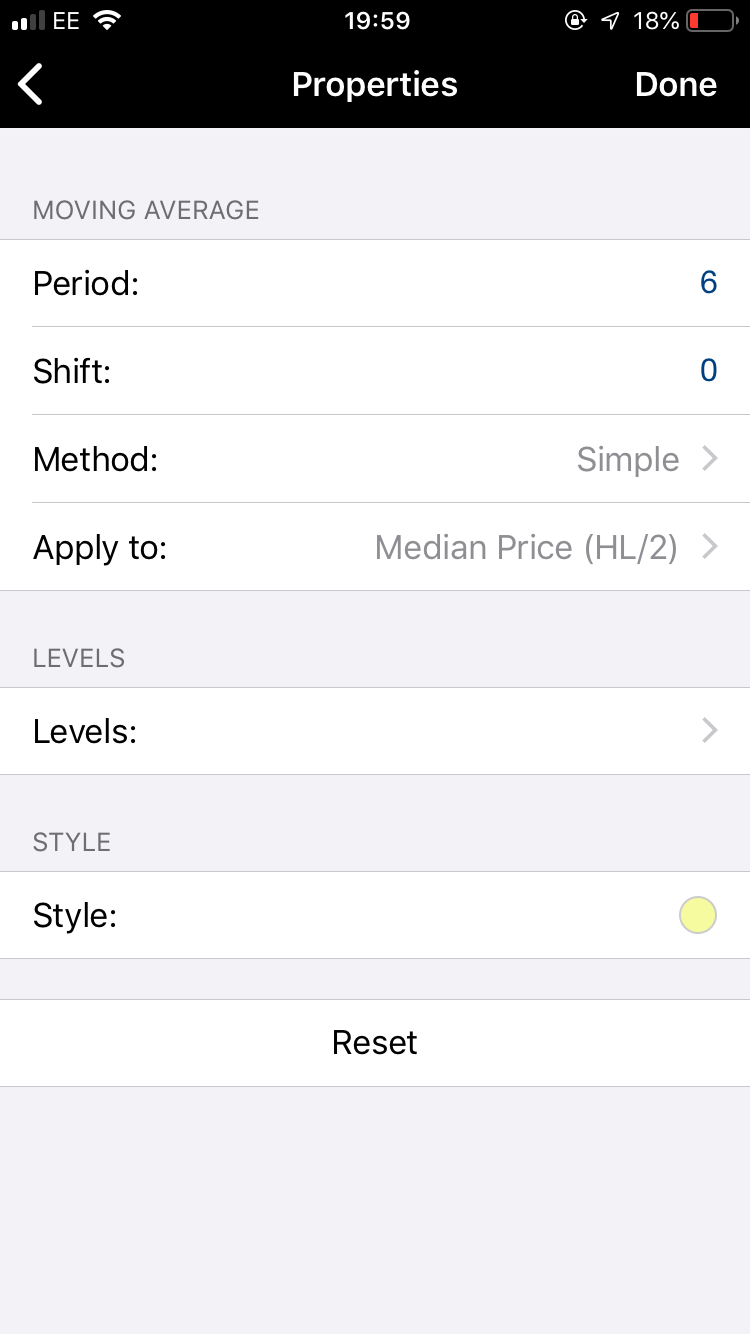
I would to change the sell trigger to sell above 70 when RSI (redline) crosses down the Moving average MEDIAN 2.
and a buy for when bellow 30 RSI RSI (redline) crosses up the Moving average MEDIAN 2.
Responded
1
Rating
Projects
1393
67%
Arbitration
117
32%
/
42%
Overdue
215
15%
Working
2
Rating
Projects
1457
46%
Arbitration
49
73%
/
12%
Overdue
36
2%
Free
3
Rating
Projects
463
51%
Arbitration
41
24%
/
49%
Overdue
149
32%
Free
4
Rating
Projects
4
25%
Arbitration
4
0%
/
100%
Overdue
0
Free
5
Rating
Projects
167
35%
Arbitration
11
91%
/
0%
Overdue
0
Free
6
Rating
Projects
562
33%
Arbitration
24
67%
/
8%
Overdue
17
3%
Free
7
Rating
Projects
1436
62%
Arbitration
21
57%
/
10%
Overdue
43
3%
Free
8
Rating
Projects
143
39%
Arbitration
21
19%
/
48%
Overdue
30
21%
Free
9
Rating
Projects
1048
49%
Arbitration
39
28%
/
41%
Overdue
49
5%
Free
10
Rating
Projects
334
55%
Arbitration
14
36%
/
29%
Overdue
1
0%
Free
11
Rating
Projects
143
34%
Arbitration
10
10%
/
60%
Overdue
26
18%
Free
Similar orders
Looking for a developer to help build an MT5 EA
100 - 200 USD
I need to make EA (Expert Advisor) and would appreciate it if you could provide your most competitive quote. Please let me know your best price for completing these changes, as I’m looking to get this done promptly and effectively. Thank you
Convert mt4 indicator to EA for tradelocker
60 - 75 USD
I need a programmer for converting a MetaTrader indicator into ea for TradeLocker. Additionally, I would like to have a new EA built in TradeLocker that mirrors the logic of the original MetaTrader, including the specific rules and conditions I need. Please contact me only if you have prior experience converting scripts from MetaTrader to TradeLocker
I HAVE A SQ EA AND IT NEEDS TO RUN WITH 3 SETS WITH DIFFERENT TIME CONFIGURATION. Basically the trade logic will read different input values for the same parameter with the same and/or different timeframes and manage trades accordingly and individually. If it is a trouble, timeframe can be ignored and we can continue only with the parametrization
[MT4] simple Hedge EA with some handy functions
30 - 50 USD
I need to make several modifications to an EA (Expert Advisor) and would appreciate it if you could provide your most competitive quote for these edits. Please let me know your best price for completing these changes, as I’m looking to get this done promptly and effectively. Thank you
Revolving grid EA - filter
30+ USD
hello here am looking for someone that can assist me in removing validation form my demo file and if anyone is interested dm the for more details i will be waiting to get any reply by some on that can assist me with this
I want a combined Standard deviation channel and Fibonacci channel indicators into just one indicator. The standard deviation channel lines would have same characteristics as the Fibonacci lines in terms of format (adjustable width, colors, type, size etc.). I want unique buffer values for all the lines (for both the 3 upper and 3 lower STD.DEV lines and the same for the Fibonacci channel lines) which would be
Goodtrade Expert Advisor
30+ USD
A green point should be added at the Low point of candlesticks in the oversold zone—it is the L point. If there is at least one L point between two H points, search for a LL point in the interval between two H points. The candlestick with the lowest Low price will be the LL point. Generally, the LL point is not necessarily an L point. Search for candlesticks with the lowest Low price. If there is at least one H point
Trading robots are programs, which operate according to underlying algorithms. An algorithm is a set of actions that need to be performed in response to certain events. For example, the most common task in algo trading is the identification of the "New bar" event. When the event occurs, the robot checks the emergence of trading signals and acts accordingly. Before you decide to program or order a trading robot, you
RRB
50 - 400 USD
The overbought zone is determined as candlesticks, at which the indicator value Value > Lmax (Lmax=-20). The oversold zone is determined as candlesticks, at which the indicator value Value < Lmin (Lmin=-80). The values of Lmax and Lmin should be included in indicator parameters. A yellow point should be added at the High point of candlesticks in the overbought zone—it is the H point. A green point should be added at
At bot
30+ USD
Help me to trade create orders for me and analyze the markets and decide when is a good time to buy or sell. Determine which pairs are best to use to trade with and indicate trading signals to me
Project information
Budget
30 - 35 USD
For the developer
27
- 31.5
USD