Watch how to order a trading robot
Read the Rules before you post an order or execute it
How to Order a Trading Robot in MQL5 and MQL4
See a sample Requirements Specification to order a robot
New orders in the category:
30+ USD
30+ USD
Job finished
Execution time 5 days
Feedback from employee
I hope to work with him again.
Specification
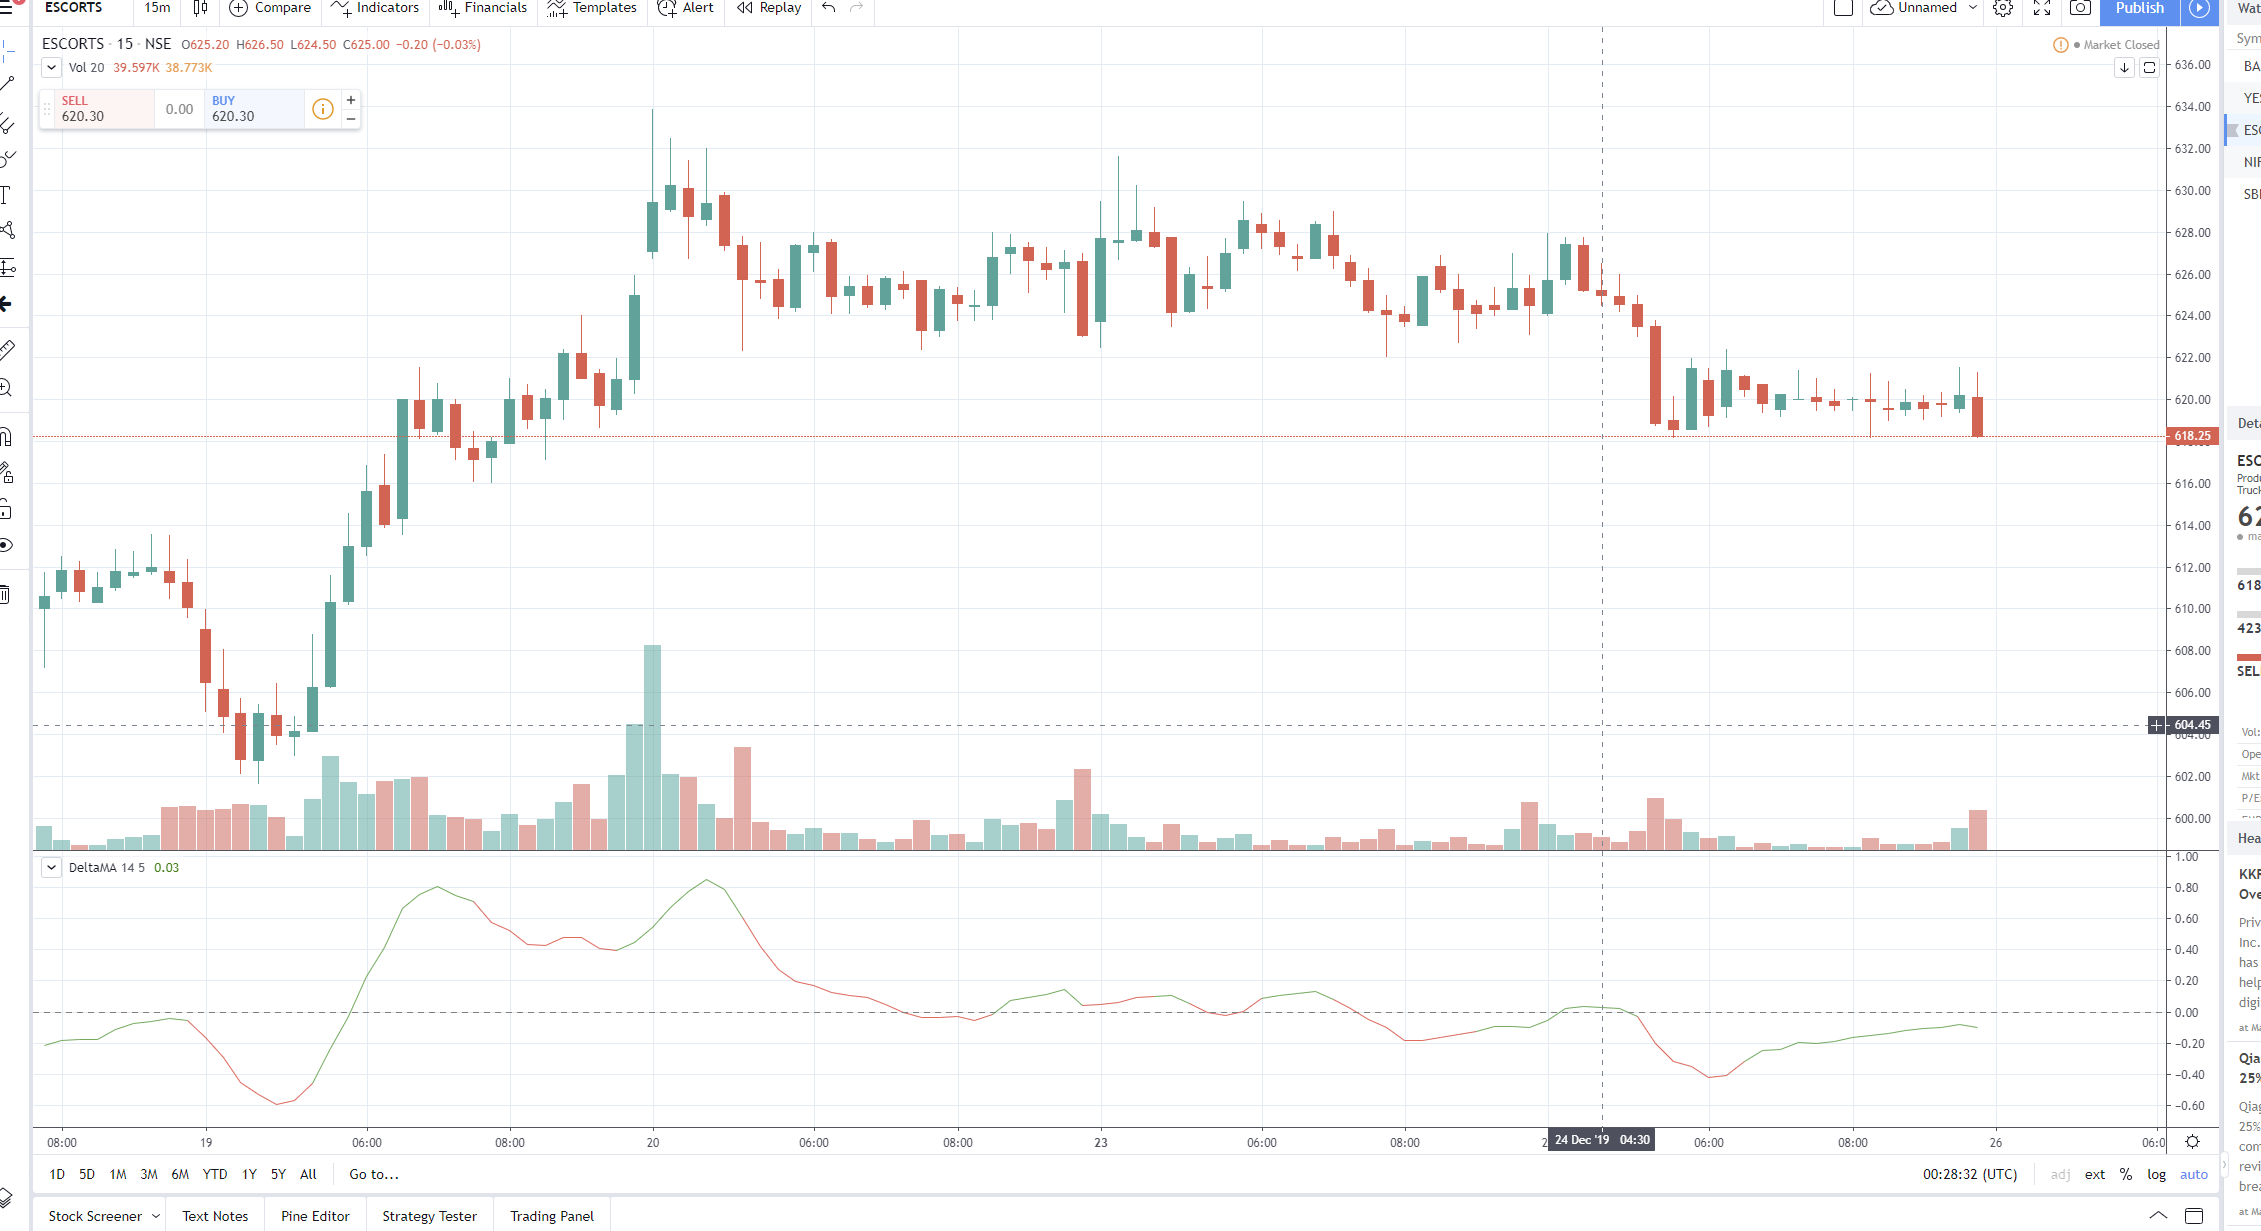
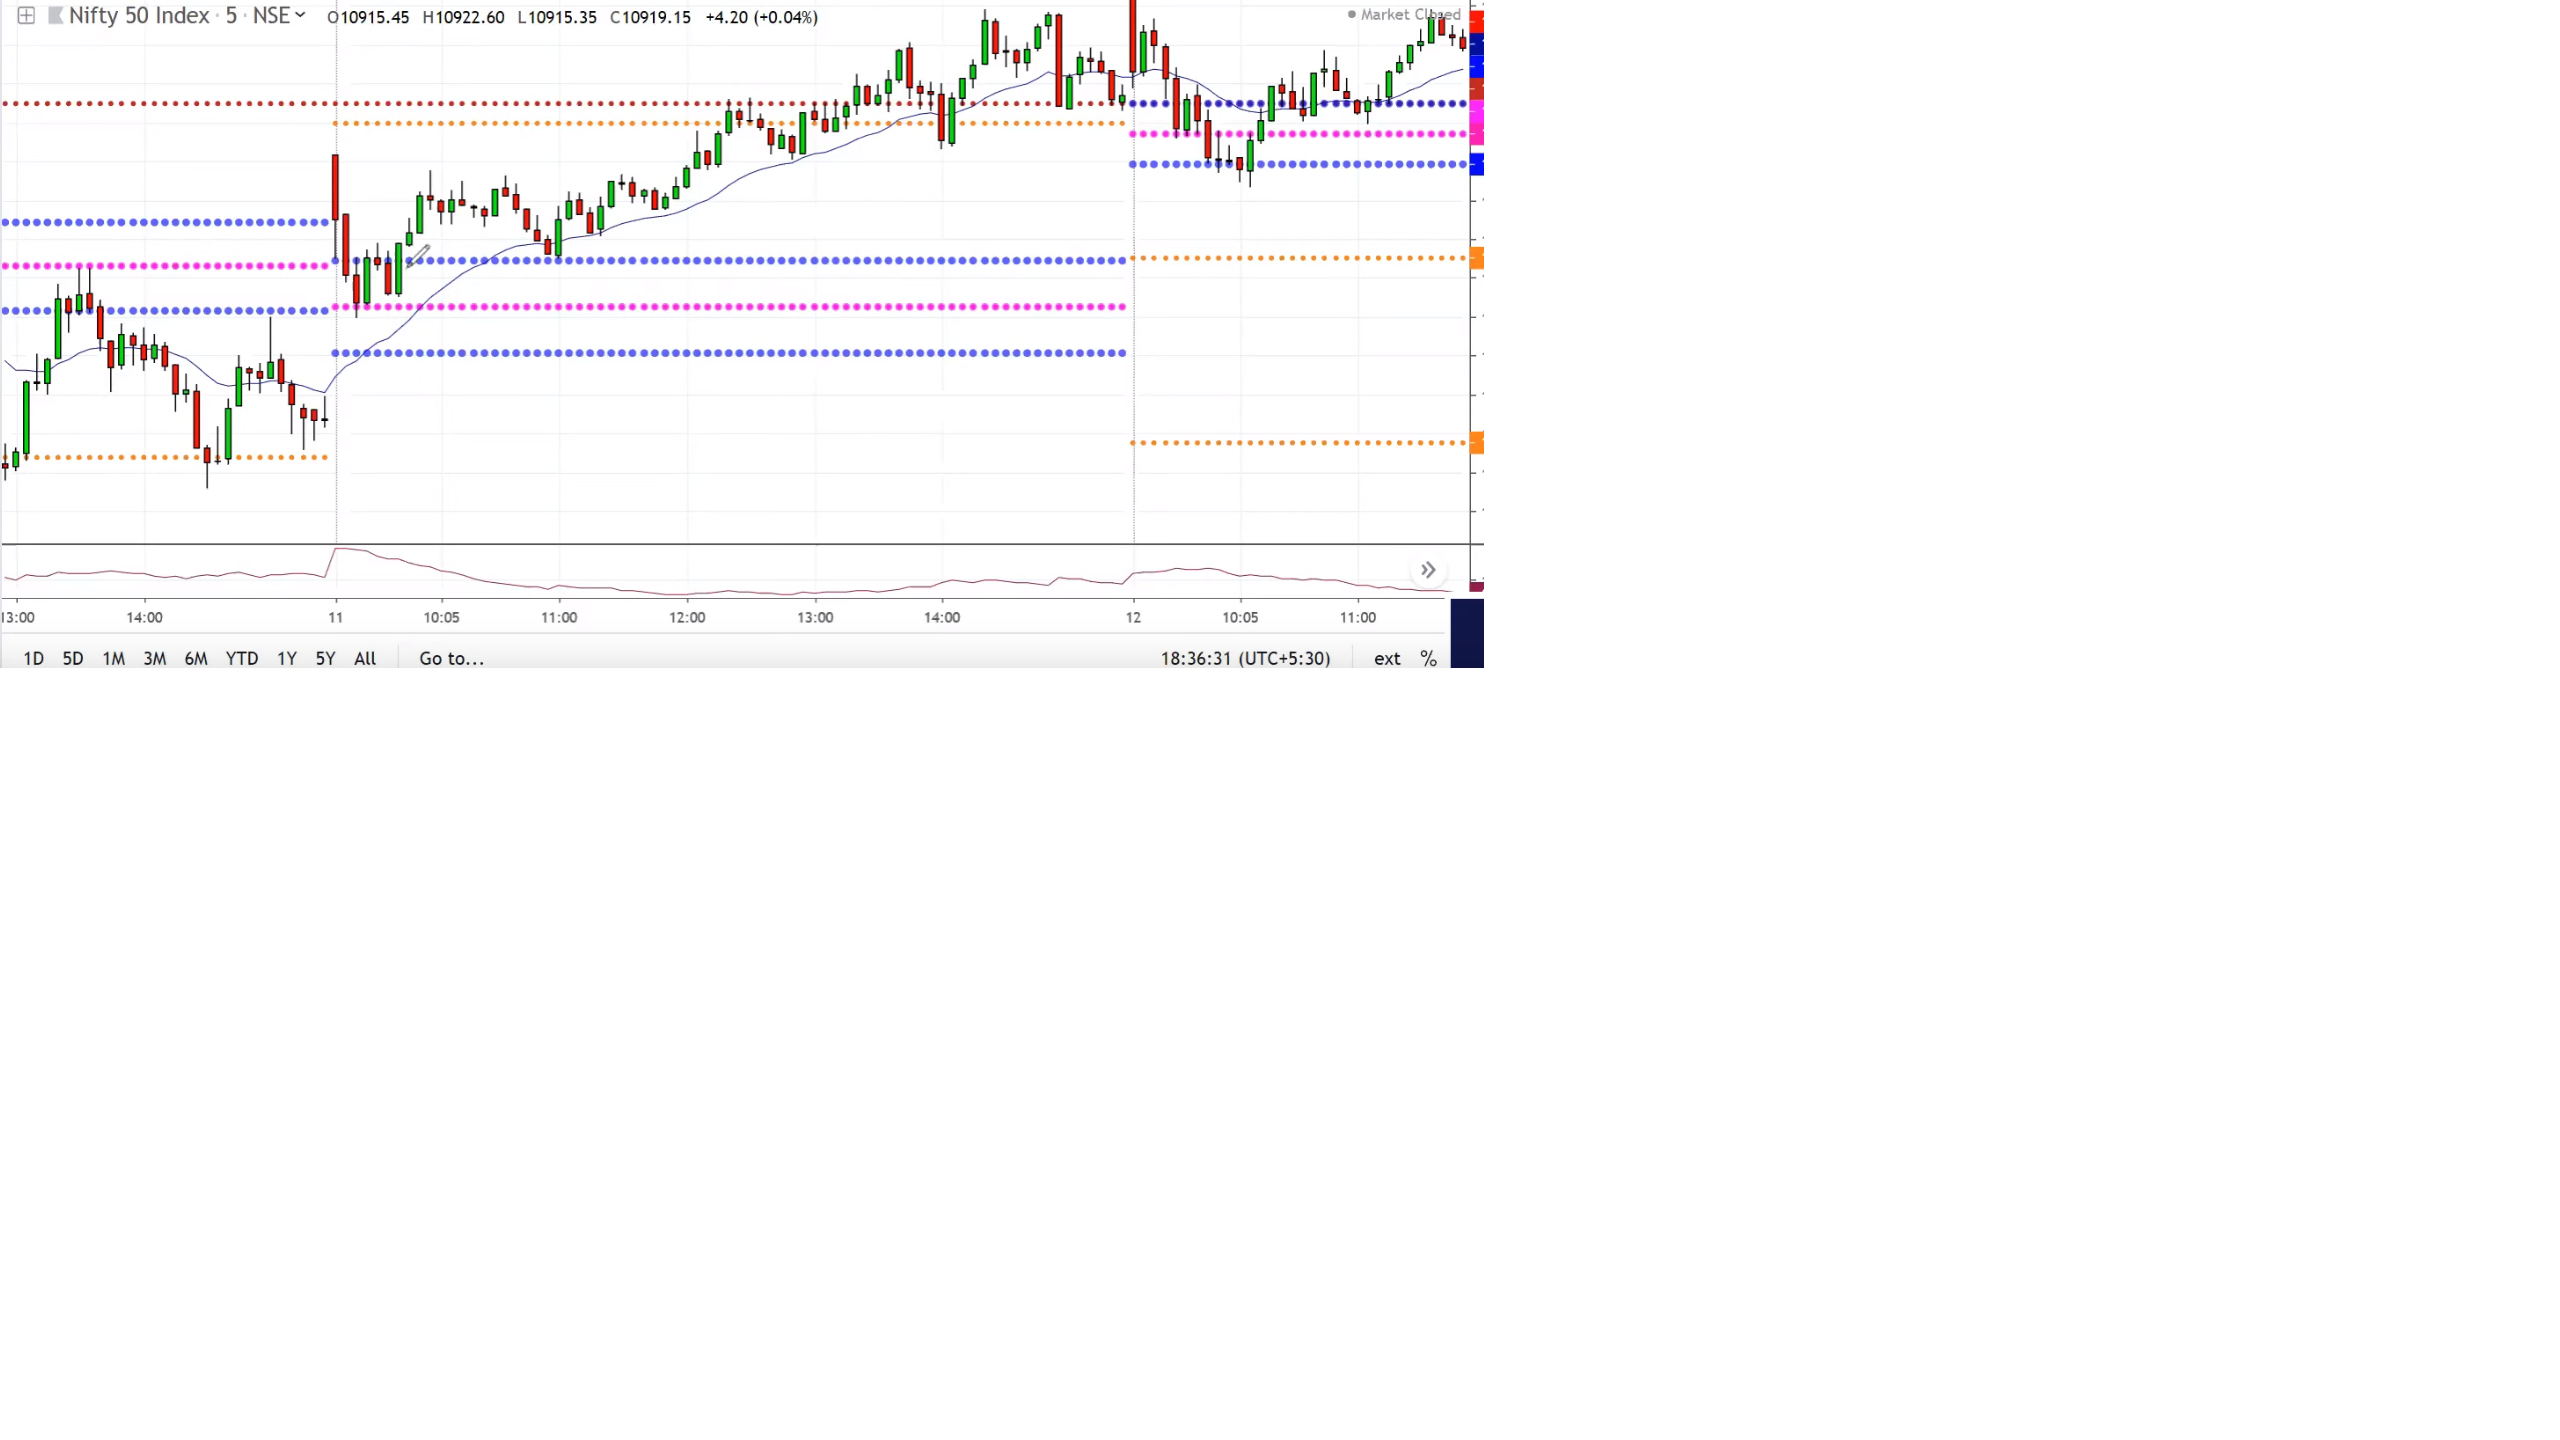
I need an indicator system named "Pivot XR Delta system" modified based on pivot points which should be displayed on the price chart
and modified EMA called Delta Moving Average which should be displayed on a separate adjustable window below the price chart window.
I will require the source code of the sysytem too.
The formulas for the modified pivot lines are as follows-
Daily Pivot Point- (previous day High + previous day Low +previous day Close)/ 3
It should be displayed on the price chart for the last five trading days on all time frames except daily, weekly and monthly
It should have the option of Display on chart- True/False. It should be modifiable in terms of colour, thickness, types of lines.
Weekly Pivot Point - (previous weekly High + previous weekly Low +previous weekly Close)/ 3
It should be displayed on the price chart for the last five trading days on all time frames except weekly and monthly
It should have the option of Display on chart- True/False. It should be modifiable in terms of colour, thickness, types of lines.
Monthly Pivot Point- (previous monthly High + previous monthly Low +previous monthly Close)/ 3
It should be displayed on the price chart for the last five trading days on all time frames except monthly
It should have the option of Display on chart- True/False. It should be modifiable in terms of colour, thickness, types of lines.
XR - (previous day High +previous day Low)/2
It should be displayed on the price chart for the last five trading days on all time frames except daily, weekly and monthly
It should have the option of Display on chart- True/False. It should be modifiable in terms of colour, thickness, types of
lines.
CXR- (((previous day High + previous day Low +previous day Close)/ 3)-((previous day High +previous day Low)/2 )) + ((previous day High +
previous day Low +previous day Close)/ 3) which means (Daily pivot point - XR) + Daily pivot point
It should be displayed on the price chart for the last five trading days on all time frames except daily, weekly and monthly
It should have the option of Display on chart- True/False. It should be modifiable in terms of colour, thickness, types of lines.
The formula for the Delta Moving Average as per Tradingview.com coding language (Apology as I don't have any other coding language
available for this indicator) is-
study(title="Delta Moving Average", shorttitle="DeltaMA")
ema_len = input(14, minval=1, title="EMA len")
roc_len = input(5, minval=1, title="ROC len")
src = close
smooth = ema(src, ema_len)
ema_roc = 100 * (smooth - smooth[roc_len])/smooth[roc_len]
color = ema_roc > ema_roc[roc_len] ? green : red
plot(ema_roc, color=color, title="EMA ROC", style=line)
hline(0)
The Delta Moving average should have the above said values by default and also should be able to modify the values of EMA and ROC whenever
required and should be displayed on a separate ajustable height window below the price chart window. It should be modifiable in
terms of colour, thickness, types of lines.
All the above indicators including the modifiable pivots and Delta moving average should be modifiable in terms of colour, thickness,
types of lines like full line, dotted line,broken lines etc. I should be able to add other indicators/indicator windows on the
charts.
Please find attached sample images for both, modified pivots and Delta Moving Average for references.
Responded
1
Rating
Projects
285
41%
Arbitration
15
13%
/
47%
Overdue
67
24%
Free
2
Rating
Projects
209
86%
Arbitration
2
0%
/
50%
Overdue
8
4%
Free
3
Rating
Projects
711
33%
Arbitration
45
49%
/
42%
Overdue
14
2%
Working
4
Rating
Projects
334
55%
Arbitration
14
36%
/
29%
Overdue
1
0%
Free
5
Rating
Projects
86
57%
Arbitration
25
0%
/
84%
Overdue
19
22%
Free
Similar orders
TumiiFX
30 - 20000 USD
1. Use two EMAs: 20 and 50. If EMA 20 is above EMA 50 → uptrend (look for buys) If EMA 20 is below EMA 50 → downtrend (look for sells) 2. Wait for a pullback into the area between the two EMAs. - For buys: price must touch or move between EMA 20 and EMA 50 during the last few candles. - For stils: same idea, but in a downtrend. 3. Entry signal: Buy: a bullish engulfing candle in an uptrend after the pullback
I Need HFT bot working on MT4
30 - 100 USD
I am looking for an experienced MQL4 developer to build a professional High-Frequency Trading (HFT) / Low-Latency Expert Advisor for MetaTrader 4 (MT4) . The EA will be deployed on an IC Markets Live account and should be optimized for the fastest possible execution using a low-latency VPS located in LD4 or NY4 . The primary instruments will be US30 and XAUUSD (Gold) . The goal is to create an EA capable of
A robot
50+ USD
HIGH-FREQUENCY M5/M15 CONCURRENT ENTRY SNIPER import time class HighFrequencySniper: def __init__(self): self.target_profit = 25.00 # Targeted Delta Move self.max_execution_time = 3600 # 1 Hour Sandbox (Seconds) self.lot_allocation = "CALIBRATED_TO_RISK" def execute_hft_scan(self, current_price, m5_rsi, m15_order_block): print(f"[SCANNING] Current Kernel Metric: ${current_price:.2f
I need a trading bot, please i need this project urgently and when messaing me kindly send me samples of past works and dont forget i need the project to be done as soon as possible
A lightweight MT5 chart overlay displaying total floating P&L, average entry price, combined lot size, and current symbol exposure as a percentage of account balance, all updating in real time with color-coded profit/loss indicators, delivered with clean object-oriented source code and no DLL dependencies
ENTRY EXIT TIMING (ET BANDS)
30 - 50 USD
QUIERO CONSEGUIR EL CODIGO FUENTE DE ESTE INDICADOR QUE ME GUSTA MUCHO TAMBIEN TIENE EL NOMBRE DE ET BANDS O ENTRY EXIT TIMING . no se los componentes pero estas son las imagenes. que mejor lo describen
I am looking to convert my existing TradingView Pine Script (v5) strategy into an MQL5 Expert Advisor (EA) for MetaTrader 5. Strategy Details: Asset: Gold (XAUUSD) Timeframe: 15-minute Strategy Logic: The strategy is based on a breakout concept. Anchor Candle: The base calculation starts from the Specified Candle Entry Window: The EA should only look for entries As Per Indicator Risk Management: The strategy
Writing of an Expert Advisor
30 - 200 USD
I want to find a Developer to perform this work and settle payments in this Application. I undertake not to communicate with Applicants anywhere else except this Application, including third-party messengers, personal correspondence or emails. I understand that violators will be banned from publishing Orders in the Freelance
Akram boushaba
30 - 500 USD
مرحبا كيف حالكم انا اكرم مهتم بالتداول احاول ان اصمم برنامج روبوت قادر على التداول من تلقاء نفسه من يمكنه ان يساعدني او يعلمني كيف استطيع فهل ذلك وسأكون ممتناً له وشكرا لكم
MetaTrader In-App Trade Alerts An existing MetaTrader terminal is already running on my side, but its account is kept hidden for privacy reasons. I need a specialist to wire up native in-app notifications so that every time a position is opened or later closed I see an immediate pop-up inside the platform—no emails or SMS, just the built-in alert window (and the usual MT push to mobile if that comes automatically
Project information
Budget
30+ USD