Expert Advisor for Pattern Recognition

MQL4 Experts

Specification

 Double Top Bottom Line Trader EA System


·         Have these inputs:

1.       Take profit pending order                                                           ____________ Pips or Price of the Pair or US $ profit

2.       Stop loss pending order                                                              ____________ Pips or Price of the Pair or US $ loss

3.       Lot increments of all 3 sizes (standard, mini, micro)                   ____________ % Equity and US $ Equivalent (Example 2% of account = 1.11 lots)       

4.       SL move to B/E based on pattern range                                      ____________ Pips or Price of the Pair or US $ Amount

5.       List of Currencies to scan                                                          ____________ Up to 50

6.       Indicator stating price/pip                                                        ____________ 

7.       Swap rate indicator showing % interest payable if long or short

8.       The capability to trade 6 or more currency pairs in any combination of long only, short only or both long and short

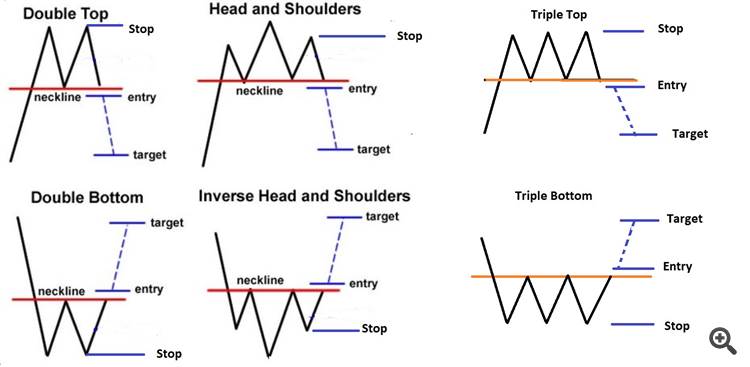
9.       The capability to trade Double top, Triple Top, Head and Shoulders, Double Bottom, Triple Bottom, Inverse Head and Shoulders 

10.   Time exit ______________________adjustable and on/off

11.  Elect to trade during the news using signals from my provider _____________________Red News Yes / No Yellow News Yes / No Orange News Yes / No

12. Adjustable time intervals include 15 min, 30 min, 1 hour, 2 hour, 4 hour, Daily, Weekly


·         Scan the chosen Currencies and Detect Double Tops, Double Bottoms, Triple Tops, Triple Bottoms, Head and Shoulders, and Inverse Head and Shoulders

·         In the event of a Double top, Triple Top, or Head and Shoulders:

A)      Allow for a Line to be drawn at the neckline of the formation (Please see the picture explanation below)

B)      Perform a measurement of the most recent Top High (From Candle Body-not wick) to the neckline which will be considered the distance to the Target and Stop loss.

C)      Set the Stop loss and Take Profit using the distance measured between the neckline and the most recent top (candle body) as described above.

D)      Set a Pending Sell Order at the neckline using a lot size of 2% of Equity (changeable) and the total open trades not exceeding 50% of the total account size.

E)      Perform a Sell Entry when a candle body closes below the neckline of the formation.

F)       Find the time that it took for the move to occur that caused the trade to take place (Double Top, Triple Top, etc.) and set an exit point for the trade at 1/3 of the time it took for the move to occur (adjustable , or on/off)

G)     Move the Stop Loss to Break Even (plus spread) once price closes below the 62% Fibonacci retracement level of the Neckline and Take Profit Target.

H)     Allow for the trade to Continue until the Stop Loss or Take Profit is achieved.

·         In the event of a Double Bottom, Triple Bottom, or Inverse Head and Shoulders:

A)      Allow for a line to be drawn at the neckline of the formation (Please see the picture explanation below)

B)      Perform a measurement of the most recent Bottom Low (From Candle Body- not wick) to the neckline which will be considered the distance to the Target and Stop Loss.

C)      Set the Stop loss and Take Profit using the distance measured between the neckline and the most recent Bottom (candle body).

D)      Set a Pending Buy Order at the neckline using a lot size of 2% of Equity and the total open trades not exceeding 50% of the total account size.

E)      Perform a Buy Entry when a candle body closes Above the neckline of the Double Bottom.

F)       Find the time that it took for the move to occur that caused the trade to take place (Double Top, Triple Top, etc.) and set an exit point for the trade at 1/3 of the time it took for the move to occur (adjustable, or on/off)

G)     Move the Stop Loss to Break Even (plus spread) once price closes above the 62% Fibonacci retracement level of the Neckline and Take Profit Target.  

H)     Allow for the trade to Continue until the Stop Loss or Take Profit is achieved.


* Please feel free to make suggestions for anything that you believe will give better back and forward testing results, therefore, creating a more successful expert.

* This is my second attempt to have a successful expert advisor created.  My goal is to have an expert created that truly works well and gives results close to "autochartist.com" (which tracks the patterns success).

  The "autochartist.com" pattern success rates are as follows:

Double Top                              = 77%

Double Bottom                        = 83%

Head and Shoulders                 = 85%

Inverse Head and Shoulders     = 83%

Triple Top                               = 100% (infrequent occurrence)

Triple Bottom                         = Impress me  :)   ( very rare occurrence)


* The payment for the development of this Expert is negotiable to all developers. Please indicate your required payment.

* Payment will be transferred after a successful program is developed with similar results as described above.

*  I already have a Double Top/Bottom expert that works but does not give the desired results.  The Expert Advisor for that attempt is available upon request. 

*  Please bid if you are confident that you can achieve the above results. 


Thanks so much for your time!

Price Patterns


Responded

1
Developer 1
Rating
(49)
Projects
134
27%
Arbitration
62
13% / 53%
Overdue
58
43%
Free
2
Developer 2
Rating
Projects
0
0%
Arbitration
0
Overdue
0
Free
Similar orders
MT4 EA 30+ USD
I have project for expert developer here.. The task is to make the EA take trades using the indicator upper line and the lower line to take trades. When the upper line appears on the chart I need the EA to take a sell at that point. Then when the lower line shows up I need the seel trade to close. The same concept applies for the lower line. I need the EA to take a buy trade when the lower line appears and close when
News field 30+ USD
I am in need of a custom EA news filter for my trading platform, and I believe your expertise in this field can greatly assist me. Below are the specifications for the filter: 1. It should be implemented as a boolean function, returning either true or false. 2. The filter must automatically detect currency pairs. 3. Three hours before and after any significant news events pertaining to each currency in the pair, the
Hello, I would like to ask who would perform a backtest + optimization on my existing EA ? The EA works mainly on two pairs. Thank you for your reply. Sincerely Martin
I need someone to create an MA crossover EA. This program should be able to trade the crosses. We would be using the MA indicators to make decisions about buying and selling stocks or other assets. The MA crossover would help me invest my money more effectively by automatically executing trades based on these indicators. If you can create this program, please let me know as I am interested in working with you
the idea of the bot is to trade based on trend. we are going to use 5 different sma( smoothed moving average). they are sma7,sma20, sma50, sma100 and sma200. the bot will look for only buy trades when all the smas are facing up. the bot will look for only sell trades when all the smas are facing down. when we are in a up trend, the bot will look to enter trades on bullish candles that create fvg. if there is an fvg
Topx 80+ USD
1)I need EA with on/off button per currency and buttons to control lots size, auto change of currency with time, Dashboard of 4 indicators (Bollinger, Currency strength, FVG and Gann ) and trade management. Entry: When buy is clicked, the EA draws a line. After x pips market move away from the line or when price moves to given price line and or time, the EA opens buy order if clicked/selected indicators align. Set
I'm looking for an experienced developer to make some modifications to my MT4 Currency Strength Table indicator. Key Requirements: - I would like to have the add on feature of delta or the difference of the strength of currencies displayed in the new table and showing as B or S of only the one currency pair when the delta or difference arises. the delta will change values as the difference of strength of compared
I need Spike DETECTOR EA for Boom and Crash.. which will send me notification or alerts when spike is near. The EA should also be able be buy on crash Index and sell on Boom Index depending on the market..Demo may be provided for faster execution of my order
· I need an MT5 EA that trades on Currencies, Indices, Metals, Crypto, Commodities and Deriv Synthetic Indices. · It should trigger trades on the Moving average cross above or below of the RSI levels in the same window. It should have a Trailing stop and break even input variables. Please note that I only want to use the RSI levels and not its period hence the RSI period will be set to 1. Also the
ODSMART EA 30 USD
I want an EA developed from this strategy that will buy and sell based on the appearance of these colours. Blue-buy (Enter when the signal indicator is at zero on the blue background) Red -sell( Enter when the signal indicator is at 100) White and brown, exit trade

Project information

Budget
30 - 500 USD
For the developer
27 - 450 USD
Deadline
to 15 day(s)