Discussing the article: "Building a Research-Grounded Grid EA in MQL5: Why Most Grid EAs Fail and What Taranto Proved"
I’d like to share my observations.
To achieve maximum stability in the grids (number of bends), I’ve come to the conclusion that the Fibonacci sequence is ideal, i.e. a ratio of 1.6. In this case, the second bend should also be 1.
That is, 1 – 1 – 1.6 and so on.
My second observation concerns retracements. There is almost always a trading range preceding them; the narrower the range, the less retracement there is. I didn’t have the brainpower at the time to work out such a filter algorithmically.
The third thing I tested was taking a profit on one leg during the retracement – that is, partially closing the initial orders – which allows you to control the position size to some extent and hold a larger position at the very end.
Fourthly, the release of major news. There, orders can usually disrupt the Fibonacci structure due to slippage; the solution is to increase the distance between orders (the starting step), which ultimately means profits are accumulated more slowly.
Fifth observation:
1) A great many older signals showed returns of 5–10 per cent per month, or perhaps even less, and were long-term in nature—that is, they could run for 2–5 years. They would accumulate profits of up to 300–500 per cent on the account before a drawdown.
2) A great many older signals, which showed returns of 50–100 per cent per month, were not long-running; they lasted for just a few months. They generated profits of up to 300–500 per cent on the account, followed by a drawdown.
3) If you run a grid with the minimum step size (such Expert Advisors are usually called ‘acceleration’ strategies – essentially the same grid, but with a smaller step), you can reach 300–500 per cent in a couple of days, and then guess what happens next.
The conclusion is simple. A grid is a grid; the algorithm itself has a limit on its profitability. By increasing the starting step size, you reduce profitability; the account lasts much longer, but the outcome is the same, whilst the waiting time varies. I can’t say which is better, but I intuitively understand that a profitable strategy shouldn’t be limited to ‘a steady 10 per cent a month’ (holding shares – yes, but forex – definitely not, if we’re talking about grids). With a non-grid strategy, the maths is, of course, different: if a trade doesn’t exceed a 1 per cent risk, and there are only 10 such trades a month, then even a 5 per cent profit can be a good result.
The following strategy has been described in many places. The aim is to select instruments that rarely enter a one-way trend—something along the lines of the euro-pound pair. To be honest, I’d simply look at the structure: if you see movement in channels or ranges, or in waves without the formation of such ranges, these are two different market phases. I won’t make any recommendations on this matter, but it’s important to know which phase we’re in right now – and sometimes the trick isn’t in choosing the instrument.
The essence of this strategy is to maintain 5–10 accounts running simultaneously with different currency pairs, take profits in good time and top up accounts that have run dry. I had an idea to programme a grid based on a similar algorithm within a single account, but it didn’t quite work out; however, it seemed to work with separate accounts about five years ago.
This is useful.
The 1.6 coefficient with a flat second leg is easy to try. The EA already has a mild lot multiplier, so that is a parameter change rather than new code.
The corridor observation is the one I keep coming back to. My regime filter reads ATR and drift, so it only reacts once the move is underway. Looking at how much room is ahead of price is a different signal and a better one in principle. I just do not have a clean way to measure "narrow" yet.
Partial closes are a real gap. Right now it is the whole basket or nothing. On the signal survey I have no counterargument, that is something to measure rather than argue about.
From the article, we learnt that the University of South Carolina hands out PhDs left, right and centre to anyone and everyone… so if you fancy a title for free, head over there :-)
Because the Martingale is a risk management method (and not just a simple ‘lot × 2’ approach, but one where the market position size depends directly or inversely on the drawdown), whilst a grid system is a method of regular entries. Comparing them is like comparing apples and oranges; they’re completely different things.
From the article, we learnt that the University of South Carolina hands out PhDs left, right and centre to anyone and everyone… so if you fancy a title for free, head over there :-)
Because the Martingale is a risk management method (and not just a simple ‘lot × 2’ approach, but one where the market position size depends directly or inversely on the drawdown), whilst a grid system is a method of regular entries. Comparing them is like comparing apples and oranges; they’re completely different things.
By your wider definition the EA has martingale in it either way. The lot engine has a multiplier mode, and the dynamic sizing shrinks lots as equity falls, which is the inverse case you described.
(Southern Queensland, by the way, not South Carolina. No worries though :D)
There’s a bit of pseudoscience in the article.
I’ve been analysing the tops in Signals with top-ups.
Доливки.
Let’s see how the curve changes depending on the number of permitted top-ups (open positions at any one time), by gradually increasing the CustomReport input parameter mentioned (full history – from 2023).
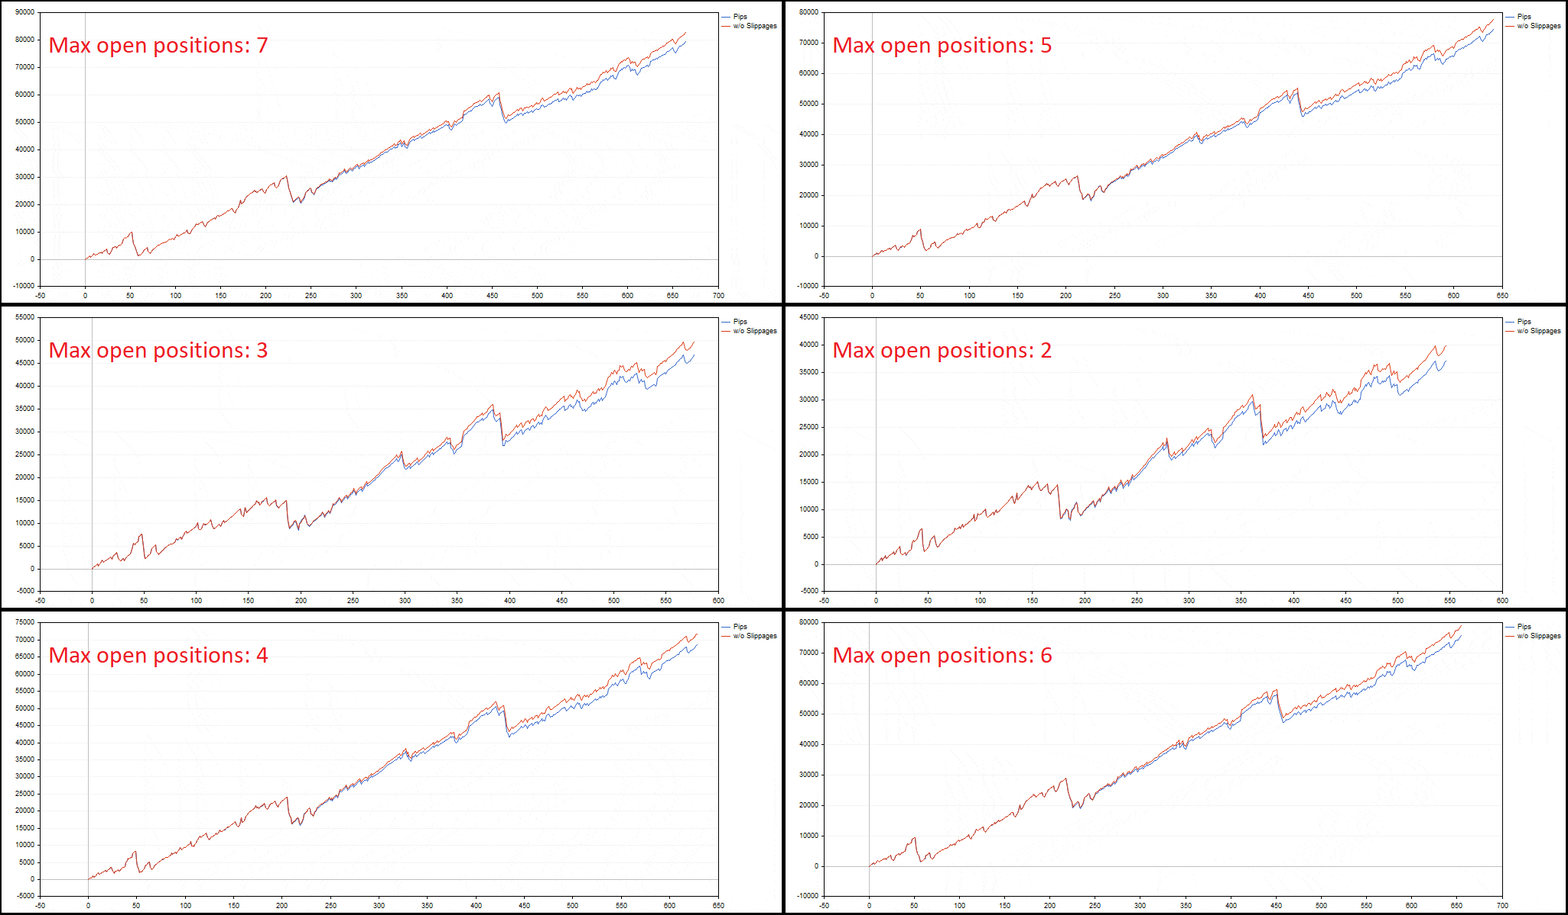
In the historical data, there were up to six top-ups – seven open positions at the same time. It’s very clear how adding top-ups affects the result.
According to the classification, this is a dependent trading logic.
There is a Virtual+Copy mechanism which splits the averaging-in trading system into independent trading systems.
To put it simply, imagine that each top-up has its own MagicNumber: the first position is 1; the first top-up is 2; the next top-up is 3; and so on.
In that case, the trading history with top-ups can be represented as TS1 + TS2 + TS3 + ...
In other words, as a portfolio of independent trading systems without top-ups. So, in that case, simply select only those trading systems from this list that generate a profit.
It is almost certain that TS1 will incur losses. Almost – because there is an example where TS1 does generate a profit.
If you limit yourself to just one position, the latest version will produce this result.
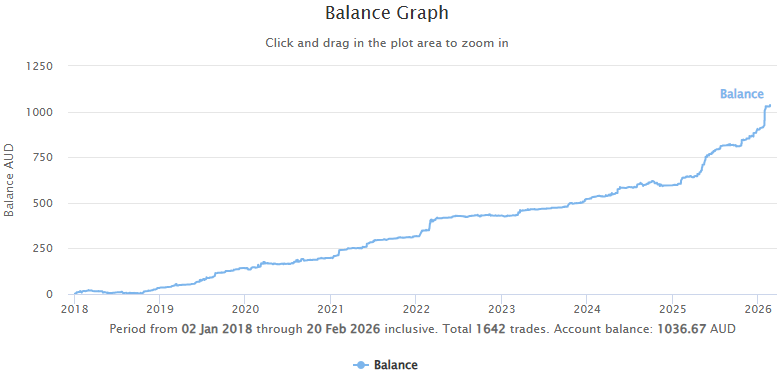
Allowing two or three positions to be open simultaneously makes the upward trend even steeper. The tool is provided so you can see this for yourself.
It turns out that it is possible to abandon the flawed logic of closing a net-positive position with huge risks. And to stick with low risks.
But top-ups are still included, as they generate better sales (a psychological ploy) on the Market.
All in all, it’s a bit of a shame that the article lacks research on the issue raised.
I ran it. XAUUSD M1, 100% real ticks, 2026.02.03 to 2026.03.19, 10,000 deposit, every input at the published value except the grid depth, which I swept from one level to sixteen. To attribute the result I tagged each order with the grid level it was placed at, so every closed position could be traced back to the level that opened it. The per-level sums reconcile with the tester's net profit to 0.1 pip at all ten depths, and an uninstrumented rerun reproduced the same figures, so the attribution is not doing anything to the results.
| Levels | Net (pips) | PF | Max equity DD | Trades | Pips / trade |
|---|---|---|---|---|---|
| 1 | 272 | 1.93 | 4.94% | 13 | 20.9 |
| 2 | 1 115 | 5.36 | 7.26% | 32 | 34.8 |
| 3 | 1 634 | 3.51 | 10.12% | 52 | 31.4 |
| 4 | 2 521 | 4.49 | 19.05% | 63 | 40.0 |
| 5 | -1 223 | 0.71 | 32.39% | 84 | -14.6 |
| 6 | 2 504 | 2.29 | 8.75% | 96 | 26.1 |
| 8 (published) | 3 041 | 2.20 | 4.13% | 119 | 25.6 |
| 10 | 3 843 | 2.14 | 13.26% | 152 | 25.3 |
| 12 | 4 364 | 1.84 | 13.46% | 211 | 20.7 |
| 16 | 4 337 | 1.87 | 13.49% | 206 | 21.1 |
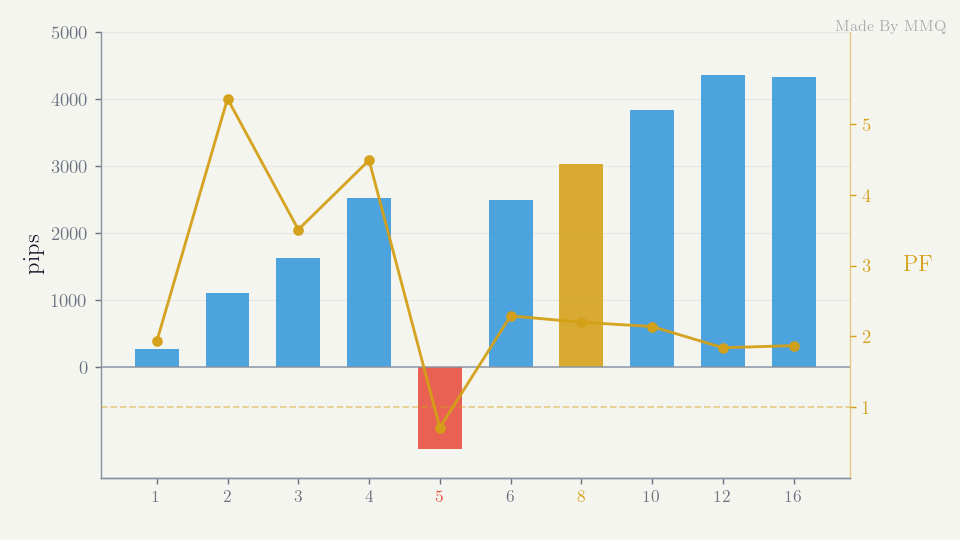
Depth pays here, which is not what you predicted. Net profit climbs to twelve levels and then flattens, so the curve does not peak at two or three. But the rest of the table goes your way: profit factor falls the whole distance, from 5.36 at two levels to 1.84 at twelve, and pips per trade peaks at four levels and then settles at roughly half that. The extra levels are buying volume at a worse rate, not edge. Totals rise, quality falls, and it is quality that decides what happens when the market stops cooperating.
TS1 does not lose in this run. Level one is the largest single contributor at most depths. At ten levels it produces 1,946 of the 3,843 pips on its own. I do not think that contradicts your observation so much as it sits outside it: the published configuration runs with BGT disabled, so this is the trend following mode, stop orders placed in the direction of the move. There is no first position opened at market that then sits underwater while the later ones do the work, which is the structure your finding is about. On an averaging-in system I would expect exactly what you described.
The shallow levels do not concentrate the profit either. At sixteen levels, everything within three levels of the anchor produced 42% of the P&L on 41% of the trades. That is proportional, not front loaded, so there is no subset here that could be kept while discarding the rest.
The result that actually bothers me is depth five. It returns minus 1,223 pips with a 32% drawdown, sitting between plus 2,521 at four levels and plus 2,504 at six. One kill switch event accounts for all of it, on 2026.02.04, where a cycle reached 25.1% drawdown against a 25.0% threshold. It is the only kill in the entire sweep. So one notch of a parameter my own sensitivity table calls moderate, and which I argued affects when ruin arrives rather than whether, flips the sign of the result through a threshold crossing of one tenth of a percentage point.
That makes the published figure one draw from a distribution I never characterised, and characterising it is the work the article should have contained. Your criticism is fair and I would rather have the number than the argument. Thanks for pushing on it.

- Free trading apps
- Over 8,000 signals for copying
- Economic news for exploring financial markets
You agree to website policy and terms of use
Check out the new article: Building a Research-Grounded Grid EA in MQL5: Why Most Grid EAs Fail and What Taranto Proved.
This article implements a regime-adaptive grid trading EA based on the PhD research of Aldo Taranto. It presents a regime‑adaptive grid trading EA that constrains risk through restartable cycles and equity‑based safeguards. We explain why naive grids fail (variance growth and almost‑sure ruin), derive the loss formula for real‑time exposure, and implement regime‑aware gating, ATR‑dynamic spacing, and a live kill switch. Readers get the mathematical tools and production patterns needed to build, test, and operate a constrained grid safely.
Grid trading has a reputation problem. Ask any experienced trader about grid Expert Advisors and the response is predictable: "It looks great until it blows your account." They are not wrong. The well-known MQL5 article Grid and martingale: what are they and how to use them? demonstrates mathematically that a naive grid converges toward ruin. Countless forum threads and blown demo accounts confirm the pattern: steady profits for weeks or months, then a catastrophic loss that wipes everything in days.
But dismissing grid trading entirely based on these failures is, to borrow a phrase from the academic literature, "a gross over-simplification of the resulting stochastic system." The same mathematics that proves why unconstrained grids fail also reveals exactly what makes a constrained, restartable grid survivable and under what conditions it can be profitably operated.
This article is based on Aldo Taranto's PhD research at the University of Southern Queensland (2020–2022). The research formalized grid trading as a Bi-Directional Grid Constrained (BGC) stochastic process, derived conditions for positive expected value, and proved that unconstrained operation leads to almost sure ruin. It also identified the mechanism that prevents ruin: finite, restartable cycles with regime-aware gating.
The Expert Advisor presented here is not a naive grid. It is a regime-adaptive cycle manager with three modes (BGT for ranging, TGT for trending, and MGT for post-trend mean reversion). It also includes ATR-dynamic spacing, equity-based lot sizing, CUSUM structural-break detection, and a diagnostics pipeline with companion Python tools.
Author: Muhammad Minhas Qamar