Discussing the article: "Elastic net regression using coordinate descent in MQL5"
I read the article with great interest, but at the end I got the impression that the author suddenly ran out of letters on his keyboard and left the article unfinished.
"Near the end of the article we will demonstrate the practical application of this method by developing a simple forecasting strategy based on a moving average."
I still don't get it:
1. What is the demonstration of a predictive strategy????
2. Where is there any forecasting of anything at all?
//---
I ran the script, changed only the dates and timeframe in the settings, and got the following entry in the log:
optimal lambda 0.00122302
explained variance 0.9825231703138632
OOS total return = 1.52707 (360.467 percent)
Explain to me what these numbers are supposed to tell me.
The work of the indicator looks strange.
The red line is built at low prices, the yellow one at high prices.
Why in some places high is lower than low?
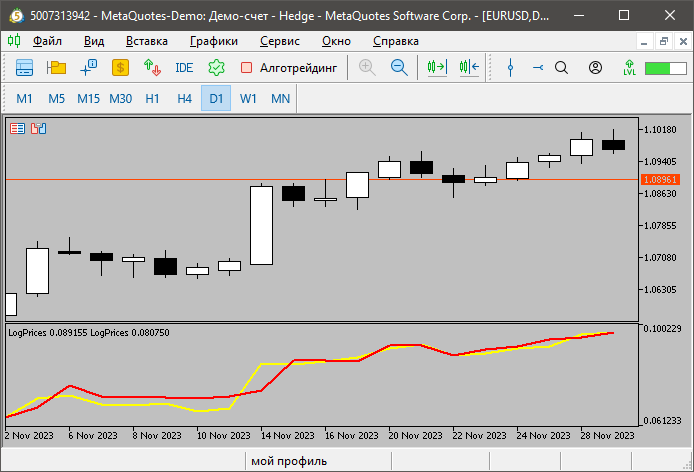
The operation of the indicator looks strange.
The red line is built at low prices, the yellow one at high prices.
Why in some places high is lower than low?
You know that indicators in one subwindow are not brought to the same scale, unless you set it explicitly the same, right?
- Free trading apps
- Over 8,000 signals for copying
- Economic news for exploring financial markets
You agree to website policy and terms of use
Check out the new article: Elastic net regression using coordinate descent in MQL5.
In this article we explore the practical implementation of elastic net regression to minimize overfitting and at the same time automatically separate useful predictors from those that have little prognostic power.
Coordinate descent is a method of optimization well suited to multivariable optimization. A complex multidimensional optimization problem is reduced into a collection of one dimensional problems. Achieved by iteratively minimizing each of the individual dimensions of a function , whilst keeping the values of the function in other dimensions static. There are numerous resources on the internet that can provide more detailed explanations for those interested. Here, we are interested in its application to strategy development.
For our purposes, the coordinate descent method will be used in two ways in the implementation of elastic net regression. First it will be used to determine the optimal lambda based on a fixed alpha, specified by the user. Once this is done, the optimization method is called again to work on the beta coefficients of the regression equation. Lets dive into some code to see how this is accomplished.
Author: Francis Dube