Baracuda - Opinion of programmers and developers - page 4


looked at the charts

INAUDIBLE??????????

where is the +???

I can go to the South at least once a year, to warm seas???? to the sun???

 
Dona_Roza >> :

looked at the charts

INAUDIBLE??????????

where is the +???

I can go to the South at least once a year, to warm seas???? to the sun???

You can also go to the south ;-) It actually requires optimisation, during and after the optimisation period the patient shows a profit. hm........

 
a new version has been released
 
Vladon писал(а) >>
new version released

>> is that a good thing or a bad thing?

 
Shu >> :

is it good or bad?

more likely good than bad :-) in the new version trailing stop is fixed (now it moves not only by specified parameters but it evaluates situation by the same Bollinger Bands)

very handy yesterday put it on Optim 2007, got the results:
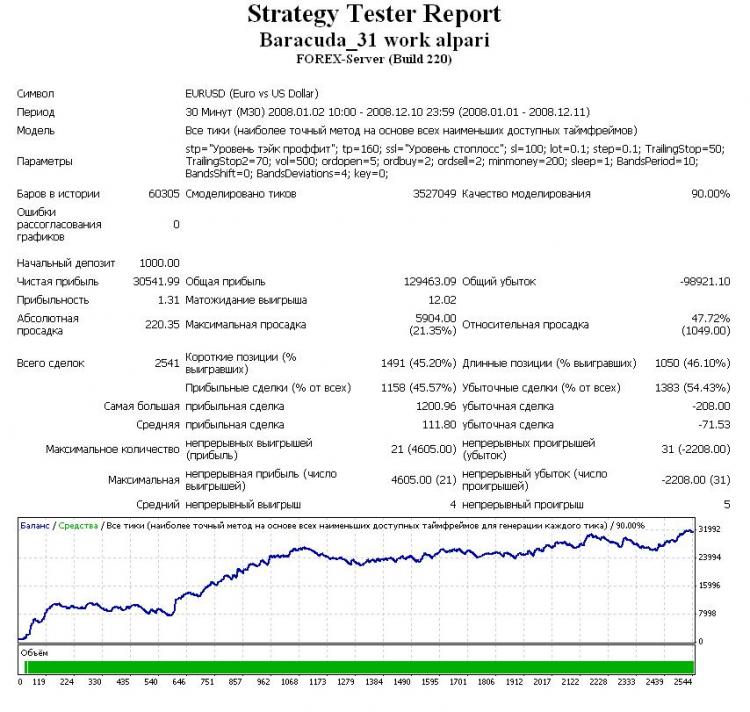
after 2007 I tested it on 2008 as well:: I'm uploading a new version here, test it, see if you don't like it write here

Files:
 

Such pictures can be drawn on one indicator and one lot, and in addition without optimization

it is possible so :


SymbolGBPUSD (Great Britain Pound vs US Dollar)
Period1 Hour (H1) 2007.12.31 00:00 - 2008.12.24 19:00 (2007.12.31 - 2008.12.25)
ModelAll ticks (most accurate method based on all smallest available timeframes)
Parameters____1____="Order Parameters"; TakeProfit=300; sl=30; Lots=0.1; TrailingStop=60; e=30; tenkan=12; kijun=60; senkou_b=120; timeframe=60; po=12;

Bars in history7094Modelled ticks3388832Simulation quality101%
Chart mismatch errors


Initial deposit10000.00


Net profit2669.27Total profit9813.94Total loss-7144.67
Profitability1.37Expected payoff13.41

Absolute drawdown472.97Maximum drawdown975.85 (7.93%)Relative drawdown7.93% (975.85)

Total trades199Short positions (% win)131 (46.56%)Long positions (% win)68 (33.82%)

Profitable trades (% of all)84 (42.21%)Loss trades (% of all)115 (57.79%)
Largestprofitable trade300.44losing deal-366.00
Averageprofitable deal116.83losing trade-62.13
Maximum numbercontinuous wins (profit)11 (1088.70)Continuous losses (loss)8 (-371.78)
Maximumcontinuous profits (number of wins)1114.25 (7)Continuous loss (number of losses)-578.00 (4)
Averagecontinuous winnings2continuous loss3
 

Or like this :


SymbolEURUSD (Euro vs US Dollar)
Period1 Hour (H1) 2007.12.31 00:00 - 2008.12.24 19:00 (2007.12.31 - 2008.12.25)
ModelAll ticks (most accurate method based on all smallest available timeframes)
Parameters____1____="Order Parameters"; TakeProfit=300; sl=30; Lots=0.1; TrailingStop=60; e=30; tenkan=12; kijun=60; senkou_b=120; timeframe=60; po=12;

Bars in history7095Modelled ticks3376677Simulation quality100%
Chart mismatch errors


Initial deposit10000.00


Net profit3359.80Total profit8602.05Total loss-5242.25
Profitability1.64Expectation of winning19.53

Absolute drawdown337.60Maximum drawdown1169.85 (10.80%)Relative drawdown10.80% (1169.85)

Total trades172Short positions (% win)82 (46.34%)Long positions (% win)90 (43.33%)

Profitable trades (% of all)77 (44.77%)Loss trades (% of all)95 (55.23%)
Largestprofitable trade300.00losing transaction-351.85
Averageprofitable deal111.71losing deal-55.18
Maximum numbercontinuous wins (profit)11 (1771.50)Continuous losses (loss)8 (-361.40)
MaximumContinuous Profit (number of wins)1771.50 (11)Continuous loss (number of losses)-361.40 (8)
Averagecontinuous winnings2continuous loss3
 
Hmmm, what does this have to do with the indicator? I use bollinger indicator and it gives a profit, you have a completely different indicator as i understand ishimoku?
 
And notice your profit and mine
 
Vladon >> :
And notice your profit and mine.

Before you measure hm...charts, you should consider the rules of etiquette, and competition rules...I think it's indecent to post charts with increasing lots. I think testing with fixed lot 0.1 is much more informative. Although it still doesn't tell you anything...

Reason: