Machine learning in trading: theory, models, practice and algo-trading - page 511
You are missing trading opportunities:
- Free trading apps
- Over 8,000 signals for copying
- Economic news for exploring financial markets
Registration
Log in
You agree to website policy and terms of use
If you do not have an account, please register
What does "periods of features/predictors" mean? )
for example RSI with periods from 5 to 30, or log of increments for 1 bar or for 50 bars
it's important to track the multicollinearity in the overshooting with different periods, so the model doesn't stall, because sometimes they start to strongly correlate with each other
What if the price starts to fall with the new data? The model expects it to rise. In this situation, the model that I use starts to be a bit dumb and sit in trades for a long time, overstaying.
Well people are just as dumb and try to sit out when a trend period is replaced by a flat or reverse trend...hoping it's a shallow pullback.
I've encountered the phrase "the trend is more likely to continue than to end", but on the other hand it can't continue indefinitely.
So the model is as good as people).
Apparently, when the general trend changes, we should wait, accumulate new data and retrain.

I get the impression that NS has nothing to teach at all, because there are almost no typical situations in the market. Either specially trained robots with a lot of money are breaking patterns on purpose.
My pattern finder couldn't determine a typical double top because in the last year in 20 most similar cases the price worked out a double top pattern and flew further up.
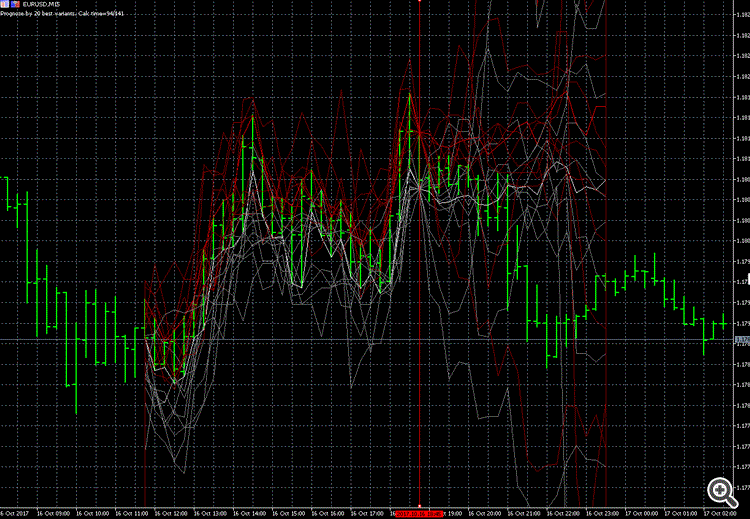
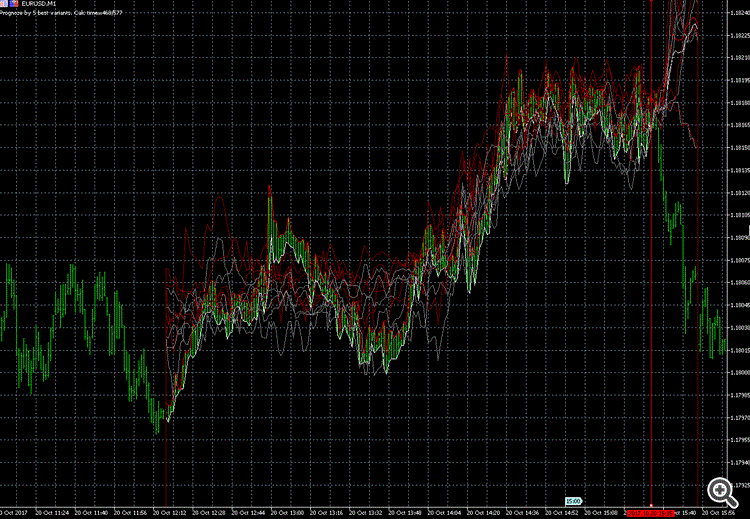
The forecast is represented by the bold red (high) and white (low) lines, gray and dark red variants from the history.
And the most similar variants are not so similar.
Sometimes it predicts in one direction and the price goes in the opposite direction.

So it turns out 50/50, like with a coin.
Periods of the indicators which are predictors
Well you understand that the indicators work only in 5% of cases, when the market randomly synchronized to the period of the indicator and then - Oh miracle stochastic earned in a flat! :) And in every flat)
I think one should not look a dynamic, changing system through an indicator with a fix period, don't you agree?
By the way, the price is more likely to go against the forecast than behind it under certain conditions. And how do you measure proximity? By correlation?
What did you measure proximity by?
Just summed up the difference on each bar of the pattern I was looking for and all the other chunks in the history long into that pattern.
So I finalized the code from the article https://www.mql5.com/ru/articles/197
Well you understand that the indicators work only in 5% of cases, when the market randomly synchronized to the period of the indicator and then - Oh miracle stochastic earned in a flat! :) And in every flat)
I think that we cannot look a dynamic, changing system through an indicator with a fix period, don't you agree?
So, there are a lot of indicators and their period is changing. I already have a system which uses indicators with fix periods and predicts normal predictions (also with periods), now I want to improve it.
I did the same thing )) by the way, the price is more likely to go against the forecast than behind it under certain conditions. And how do you measure proximity? By correlation?
If there is no difference in prognosis, then why spend times more time on more complex things with simple results?
I wondered whether it makes sense to spend time on the MO, if the forecast about 50%. At the mashki I think the same will be.
If there is no difference in the forecast, then why spend times as much time on more complex things with the results of simple?
I don't know, it's a philosophical question.)
Personally, I have no faith in the wrecker
p.s. And as for your handicrafts, you still look, with its help you can predict, but you need to understand the mechanics of the market to understand where and from what angle to lookI don't know, it's a philosophical question.)
Personally, I have no faith in the wrecker.
MytarmailS: Probably will not succeed. p.s. As for your handicrafts, you will still like them, with their help you can make prognoses, but you have to understand the mechanics of the market to understand where and from what angle to look...It takes an awfully long time to count. 0.1-0.5 seconds per 1 bar (depending on the length of the template). Here it is 24 hours to optimize and only 1400 passes. Apparently it will take a week.(
And the first results are not very good: 50% in 2 months, with 30% drawdown.
I have one more idea how to improve it and if it fails I will probably go back to my mashka.
Question to those who have solved regression problems for NS:
What do you feed as a training value (and what do you then predict)?
There are variants:
1) 1 output with increment of price of the next bar (it seems uninteresting to me, since the increment of price of 1 bar is usually negligible)
2) 10-20 outputs with price increments for 10-20 bars (seems to be resource- and time-consuming, but better accuracy)
3) 1 output with incremental price of an extremum along a zigzag (for example, there will be an extremum along the zigzag in 15 bars, give its price)
Which option is better in your opinion? Maybe there is something better?
If the forecast is made for several bars ahead (p.2 and 3), the probability of their performance will obviously decrease. What number would be optimal?