Discussion of article "Testing currency pair patterns: Practical application and real trading perspectives. Part IV"
You are missing trading opportunities:
- Free trading apps
- Over 8,000 signals for copying
- Economic news for exploring financial markets
Registration
Log in
You agree to website policy and terms of use
If you do not have an account, please register
New article Testing currency pair patterns: Practical application and real trading perspectives. Part IV has been published:
This article concludes the series devoted to trading currency pair baskets. Here we test the remaining pattern and discuss applying the entire method in real trading. Market entries and exits, searching for patterns and analyzing them, complex use of combined indicators are considered.
Suppose that a trader entered the market in one of the three described ways. An opposite signal can be used to close a position fully or partially or move it to a breakeven.
1. For example, the indicator enters the oversold area — this is a significant reason to close buy orders or move them to a breakeven (the opposite is true for sell orders).
2. A trader having open orders may detect the MA breakthrough by the indicator graph in the direction opposite to the previously opened orders.
3. A trader may detect that a trend is slowing down by a decreasing distance between the fast and slow moving averages.
4. Finally, reaching the values that are NOT overbought/oversold levels by the indicator may be used as a signal to close/move to a breakeven. For example, this may be level 0%. This level means the "equality" of both currency baskets. The indicator tends to "stumble" on such a level. Hence, this level is a resistance:
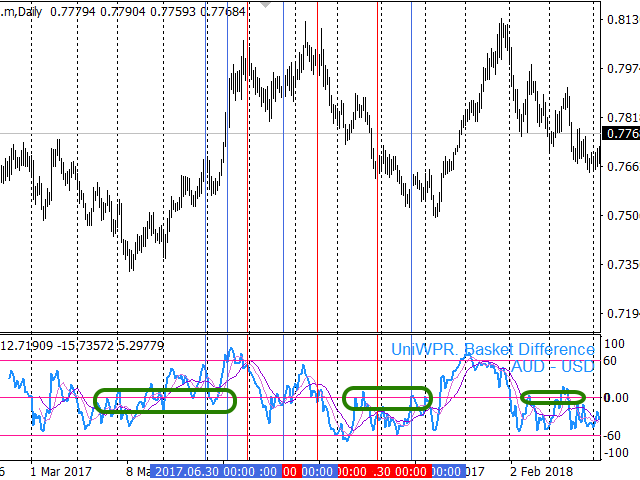
Fibo levels can also be used for that in unified indicators.Author: Andrei Novichkov