ChartSecret.com : Chart Patterns Trading signals
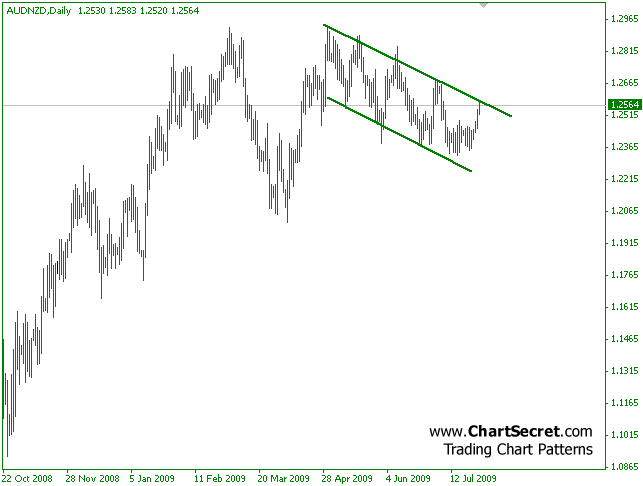
The AUD\NZD has formed an Bullish Flag in the last month, that is coming closer to breakout. Upon breakout we shall expect a movement up until reach of 1.29 Resistance level, which may serve as a block for price. Despite the Double Top that can be seen on Daily charts, the flag pattern is more likely to be taken into effect, turning this market upside down.
Source
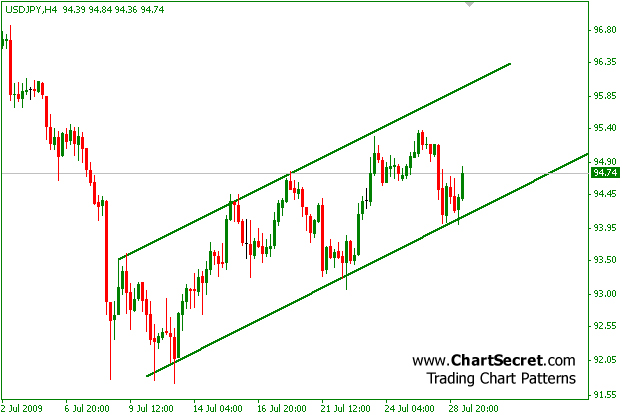
190 pips Channel has appeared at the USD\JPY currency pair. IT is a very precise pattern that upon breakout will yield a massive profit of 190 pips.
It can also be defined as a Flag as the previous downtrend is very strong - meaning that short trades will be even stronger as trading signals.
How To Trade
-Wait for pullback to Support trendline after the breakout
Traget
Target for breakout is 190 pips from the price of pullback.
Source
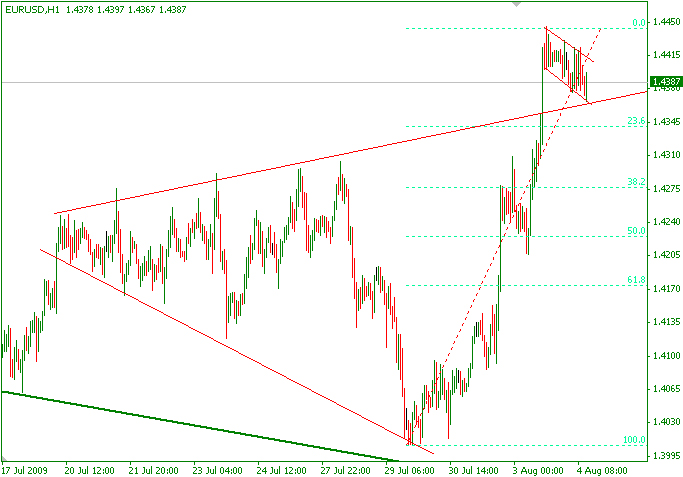
Bullish Patterns at EUR\USD: Megaphone and Flag
Several chart patterns at the EUR\USD indicate a continuation of the latest uptrend. First is the megaphone which caused a big bullish movement at Friday, which price is currently performing a pullback to. After a pullback is complete it will cause continuation of the bullish move. Second pattern is the Flag which is a continuation pattern, and also supports long trades.
EUR\USD Is Bullish: Megaphone Pullback, Flag Continuation | ChartSecret.com
Wait for pullback to Support trendline after the breakout
GBP\USD Weekly FOREX Analysis
Several bullish patterns appeared at the GBP\USD, at daily and weekly charts. Completion of the patterns can yield us profits and will lead to reaching new highs at the GBP\USD. Patterns are the Asymmetric Triangle and Round Bottom.
Source
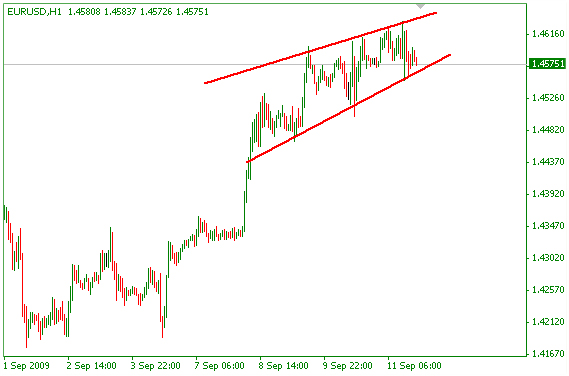
A Wedge pattern is now present at the EUR\USD major pair. The Wedge is a pattern that consists of two trendlines that are congesting, and leads to a reversal in trend. Unlike channel, which is a sign of strength and health of trend, the wedge shows that the trend is about to reverse.
Enter short if price reaches the high of 1.4620 and reverses. Target is at least the beginning of the wedge.
Source:
Thank you for these great technical insights... I hope many are taking them in due consideration.
Thanks bossxero.
AUD\USD Channel - Easy 50 Pips
Channel Chart Pattern has formed at the AUD\USD pair - 48 pips in size. Lately, price seems to be losing momentum, about to break the support level of the channel. The channel was formed near strong resistance at 0.8800 which is a strong round level with high potential of stopping the uptrend.
Trading:
Enter Short at breakout of Support and pullback to the level. Target is 48 pips from the Support level.
Analysis Source:
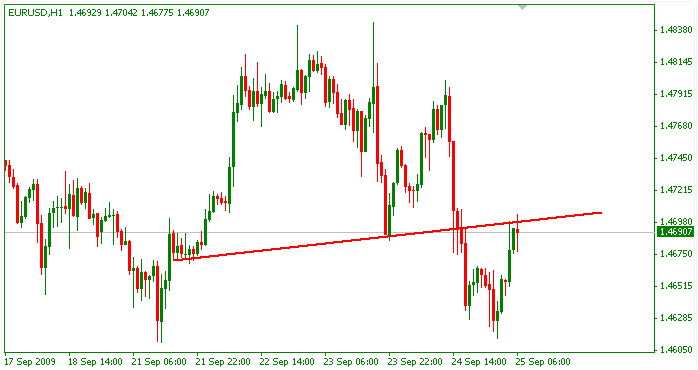
EUR\USD Double Top - Easy 110 Pips
Chart: 1-Hour Chart
Pattern: Double Top
Size: 110 pips.
Description: Double Top pattern has formed at the EUR\USD hourly chart. Price has broken the neckline and now performing a pullback.
Trading: Enter short after pullback is confirmed, take profit is 110 pips from entry rice.
Analysis Source:
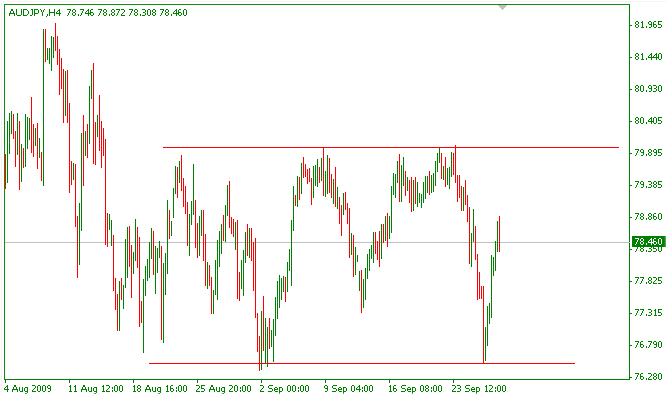
AUD\JPY Trading Range - 350 Pips
The AUD\JPY 'exotic' pair is in a trading range- two horizontal support and resistance levels that bound price and serve as lower and upper boundaries. Support level is at 76.50 and Resistance is at the round level of 80.0. The trading range is 350 pips in size and offers good trading opportunities:
*Long trades will be issued on touch of Support
*Short trades will be issued on breakout of Support or Touch at Resistance.
Analysis and Chart Pattern Trading:
- Free trading apps
- Over 8,000 signals for copying
- Economic news for exploring financial markets
You agree to website policy and terms of use
In this thread we will post trading signal from ChartSecret.com : Chart Patterns Trading for Maximum Profits
18.06.09:
60-pips Flag pattern at the GBP\JPY. Price broke the resistance trendline and created a very precise pullback at the last trading hours of Friday.
Trading
In case of an opening gap upwards - enter long trade.
Source:
Analysis: Flag Pattern | GBP\JPY | ChartSecret.com