Dharmik Team DOW technical analysis
hi Dharmik Team
what is your method of the prediction,elliot wave or other method?
yourspace
15 dec 2010 DOW Analysis feedback
We wrote yesterday:
"DOW stays again between our support from 11.400 and resistance from 11.520. During today's live session same movements in this interval is possible."
AGAIN, PERFECT FORECAST
hahahahhahahhahahaahhaha........banned by banned you arrived also to this forum...........
DOW, S&P 500 e-mini CFD, futures
In this article we will talk about what we should trade and how we should do it. What financial products are more convenient for trading? Why do some traders prefer the futures version of S&P 500 and others like trading CFD for the same index? We will study and compare prices, margins, commissions and spreads.
We will not talk about brokers, brokerage houses or other companies offering financial services because these can be easily found on the internet. We just want to present a comparison between different financial products and advise you what to choose when starting trading.
Lets take this one at a time:
1. What is the difference between CFDs and futures contracts?
What are CFDs?
Contracts for Difference (CFDs) are contracts between a trader and a CFD provider, who will at the close of the contract, exchange the difference between the opening price and the closing price of the underlying index, share, commodity, per the number of specified CFD contracts.
A CFD differs from the traditional trading methods as it is not a purchase of the nominated investment, but trading on its speculated price movement. The main idea of CFDs is the ability to be able to trade higher volumes than traditional trading while using less initial capital.
The buyer of the contracts is required to pay commission to enter the contract, plus fixed interest on the remaining value of the borrowed amount, until they decide to end the contract, at which time they are paid the price difference. The buyer may opt on either side - high (buy) or the low (sell), which means that if the contract was a low trade the buyer could still turn a profit it that was the initial investment.
Advantages of CFDs versus traditional share buying
The key distinction between traditional share buying and CFD buying is that buying a CFD is done on leverage (typically between 5% to 35% for actively traded stocks), both shares and CFDs participate in all corporate actions, both buyers receive dividends but only the buyer of the share is able to vote and receive the franking credits.
With CFDs one is not entitled to these rights, which enables CFD sellers to sell with ease. This makes CFDs an excellent trading product. The leverage and ability to short sell gives power and flexibility.
Unlike futures, CFDs do not have an expiry date, so one can hold on to them for as long as they desire. CFDs open up a whole new trading world, with the ability to trade shares, indices, foreign exchange, and commodities.
CFDs are the flexible new way to trade. One can trade Singapore Stock Exchange (SGX) listed shares but you have access to worldwide markets, such as the United States (DOW, NASDAQ, S&P), United Kingdom (FTSE), Japan (NEIKKI), Hong Kong (Hang Seng) and many other countries.
What is futures contracts
In finance, a futures contract is a standardized contract, traded on a futures exchange, to buy or sell a standardized quantity of a specified commodity of standardized at a certain date in the future, at a price (the futures price) determined by the instantaneous equilibrium between the forces of supply and demand among competing buy and sell orders on the exchange at the time of the purchase or sale of the contract. The future date is called the delivery date or final settlement date. The official price of the futures contract at the end of a day's trading session on the exchange is called the settlement price for that day of business on the exchange.
2. Trading terms for DOW and S&P 500
The mathematical relation between DOW and E-mini S&P 500 futures continuous is 1:9.8, which is almost 1:10. One DOW point represents 10 S&P points.
This is a chart highlighting the differences:

3. Conclusions
The chart helps us draw clear conclusions:
a. If your portfolio is small (10.000$ - 30.000$) it will be very expensive to trade futures contracts. The margin for this type of contract is high, the lever being the same. You will not be able to control the risk and profit as the rules of a classic money management say. The CFDs would be more appropriate. The CFDs for S&P 500 are cheaper and are recommended for portfolios under 2000-3000 $. The traders with more money can efficiently trade Dow Jones.
b. When the portfolio is exceeds 30.000 $ the trader can choose futures contracts. The trading of futures contracts is more advantageous regarding the costs (commissions and spread). The effect of a single S&P 500 e-mini contract is 50 times bigger than the one of a CFD. So when you have enough money it is wiser to trade futures contracts.
c. Both financial products are efficient but they address different types of traders.
The stochastic oscillator – a harmonious system of trading
In the section of technical analysis we have presented the stochastic oscillator. We have talked about what it is, how it is calculated, what its graphic representation is and how it influences trading decisions. We have also showed some examples of charts and we have explained the correct signs for entering and leaving the market in order to make a profit.
We will present here the material again but we will also add some new information to give a new perspective on this indicator. We will create a relatively simple system of interpreting financial evolution. With the help o a harmonious method we will be able to find out, step by step, in every moment, the direction of the main trend, and the most probable patterns to appear. This way we will have all the information needed to make a profitable transaction.
1. What is the “Stochastic Oscillator”?
The stochastic oscillator is a momentum indicator used in technical analysis, introduced by George Lane in the 1950s, to compare the closing price of a commodity to its price range over a given time span.
Closing levels that are consistently near the top of the range indicate accumulation (buying pressure) and those near the bottom of the range indicate distribution (selling pressure).
The idea behind this indicator is that prices tend to close near their past highs in bull markets, and near their lows in bear markets. Transaction signals can be spotted when the stochastic oscillator crosses its moving average.
Two stochastic oscillator indicators are typically calculated to assess future variations in prices, a fast (%K) and slow (%D). Comparisons of these statistics are a good indicator of speed at which prices are changing or the Impulse of Price. %K is the same as Williams’s %R, though on a scale 0 to 100 instead of -100 to 0, but the terminology for the two are kept separate.
2. How is it calculated?
This is the method of calculating the stochastic oscillator, and the values for %K and %D.
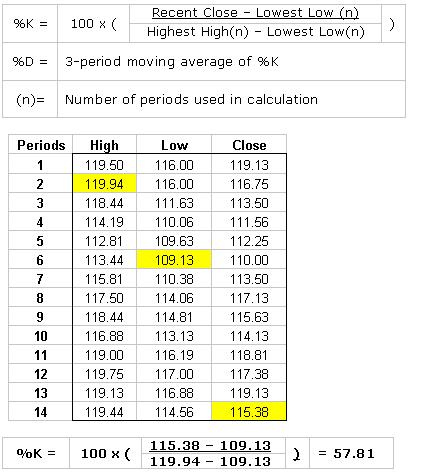
A 14-day %K (14-period Stochastic Oscillator) would use the most recent close, the highest high over the last 14 days and the lowest low over the last 14 days. The number of periods will vary according to the sensitivity and the type of signals desired. As with RSI, 14 is a popular number of periods for calculation
%K tells us that the close (115.38) was in the 57th percentile of the high/low range, or just above the mid-point. Because %K is a percentage or ratio, it will fluctuate between 0 and 100. A 3-day simple moving average of %K is usually plotted alongside to act as a signal or trigger line, called %D.
The %K and %D oscillators range from 0 to 100 and are often visualized using a line plot. Levels near the extremes 100 and 0, for either %K or %D, indicate strength or weakness (respectively) because prices have made or are near new N-day highs or lows.
There are two well known methods for using the %K and %D indicators to make decisions about when to buy or sell stocks. The first involves crossing of %K and %D signals, the second involves basing buy and sell decisions on the assumption that %K and %D oscillate.
In the first case, %D acts as a trigger or signal line for %K. A buy signal is given when %K crosses up through %D, or a sell signal when it crosses down through %D. Such crossovers can occur too often, and to avoid repeated whipsaws one can wait for crossovers occurring together with an overbought/oversold pullback, or only after a peak or trough in the %D line. If price volatility is high, a simple moving average of the Stoch %D indicator may be taken. This statistic smoothes out rapid fluctuations in price.
In the second case, some analysts argue that %K or %D levels above 80 and below 20 can be interpreted as overbought or oversold. On the theory that the prices oscillate, many analysts including George Lane, recommend that buying and selling be timed to the return from these thresholds. In other words, one should buy or sell after a bit of a reversal. Practically, this means that once the price exceeds one of these thresholds, the investor should wait for prices to return through those thresholds (e.g. if the oscillator were to go above 80, the investor waits until it falls below 80 to sell).
The third way that traders will use this indicator is to watch for divergences where the Stochastic trends in the opposite direction of price. As with the RSI this is an indication that the momentum in the market is waning and a reversal may be in the making. For further confirmation many traders will wait for the cross below the 80 or above the 20 line before entering a trade on divergence. The chart below illustrates an example of where a divergence in stochastics relative price forecasted a reversal in the price's direction.
3. Chart examples for Dow and e-mini S&P 500.
In the following examples we will use as parameters other values than the standard ones. We decided to do that because our research proved that these new values are used more and numerous well-known traders agree with them. This way the indicator has a higher precision. We will use the values of 5, 5 and 3 for %K, %D and the third parameter respectively.
Here are some examples where we also used other elements of the technical analysis already explained.
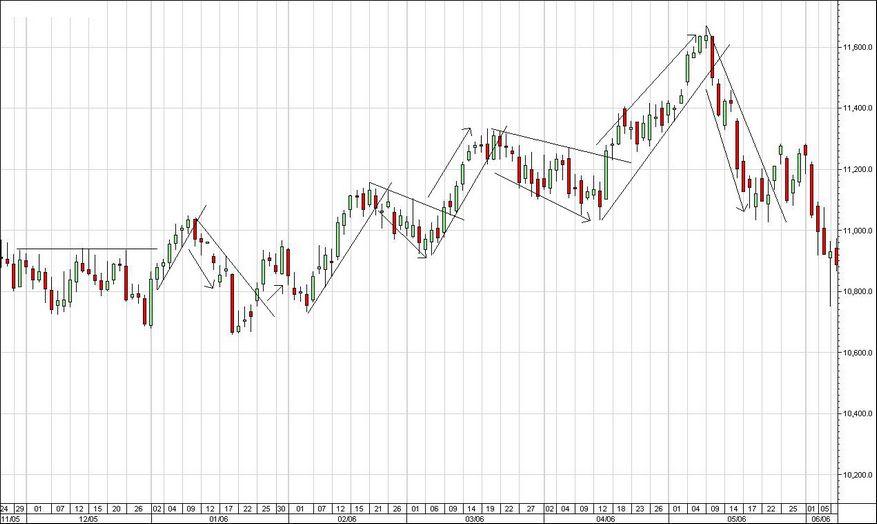
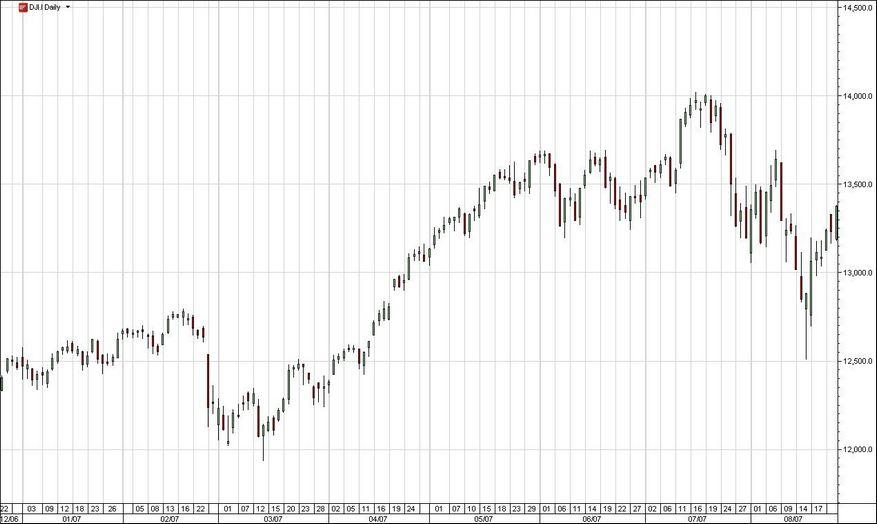
1. First we have a daily chart of Dow Jones for the firs three months of 2006. On the chart we have marked minitrends lasting 1-2 weeks. Each trend follows the previsions given by the stochastic oscillator. During these three months there have been at least seven correct sets to be followed that could generate profit.

2. This chart presents the evolution for the period August- October 2003. We can find the same setups and models. Follow closely the logic for each possible transaction.

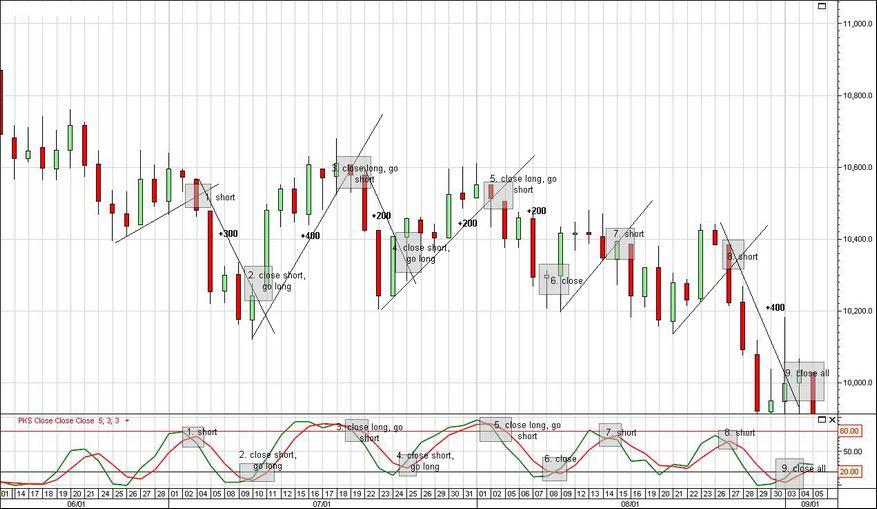
3. The evolution of the market during June – August 2001, before the tragedy in New York: we can find nine correct sets to be trade and obtain profit.
4. A harmonious system
All the charts above (daily) present the daily evolution of Dow Jones; each candlestick represents a day. On these graphics we have marked various possibilities of entering the market and closing in profit.
The harmony of our systems refers to:
a. We start with the longest existing time-frame…let’s say we start with the weekly chart. We insert the stochastic oscillator; we analyze the aspect of the market at that point and the possible patterns beginning to form. Let’s say a LONG could form
b. We decrease the chart to a daily one. We identify the moment in time where we are, we make the same observations and try to find what the pattern is. Let’s assume it is also LONG
c. We now go to a four hours chart. We identify the moment in time and try to find a LONG signal to enter the market. If we will find a short signal or an undetermined one, we will wait. Why? We want to enter the market respecting the main trend. We look for the moment when the stochastic oscillator indicates the same thing on as many time-frames possible. So we will enter only when the four hours chart also shows a LONG signal.
d. We will study the one hour chart and also the 30 minutes chart. We wait to see a LONG signal forming. When we will find here the correct pattern we will know we have the same LONG signal on all time-frames (weekly to 30 minutes graphic). At this point all the chances are that a nice upgoing trend will start, that could last even weeks. This way we have managed to identify the trend from its starting point.
e. How will we trade? It is simple! We take the signals on the 30 minutes chart and we close step by step. The market develops in waves… up and down. The market will most certainly not go straight up. We enter long and wait until on the next time-frame (four hours chart) the direction changes. We partially mark the profit and we move the rest of the quantity on BE (break even). At this point we are relatively tranquil regarding our loos and profit. We wait on the four hours chart for the correction to take place and when the long signal appears we start looking for the same signal on the 30 minutes chart and enter again. We will close again when the 4 hours trend changes direction. We repeat the steps until the biggest time-frame we started with (in this example, the weekly chart) shows the situation has changed.
f. At this point we look for SHORT signals on every time-frame and repeat the procedure.
g. It looks easy, right? It is easy but you need a lot of patience and also some ability of reading and understanding charts.
5. Conclusions
1. Although this system looks a little simplistic, it can get you a lot of pips. You only need patience and some experience in reading financial charts. Our daily analysis will of course give you step by step the direction of the day’s trend and will help you with a lot of information to support your decisions.
2. We often use the stochastic oscillator amongst other various methods of analysis that we will describe later.
Trend lines, resistance and supports
In this article we will discuss about a widespread, well-known key element of technical analysis. Why do you think technical analysis especially some elements work so well for financial markets? Why do you think Fibonacci levels are usually strictly followed? Because thousands and billions of traders and computer programs for trading use these elements. This way everybody acts the same at the same time…
This is why we decided to present in the category of technical analysis, the most used and well-known methods of predicting financial evolution. These methods are easy to understand and are very efficient.
We will present you the trend lines. These lines can be support or resistance of a chart. We will also learn what they are and how can be drawn. We will give some examples of charts of S&P 500 e-mini and Dow and analyze how these charts could have been interpreted and used for a profitable trading day. Finally we will draw the conclusions.
1. What are trend lines?
The trend lines are lines that join two-three or more Lows or Highs of a chart. The price rebounds when intersecting these lines.If we are talking about a support trend line, it joins two or more Lows on the chart.
Each time the price closes the line, it will rebound and go up.A resistance line is just the opposite. It joins the Highs of a chart. When getting to this line, the price rebounds and go down.A trend line can be a straight or a diagonal line.
The straight lines are strong resistance or support lines and show a calm market during a time of accumulation. Diagonal trend lines suggest that we have a positive or negative trending chart depending whether it is an upsloping or a downsloping line .
2. How can we draw trend lines?
Usually these lines join together the extreme Highs or Lows on a chart. The price must never intersect these lines! If a trend line is crossed it looses its significance and the price will go beyond it.
If the price crossed a resistance trend line, it will go up an important amount. After the price will reach a High, it will decrease until it meets the former resistance line that now became a support line. The price will rebound a couple of times at this line until, again, will break it.
It is the same with support trend lines.
It is pretty easy to apply these information in trading. A price that rebounds on a resistance line will determine the trader to go short with a stop loss set above the resistance line. When the price rebound a support line the trader will go long and set a stop loss under the line.
If the price will break these trend lines, the trader has to adapt to the new trend and initiate a transaction accordingly, setting a stop loss on the other side of the broken trend line.
Let us study some examples:
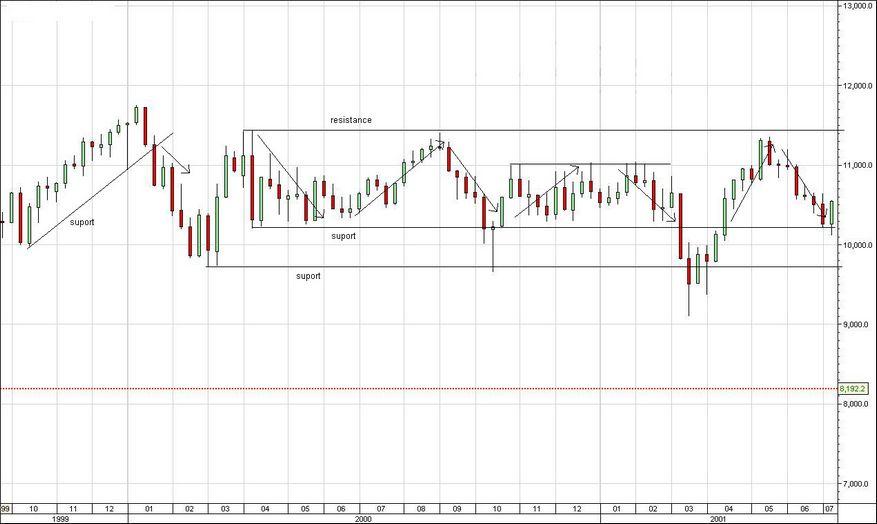
1. The chart shows the time period between 2000 and 2001 for the American indices. In this case the trend is one of accumulation, neutral.
After a period of positive trend, the price breaks through the support trend line, the market goes down until a new support line is formed and up to a new resistance line. From this point forward, for nearly two years, Dow’s evolution was between these trend lines. When the price meets the support line there is a reason to buy, and when it meats the resistance line, to sell…Pretty clear,right?
2. This is a chart for American indices between 2002 and 2003. Following a “Head and Shoulders” pattern, the price breaks the support trend line and forms and ascending slope. The trend will now have a new support and resistance line to show the trader when to buy and when to sell. After three rebounds from the support trend line, the price goes up again and forms an upsloping trend that will last for more than a year.

3. In this example we have a series of minitrends forming a ladder. The price goes up and then down. After the support trend line is broken we should initiate selling positions. After the resistance trend line is broken, we should initiate buying positions.
Conclusions
1. You can observe how useful these trend lines are. The support and resistance trendlines are key elements in analyzing a trend and provide useful information regarding the best time and way of making a transaction.
2. Trading methods based only on trend lines analysis can be found and can work very well. These methods can be harmoniously correlated with other methods of financial analysis resulting in a complete and comlex trading system approaching financial reality.
3. We often use these trend lines amongst other various methods of analysis we will describe later.
DOW and EUR/USD
In this article we will discuss about the correlation between DOW and EUR/USD. We will see if this correlation exists. We will try to find if it is true that both markets share the same money and people. We will find that all these are true. Some chart examples will help us understand why.
We will start first with the type of relation between DOW and EUR/USD (directly or indirectly proportional) and with the degree of correlation. We will see how to come up with a strategy valid for both DOW and EUR/USD or for any other pair of currencies. We will see that it is enough to analyze one chart and then know everything about the other charts (to know what price should have any other financial product at a give moment in time). At the end we will of course draw the conclusions.
1. Is there any correlation between DOW and EUR/USD?
Let’s look at the next charts:

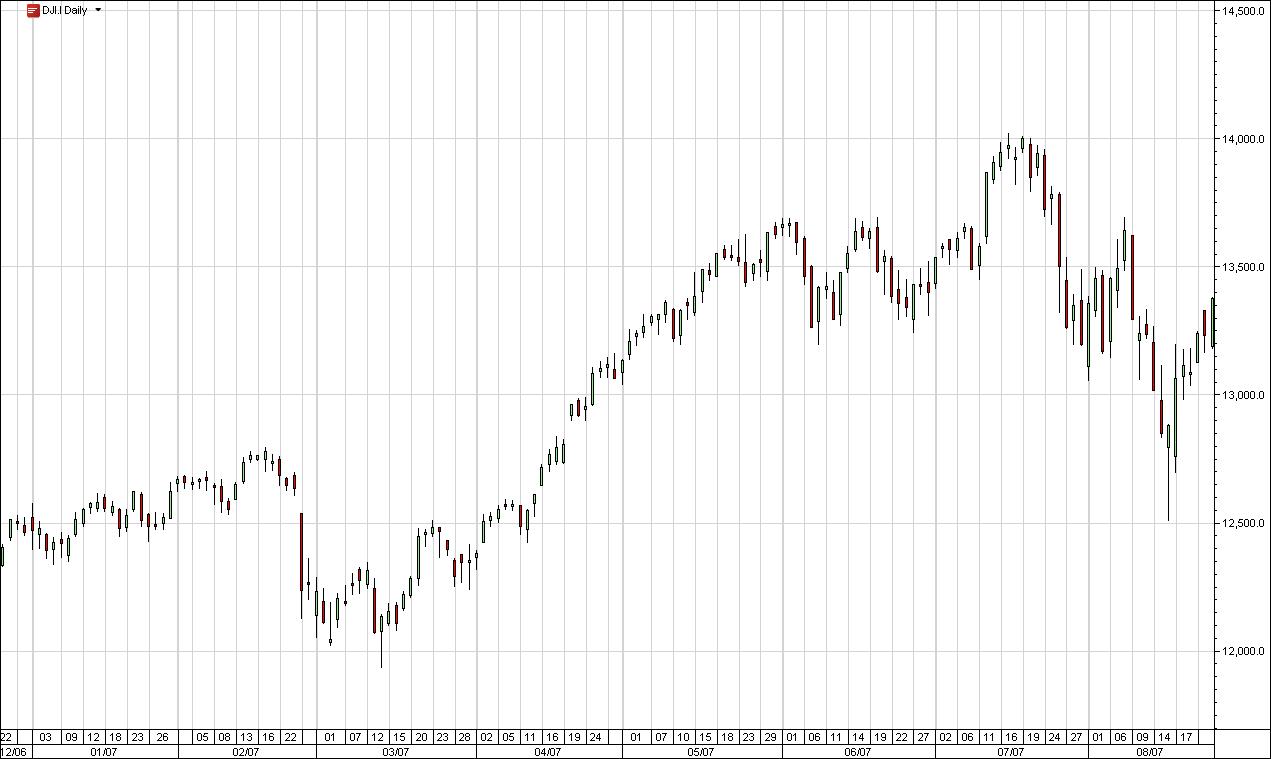
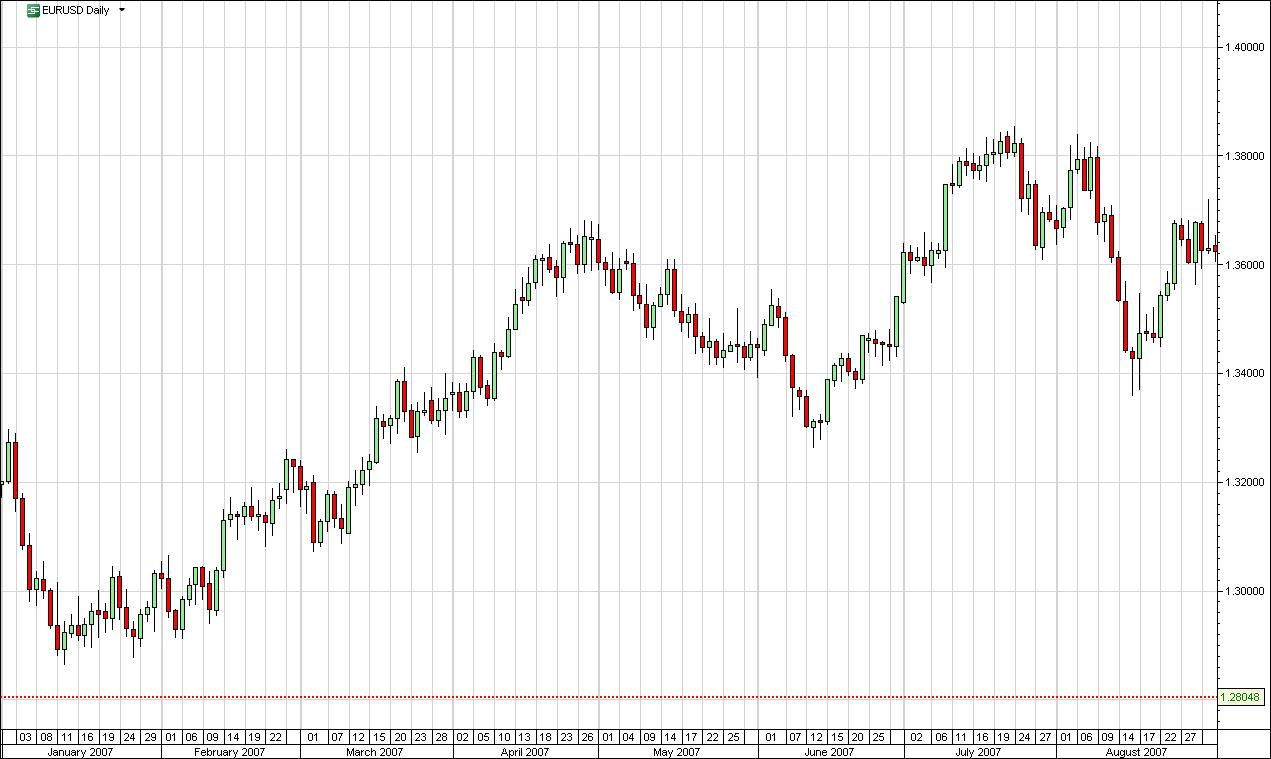
The firs chart is for Dow in January – August 2007. The second one is for EUR/USD in the same period. Are they correlated?
It doesn’t seem to be any correlation when looking at the details. The degree of correlation varies from a period in time to another. When looking at the big picture there seems to be a correlation, right?
First we have a strong increase until May, then a short decrease, then a High in July and an abrupt downward slope in August. This is the same for both charts.
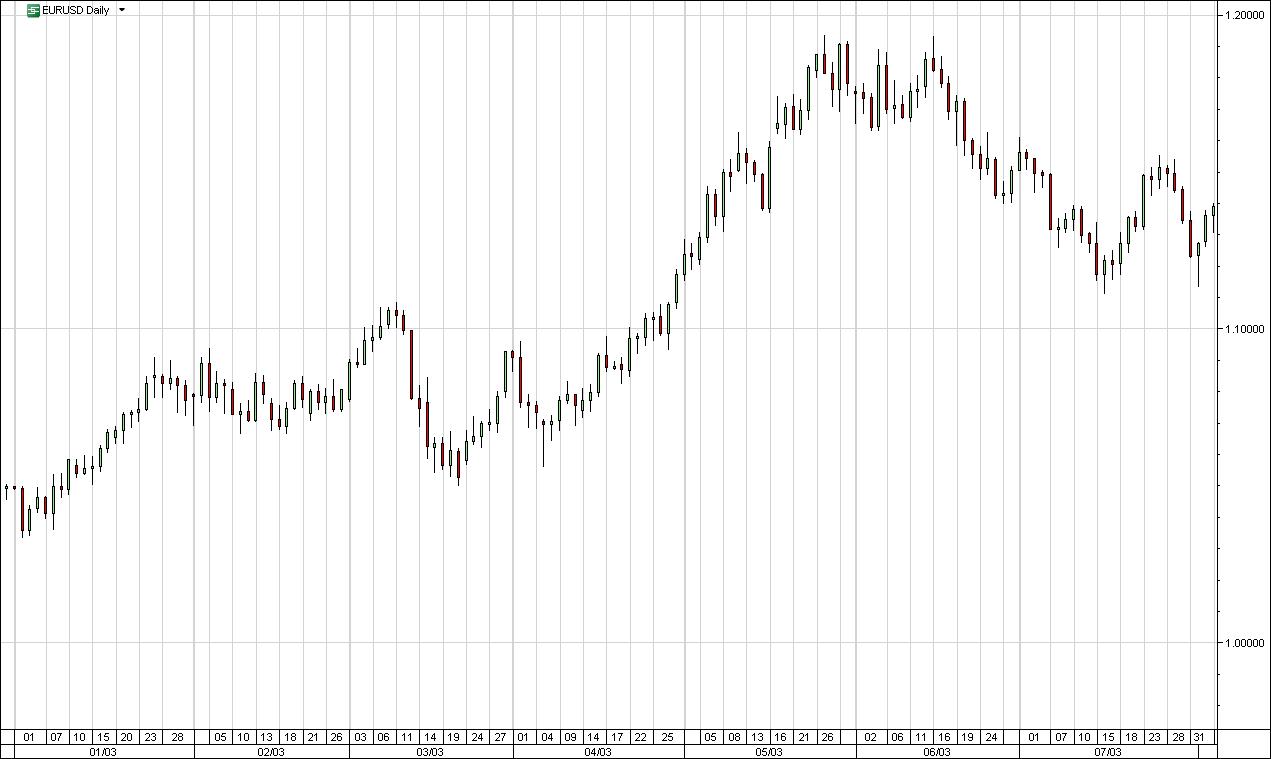
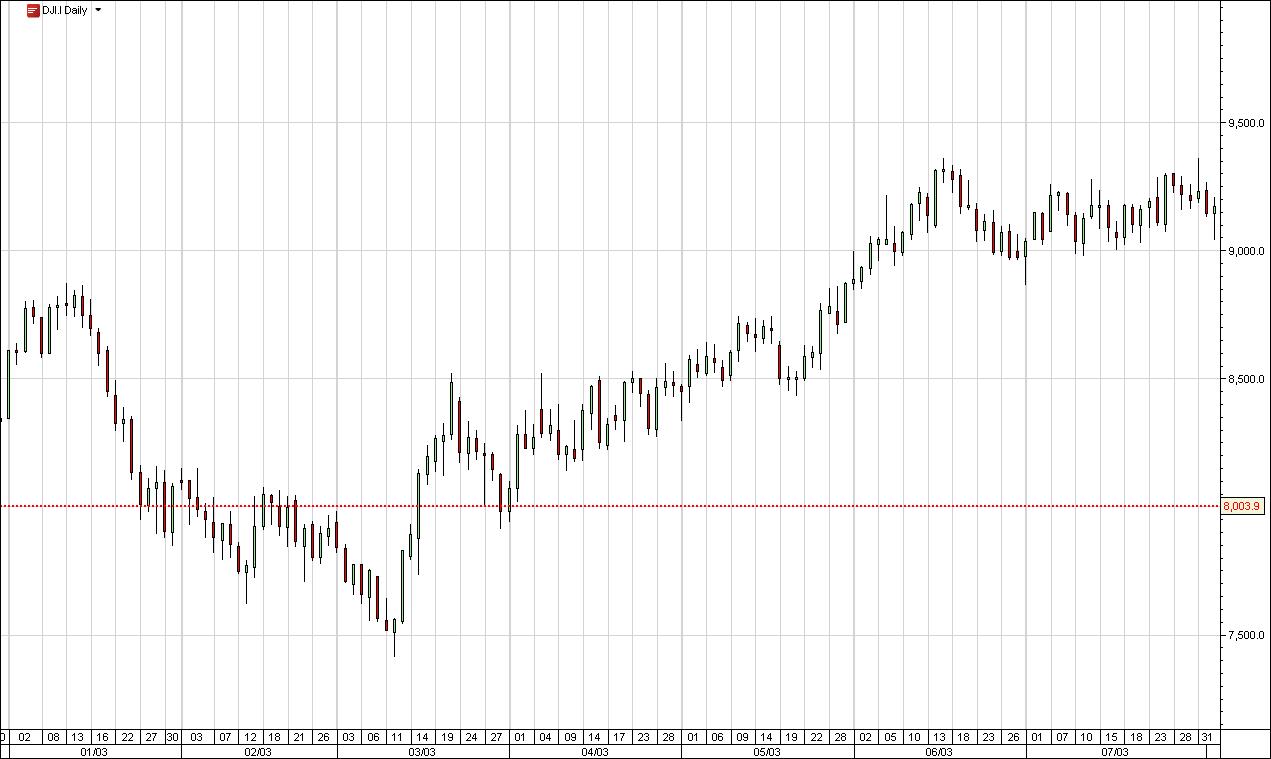
Let’s observe an earlier period in the past:


This is the time period between January and July 2003. Again we can not find a valid correlation between short time spans, but when observing the monthly trend, we can! After the month of January when the charts are different, we see a neutral February trend, a Low in March, an ascending trend until June and a small decrease in July. There is the same big picture on both charts.
Correlation or not?
2. What kind of correlation is there?
The correlation is directly proportional. Every time Dow raises, EUR/USD grows as well. Every time Dow has a period of descending, EUR/USD goes downwards too.
The long time span charts are very clear but they do not offer enough support. More appropriate are the charts on shorter time spans. The intraday charts are the best.
Study the period between 2007 and 2008 with the help of daily charts! When the trend is neutral you will find differences, but when the trend is strong and the money is moving from one financial product to another within seconds, you will find the correct correlation.
3. Is there enough to analyze the evolution of just one financial indicator to know everything else?
We think so! The logic is simple. When Dow is going up it means that American economy is going well. If the economy is rising, it means that the American currency should be stronger. If the currency goes up, then EUR/USD will go down. This is why the intraday charts show an indirect proportionality. Dow and EUR/USD are in direct proportion on medium and long time spans
When, in 2007, the FED began reducing the reference interest, USD became the carry trading currency. That point forward the correlation became directly proportional on short time spans also.
4. Conclusions:
If an intraday analysis of Dow and S&P 500 shows that these indicators will go down, we can assume that EUR/USD parity will also decrease. Having this information and the information provided by other elements of technical analysis you will find the correct signals for entering and leaving the market and for closing in profit.
- Free trading apps
- Over 8,000 signals for copying
- Economic news for exploring financial markets
You agree to website policy and terms of use
AGAIN, PERFECT FORECAST with LIVE SIGNALS
http://www.futureanalyzer.com/Analysis/Dharmik%20Daily%20Indices/2010/December/Dharmik%20Daily%20Indices%20-%2013%20December%20-%20feedback.pdf
HAVE A GREEN DAY!