Working Retracements-Trading After The Fact
...
howie pava
how about
profit target, just 2 x pip spread ==== max 11 pip profit
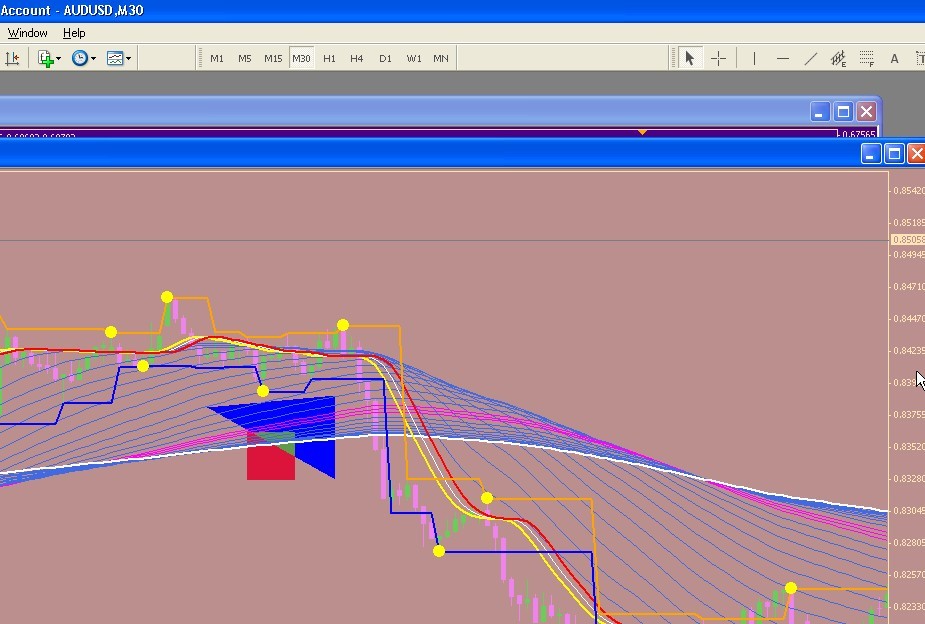
in the dig -- you could see, the support and resistance (5M chart) is the same level as the orange and blue line indicator of yours
usually, it is either WITHIN that framework (right after those S/R are drawn) or after 30 min past each hour and 00 min past each hour -- it could be OUTSIDE that S/R framework (just previous framework)
the 80% to 120% of those lines (i.e. around that region) is a little bit risky == method applies for steady currencies pair (non volatile one, euro and cad is NO NO )
this way, we could collect a few pip -- most of the time (aim at about 2 to 3 times of the pip spread)
hope you will try it and let us know -- could send you the tpl and all those indiciator if you request it and let us SEND somewhere for you to collect itI use my intuition for TP...but for those who are new to trading fixed profit of 2-3 pips is a good beginning...
Why this system works...
Because there is too many traders placing bets on breakouts...
Lot of traders do so
Hi.
Lot of scalpers do so ...
During news this system is dangerous.
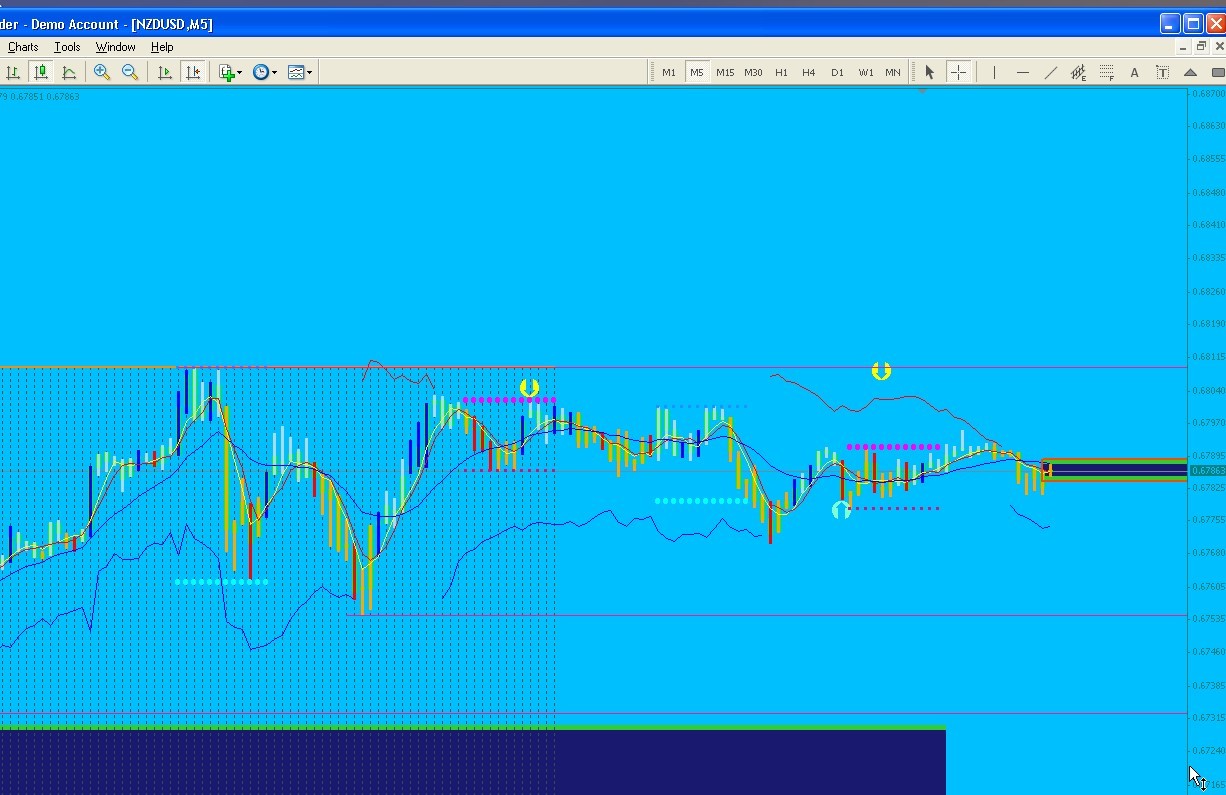
anyone got better 30 min system?
howie pava
how about
profit target, just 2 x pip spread ==== max 11 pip profit
in the dig -- you could see, the support and resistance (5M chart) is the same level as the orange and blue line indicator of yours
usually, it is either WITHIN that framework (right after those S/R are drawn) or after 30 min past each hour and 00 min past each hour -- it could be OUTSIDE that S/R framework (just previous framework)
the 80% to 120% of those lines (i.e. around that region) is a little bit risky == method applies for steady currencies pair (non volatile one, euro and cad is NO NO )
this way, we could collect a few pip -- most of the time (aim at about 2 to 3 times of the pip spread)
hope you will try it and let us know -- could send you the tpl and all those indiciator if you request it and let us SEND somewhere for you to collect it
===
never practice with 30 min chart
but I find the green background one -- is quite GOOD
use the central salmon line Together with the green or red line
== look awesome in AUD and CAD , so far ===
....
see the arrow direction
where to buy , where to sell
(is there any inherited risk ?)this is where stoploss comes in mind
- Free trading apps
- Over 8,000 signals for copying
- Economic news for exploring financial markets
You agree to website policy and terms of use
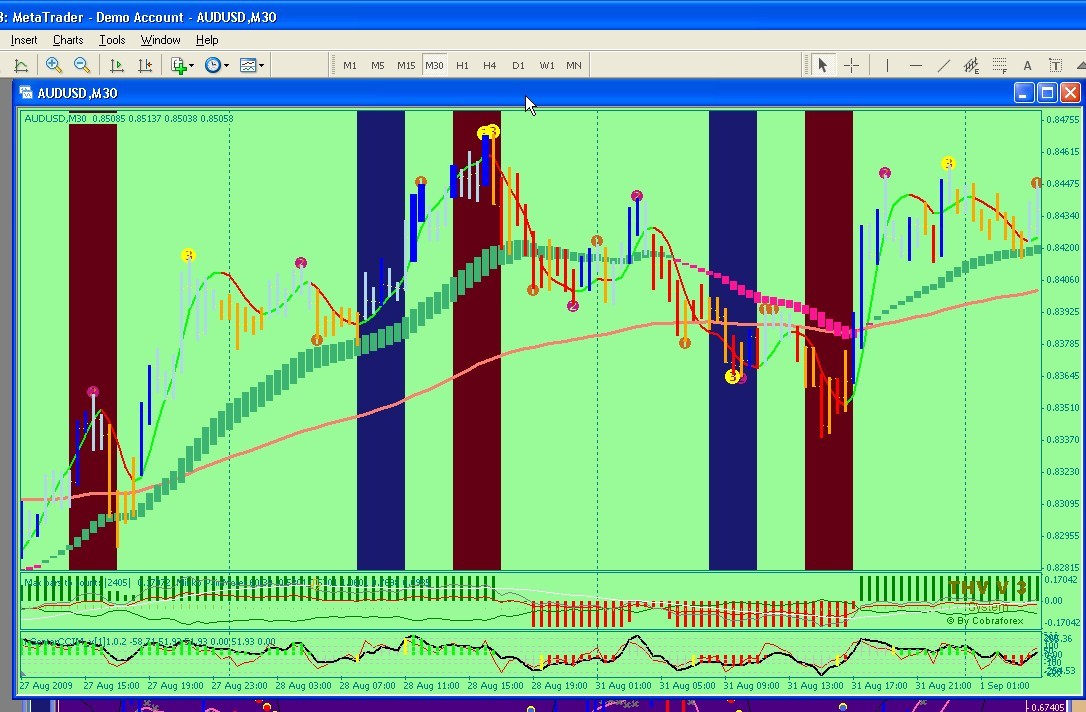
Here is a Super Simple System for Winning some....
1. Wait for Support/Resistance line to get broken.
2. Place horizontal trendline using Easy Expert Advisor...(name trendline BS for
Buy & SS for Sell)...Place Buy/Sell in Direction Opposite to the break.
3. Collect & get out.
Pros:...1. Exxxtra High probability.
2. Less stress.
Cons:..1. Need to use higher frame...from 30 & up...to get some.
2. Use fixed number of pips to collect...2-5 at the most...(depending
on the volatility)
3. As you can see on the illustration attached, Example B: In a
strong trend your placed bet might not get triggered.
Little white arrows are pointing to other instances where trades could have been made.