Price Pattern System
Gidday
Attached is a chart I was using have a look and let me know what you think.
Could Harami candle pattern be altered to confirm this type of signal?
Cheers
Beno
I found the following.
From Achelis: Technical Analysis from A to Z.
Overview
In the 1600s, the Japanese developed a method of technical analysis to analyze the price of rice contracts. This technique is called candlestick charting. Steven Nison is credited with popularizing candlestick charting and has become recognized as the leading expert on their interpretation.
Candlestick charts display the open, high, low, and closing prices in a format similar to a modern-day bar-chart, but in a manner that extenuates the relationship between the opening and closing prices. Candlestick charts are simply a new way of looking at prices, they don't involve any calculations.
Each candlestick represents one period (e.g., day) of data. Figure 45 displays the elements of a candle.I have met investors who are attracted to candlestick charts by their mystique--maybe they are the "long forgotten Asian secret" to investment analysis. Other investors are turned-off by this mystique--they are only charts, right? Regardless of your feelings about the heritage of candlestick charting, I strongly encourage you to explore their use. Candlestick charts dramatically illustrate changes in the underlying supply/demand lines.
Because candlesticks display the relationship between the open, high, low, and closing prices, they cannot be displayed on securities that only have closing prices, nor were they intended to be displayed on securities that lack opening prices. If you want to display a candlestick chart on a security that does not have opening prices, I suggest that you use the previous day's closing prices in place of opening prices. This technique can create candlestick lines and patterns that are unusual, but valid.
The interpretation of candlestick charts is based primarily on patterns. The most popular patterns are explained below.Long white (empty) line. This is a bullish line. It occurs when prices open near the low and close significantly higher near the period's high.
Hammer. This is a bullish line if it occurs after a significant downtrend. If the line occurs after a significant up-trend, it is called a Hanging Man. A Hammer is identified by a small real body (i.e., a small range between the open and closing prices) and a long lower shadow (i.e., the low is significantly lower than the open, high, and close). The body can be empty or filled-in.
Piercing line. This is a bullish pattern and the opposite of a dark cloud cover. The first line is a long black line and the second line is a long white line. The second line opens lower than the first line's low, but it closes more than halfway above the first line's real body.
Bullish engulfing lines. This pattern is strongly bullish if it occurs after a significant downtrend (i.e., it acts as a reversal pattern). It occurs when a small bearish (filled-in) line is engulfed by a large bullish (empty) line.
Morning star. This is a bullish pattern signifying a potential bottom. The "star" indicates a possible reversal and the bullish (empty) line confirms this. The star can be empty or filled-in.
Bullish doji star. A "star" indicates a reversal and a doji indicates indecision. Thus, this pattern usually indicates a reversal following an indecisive period. You should wait for a confirmation (e.g., as in the morning star, above) before trading a doji star. The first line can be empty or filled in.Long black (filled-in) line. This is a bearish line. It occurs when prices open near the high and close significantly lower near the period's low.
Hanging Man. These lines are bearish if they occur after a significant uptrend. If this pattern occurs after a significant downtrend, it is called a Hammer. They are identified by small real bodies (i.e., a small range between the open and closing prices) and a long lower shadow (i.e., the low was significantly lower than the open, high, and close). The bodies can be empty or filled-in.
Dark cloud cover. This is a bearish pattern. The pattern is more significant if the second line's body is below the center of the previous line's body (as illustrated).
Bearish engulfing lines. This pattern is strongly bearish if it occurs after a significant up-trend (i.e., it acts as a reversal pattern). It occurs when a small bullish (empty) line is engulfed by a large bearish (filled-in) line.
Evening star. This is a bearish pattern signifying a potential top. The "star" indicates a possible reversal and the bearish (filled-in) line confirms this. The star can be empty or filled-in.
Doji star. A star indicates a reversal and a doji indicates indecision. Thus, this pattern usually indicates a reversal following an indecisive period. You should wait for a confirmation (e.g., as in the evening star illustration) before trading a doji star.
Shooting star. This pattern suggests a minor reversal when it appears after a rally. The star's body must appear near the low price and the line should have a long upper shadow.Long-legged doji. This line often signifies a turning point. It occurs when the open and close are the same, and the range between the high and low is relatively large.
Dragon-fly doji. This line also signifies a turning point. It occurs when the open and close are the same, and the low is significantly lower than the open, high, and closing prices.
Gravestone doji. This line also signifies a turning point. It occurs when the open, close, and low are the same, and the high is significantly higher than the open, low, and closing prices.
Star. Stars indicate reversals. A star is a line with a small real body that occurs after a line with a much larger real body, where the real bodies do not overlap. The shadows may overlap.
Doji star. A star indicates a reversal and a doji indicates indecision. Thus, this pattern usually indicates a reversal following an indecisive period. You should wait for a confirmation (e.g., as in the evening star illustration) before trading a doji star.Spinning tops. These are neutral lines. They occur when the distance between the high and low, and the distance between the open and close, are relatively small.
Doji. This line implies indecision. The security opened and closed at the same price. These lines can appear in several different patterns.
Double doji lines (two adjacent doji lines) imply that a forceful move will follow a breakout from the current indecision.
Harami ("pregnant" in English). This pattern indicates a decrease in momentum. It occurs when a line with a small body falls within the area of a larger body.
Harami cross. This pattern also indicates a decrease in momentum. The pattern is similar to a harami, except the second line is a doji (signifying indecision).But I don't think that this information is fully related to your subject.
Thanks for the reply Newdigital.
Yes you are correct it is'nt quite what I am looking for.
But its always good to read new things.
Any way I have found an indicator for the inner bar.
Now I just need the Trailing Stop.
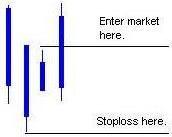
Attached is an example of an outer bar trade with the inside bar trailing stop.
15min chart 16 pips profit.
Is anyone interested in helping to develop this system. I don't mean writing the code but help with the rules for each pattern. see the example for a long entry.
These sort of patterns are not restricted to any time frame or pairs.
If you want more info on some of the patterns Try looking at Technical Analysis Explained four edition Martin J Pring.
Inner Bar (Inside Bar, Inside Day)
Outer Bar (Outside Bar, Outside Day)
2 Bar Reversal
and the Key Reversal Bar
Gidday
Attached is a system that I am thinking of having made into an EA but I would like  on weather this has been done before and any pitfalls.
I have attached my current manual open positions on Demo (unfortunately)
Cheers
Beno
I used to have a book in my rather large technical analysis library that included an extensive test of the efficacy of price patterns (I've since thrown all of these books away). All the well known price patterns were included, and the study was based on how effective these patterns were both at predicting price movement and how well they acted as entry indicators.
The study concluded... none of them work.
A head and shoulders pattern is as likely to appear at a bottom as a top. A pennant is as likely to break out one way as the other, etc. My experience has confirmed this as well.
The only thing in this realm that seems to work for some traders is simple support and resistance.
However you're able to profit from them, that's great, more power to you.
That's an interesting outlook on Price Patterns. did you use any indicators to support a price patterns when you experimented with the patterns?
I'm asking mainly because I used to be a pattern trader. My particular favorite is the 123 UP/Down pattern. Each pattern had to have strong support by two or more indicators, up or down, before the pattern became a valid trade.
About 30 or so years ago a trader named Ken Roberts came out with the now famous 123 pattern. His theory was that they were only valid on a yearly basis.
I found them to work pretty good on just about any time frame. There are a couple of 123's on the 15 min GBP/USD starting about 1915 EST on 9-11-08. I'm working on trying to get a pic uploaded. They were really good ons tho.
I traded the patterns for a long time in the futures markets;even wrote a book once. I've noticed that they also work in the FOREX so I think I'm going to start hunting for them.
Just some thoughts on price patterns.
Good trading
RT...
PS... Here is the picture of the GBP/USD 15Min. with a couple of 123 price patterns.
That's an interesting outlook on Price Patterns. did you use any indicators to support a price patterns when you experimented with the patterns?
I'm asking mainly because I used to be a pattern trader. My particular favorite is the 123 UP/Down pattern. Each pattern had to have strong support by two or more indicators, up or down, before the pattern became a valid trade.
About 30 or so years ago a trader named Ken Roberts came out with the now famous 123 pattern. His theory was that they were only valid on a yearly basis.
Hi,
I'm not Beno  but my persona experience is that patterns works on forex like works on any other market, stocks, shares, commodities...
- Free trading apps
- Over 8,000 signals for copying
- Economic news for exploring financial markets
You agree to website policy and terms of use