BBand settings?
Erdenebayar Lamjav:
The settings stay the same
When I use BBands period 20, dev 2.0 on M15, I change my timeframe to H1, That 20, 2.0 settings how changed on H1 timeframe?
Period 80? or else? And deviation 8.0? or else?
Keith Watford:
The settings stay the same
The settings stay the same
My question is wrong
BBands period 20, dev 2.0 on H1 is how about M15?
Erdenebayar Lamjav:
The settings stay the same when you change time-frames.
My question is wrong
BBands period 20, dev 2.0 on H1 is how about M15?
I tell you a simple and intelligent way.
Put two indicator on chart with two setting that you need and in the Visualization tab of indicators setting window, select M15 for one and H1 for other.
Put two indicator on chart with two setting that you need and in the Visualization tab of indicators setting window, select M15 for one and H1 for other.
Erdenebayar Lamjav: When I use BBands period 20, dev 2.0 on M15, I change my timeframe to H1, That 20, 2.0 settings how changed on H1 timeframe? Period 80? or else? And deviation 8.0? or else?
@All:What the OP is asking about, is the use of the "equivalence ratio" of applying a moving average which will result in a similarity to a multi-time-frame indicator.@Erdenebayar Lamjav
Yes Erdenebayar, you are partially correct! For a Bollinger Bands (which is based on a moving average), the period should be multiplied by the ratio between the two time-frames in order to compensate and obtain an equivalence.
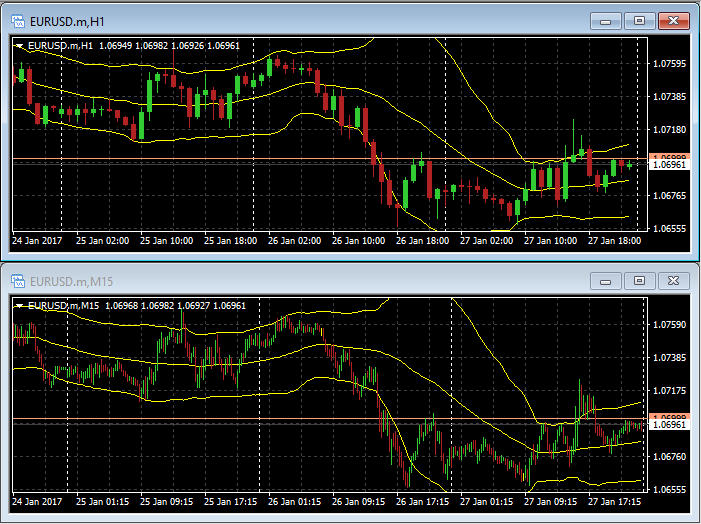
So for a 20 Period Bollinger Band on H1, the equivalent on M15 is 20 x H1 / M15 = 20 * 60 / 15 = 20 * 4 = 80 (as you mentioned).
However, the Standard Deviation ratio should not be changed. It should remain at 2.0, as only the period needs to be adjusted.
Here is a screen shot to show the comparison, with the "Zoom" scale altered on the M15 so you can easily compare the two:
Fernando Carreiro:
@All:
Thank you Sir
@All:
What the OP is asking about, is the use of the "equivalence ratio" of applying a moving average which will result in a similarity to a multi-time-frame indicator.@Erdenebayar Lamjav
Yes Erdenebayar, you are partially correct! For a Bollinger Bands (which is based on a moving average), the period should be multiplied by the ratio between the two time-frames in order to compensate and obtain an equivalence.
So for a 20 Period Bollinger Band on H1, the equivalent on M15 is 20 x H1 / M15 = 20 * 60 / 15 = 20 * 4 = 80 (as you mentioned).
However, the Standard Deviation ratio should not be changed. It should remain at 2.0, as only the period needs to be adjusted.
Here is a screen shot to show the comparison, with the "Zoom" scale altered on the M15 so you can easily compare the two:
Fernando Carreiro:
@All:
Well, it's not an equivalent (but can be said to be close enough), for example:@All:
What the OP is asking about, is the use of the "equivalence ratio" of applying a moving average which will result in a similarity to a multi-time-frame indicator.@Erdenebayar Lamjav
Yes Erdenebayar, you are partially correct! For a Bollinger Bands (which is based on a moving average), the period should be multiplied by the ratio between the two time-frames in order to compensate and obtain an equivalence.
So for a 20 Period Bollinger Band on H1, the equivalent on M15 is 20 x H1 / M15 = 20 * 60 / 15 = 20 * 4 = 80 (as you mentioned).
However, the Standard Deviation ratio should not be changed. It should remain at 2.0, as only the period needs to be adjusted.
Here is a screen shot to show the comparison, with the "Zoom" scale altered on the M15 so you can easily compare the two:
If you take the period on the 1 HR to be 1 (for simplicity) - and the 1 HR candle was closed supposedly on price 1.5
but the 1 HR candle is comprised of 4 15M candles that were closed in this order - 1.51, 1.53, 1.6, 1.5 (the average of those 4 candles is above 1.5 - so it's not equal the average of the 1HR)
on the long run it can be close enough yet, if you rely on the assumption that average of each 4 candles of the 15M will be approximately the same as the 1HR close price and if not then the flunctuation will be more or less the same - some candles will close above but then the next will close below and so on.
You are missing trading opportunities:
- Free trading apps
- Over 8,000 signals for copying
- Economic news for exploring financial markets
Registration
Log in
You agree to website policy and terms of use
If you do not have an account, please register
When I use BBands period 20, dev 2.0 on M15, I change my timeframe to H1, That 20, 2.0 settings how changed on H1 timeframe?
Period 80? or else? And deviation 8.0? or else?