Wrong value in data window
Hi,
I've encountered a strange behaviour with the display of an indi:
The attached screenshot shows different values for the thin red line:
What screen shot ?
I'm sorry about the missing picture, but I'm just tired of playing around to get the proper file uploaded in such a format, that one can see anything.
Nevertheless: the problem stays as described above: the y-axis shows a different value for the indicator than the data window.
Why?
I'm sorry about the missing picture, but I'm just tired of playing around to get the proper file uploaded in such a format, that one can see anything.
Nevertheless: the problem stays as described above: the y-axis shows a different value for the indicator than the data window.
Why?
Because you did something wrong . . .
If you want to upload your screen shot you can use a jpg, gif, png and then click on the correct ICON to upload it don't attach it as a file.
I know about the upload icon. The problem is, to show a value in the data window, I need the mouse being positioned at the appropriate position in the chart.
So I can't use the mouse to make an MT4 screenshot of the workspace.
I only found a Terminal hotkey for printing the chart, but not the workspace.
When using windows PRINT SCREEN and pasting into PowerPoint or Paint, and then save as png,
I get the quality you see above.
But you might guess the values from my description above.
Thanx.
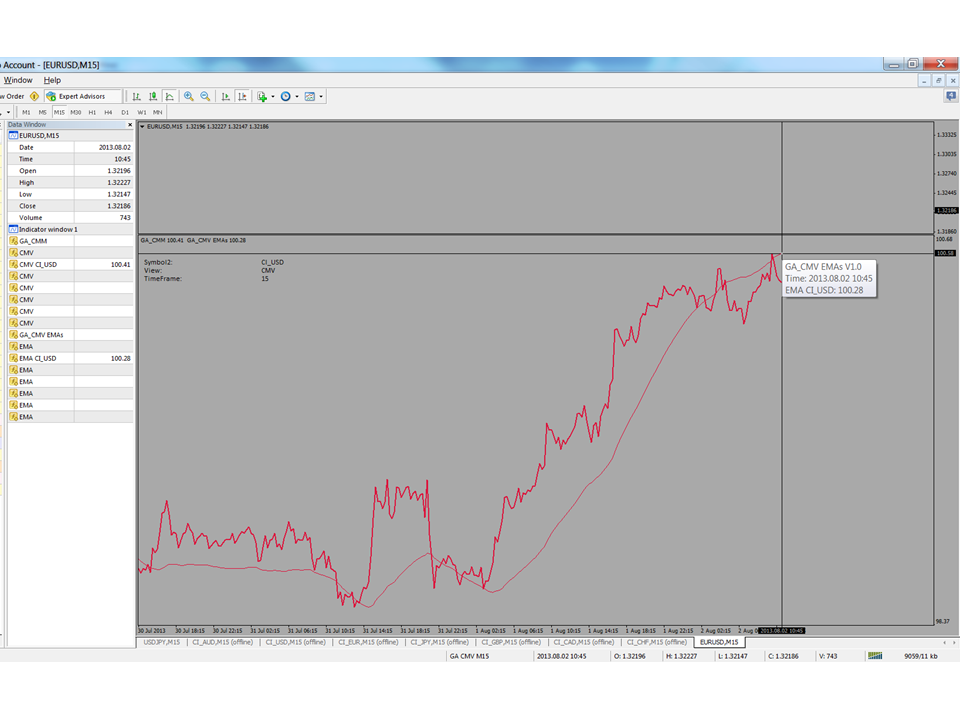
at the crosshairs it says EMA CL_USD 100.28
In the data window it says the same.
So what is the problem?
@RaptorUK:
The thick line is CMV CI_USD, with a value of 100.41, which is correct in the data window and in the y-axis.
@GumRai: @RaptorUK:
The problem is the thin line, which is EMA CI_USD (an EMA 55 of the thick line CMV CI_USD ):
The crosshair and data window show 100.28, but the correct value is 100.58, as shown in the y-axis.
You can see in the chart that the thin line is above the thick line.
So with the value of the thick line being 100.41, the value of the thin line can't be 100.28 as shown in the data window and crosshair.
The thin line is supposed to be the EMA, but in fact it's not, because there's a problem somewhere.
This is, what I'm trying to find out.
I've programmed the thin line.
But how come that data window and y-axis show different values for the thin line?
I hope, that the answer to this could give me a hint for my problem with the EMA.
- Free trading apps
- Over 8,000 signals for copying
- Economic news for exploring financial markets
You agree to website policy and terms of use
Hi,
I've encountered a strange behaviour with the display of an indi:
The attached screenshot shows different values for the thin red line:
the value shown in the data window and in the cross hair is 100.28.
While the value shown in the y-axis of the chart is 100.58, which is the correct one.
For the thick red line there is no such divergence.
Any ideas?