Differences with the same trendline in different timeframes
Hi,
thank you for your answer.
I have checked the settings for the line (the are standard, ray-yes and on each timeframe)
Here I have made a few screenshots to show me problem:
M1:

M5:

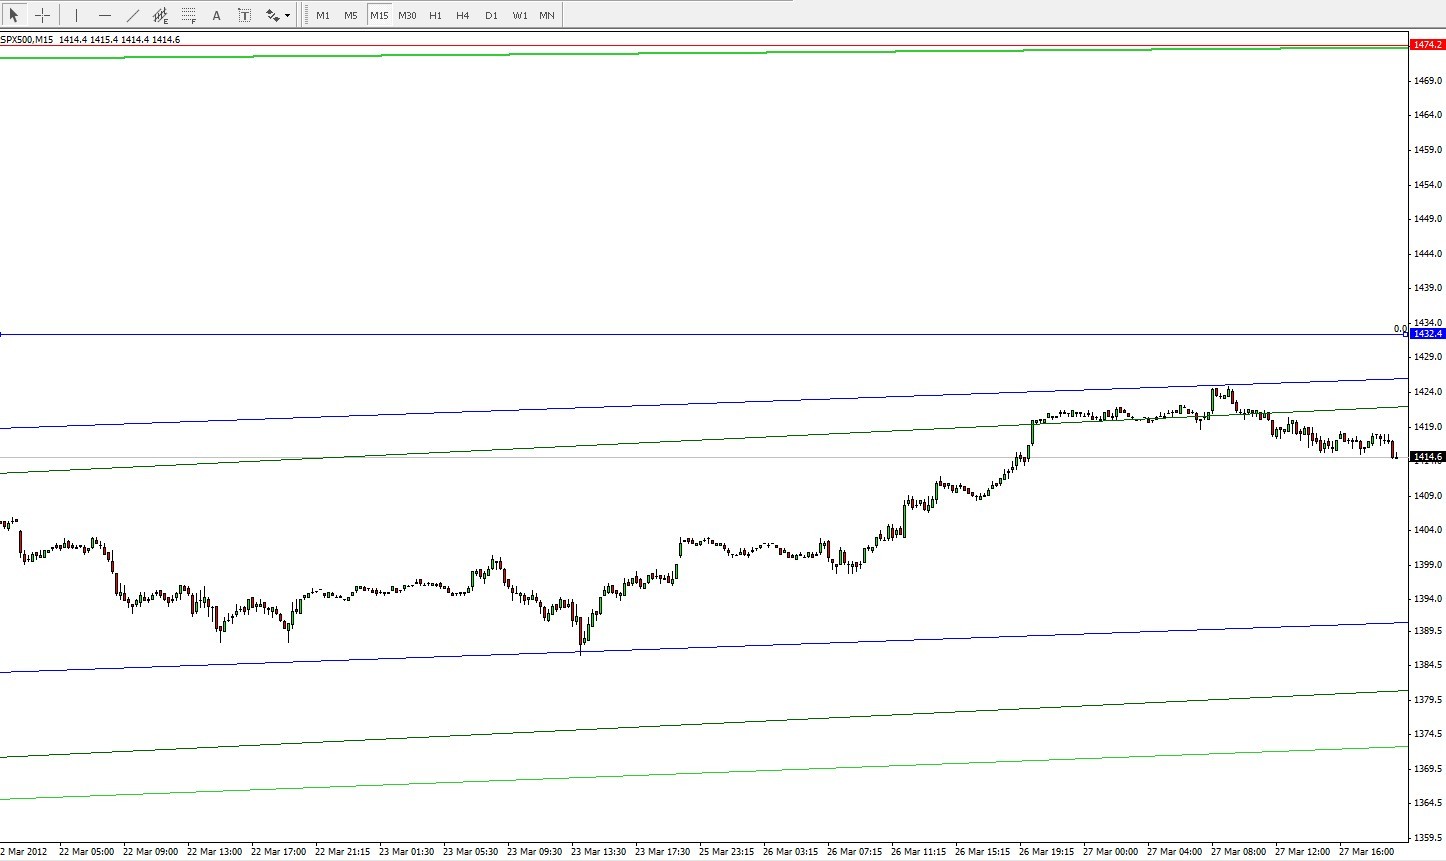
M15:
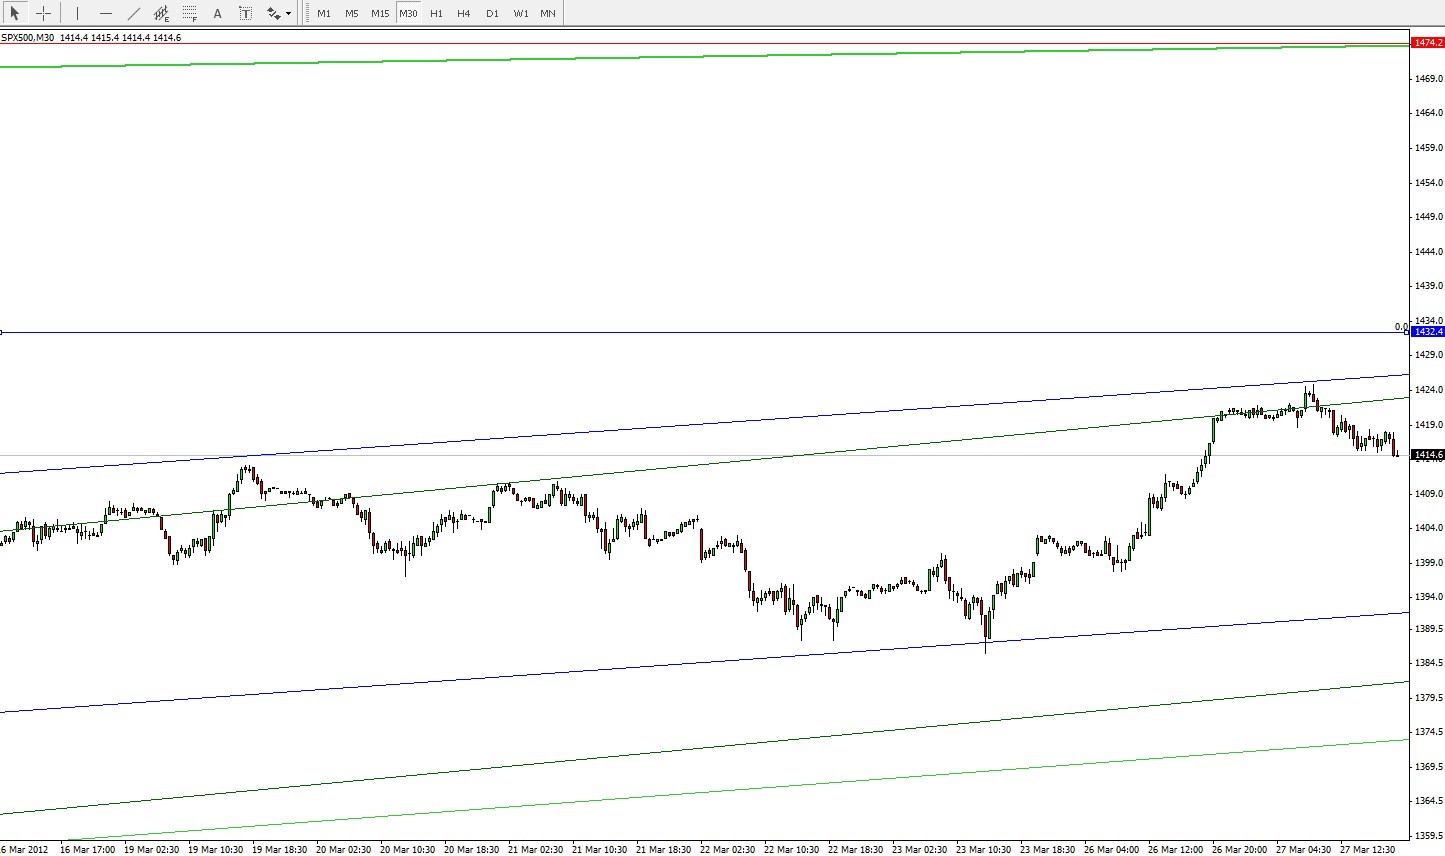
M30:
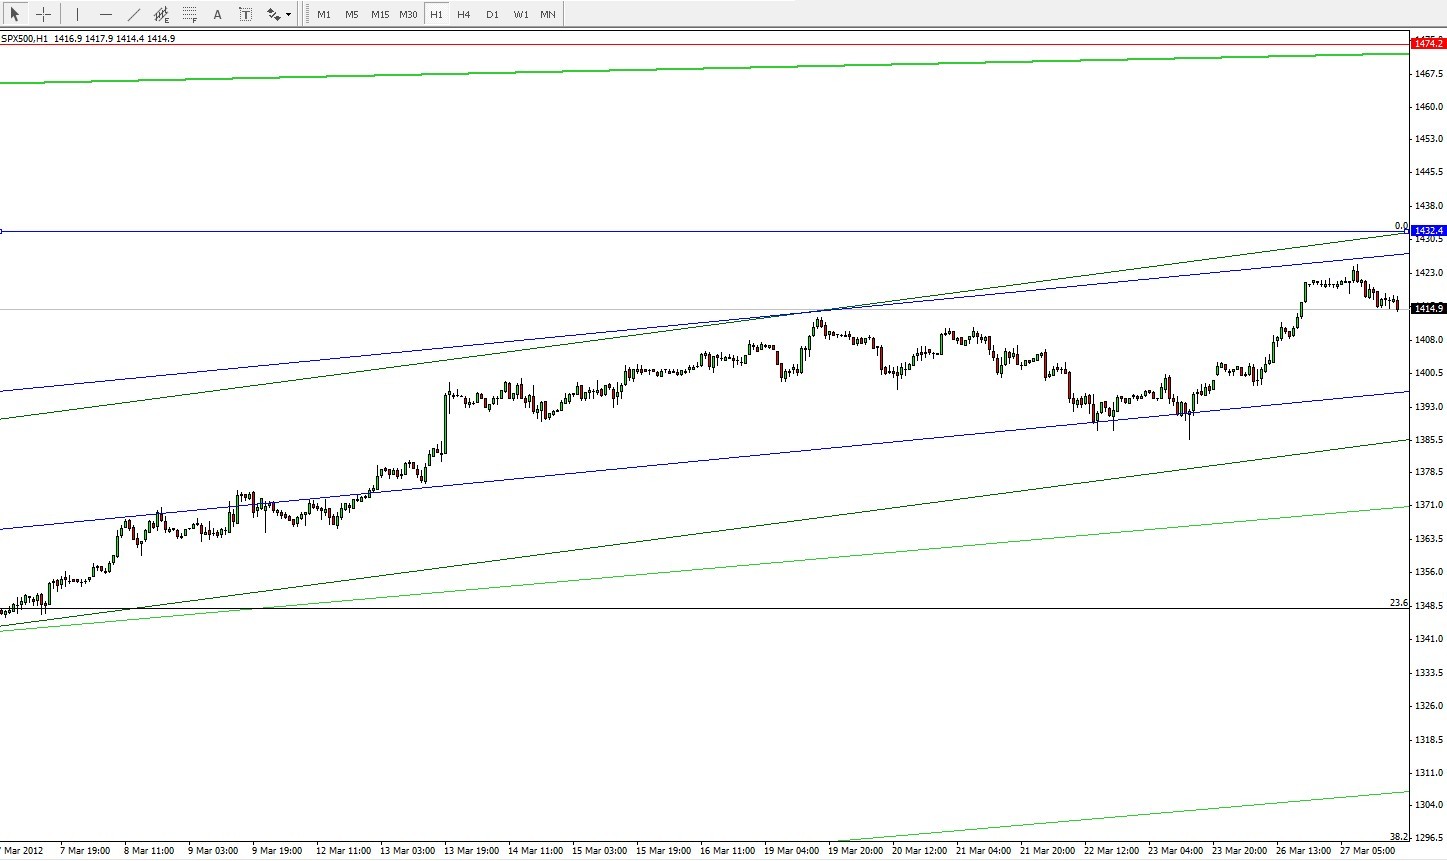
H1:
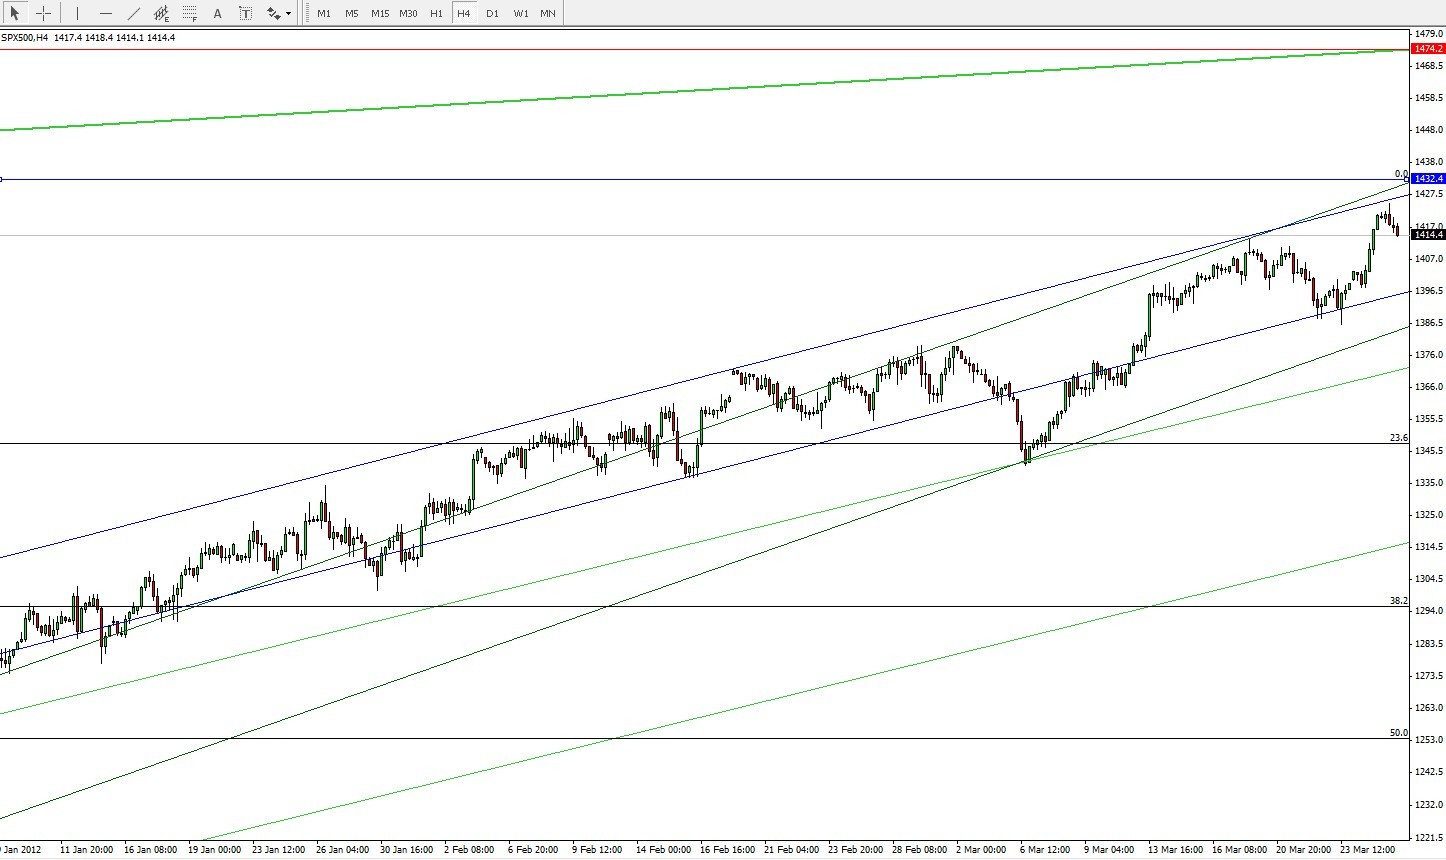
H4:
D1:

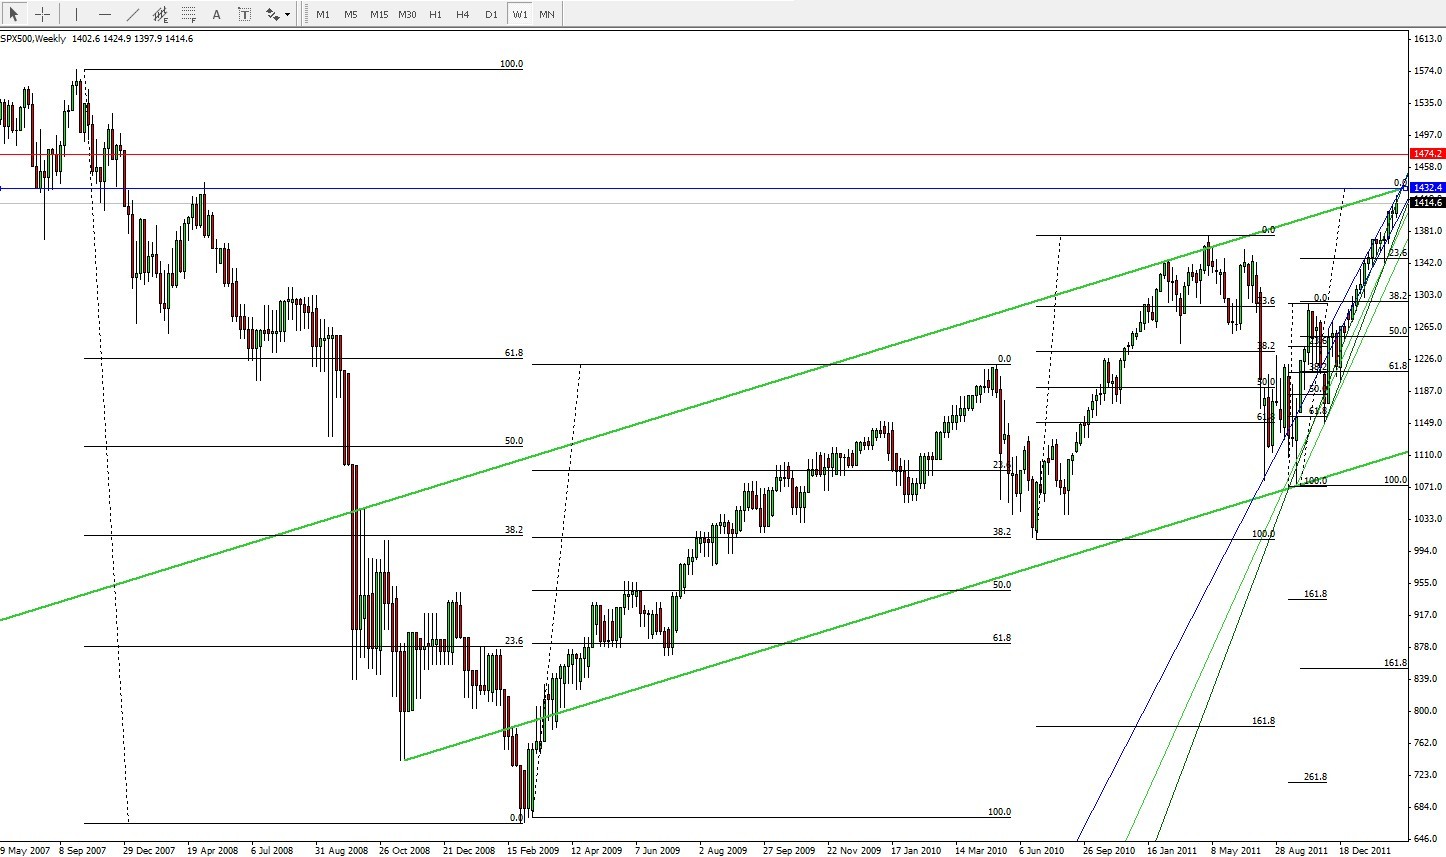
W1:
MN:

You can see always the same the lines on the top of the chart. 2 horizonals (blue and red) and the thick green upward trend line.
On D1 the green line cutted the blue line on the end of october and now the red one.
But on W1 the green line hasn't even cutted the green line an the red one is far away.
The actual value of the green line is above 1472 (M1), 1473 (M5), 1474 (M15), 1474 (M30), 1473 (H1), 1474 (H4), 1474(D1), BUT 1432 in W1!!
What can I do? Have I drawn anything wrong??
Thank you!
What can I do? Have I drawn anything wrong??
Thanks for your answer. I understand what you mean, but I don't think that this is the problem.
That problem appears in different Timeframes, so that the higher and the lower are OK but in one TF the line has a big difference.
- Free trading apps
- Over 8,000 signals for copying
- Economic news for exploring financial markets
You agree to website policy and terms of use
Hi,
I have drawn a trendline in my chart. Now when I click to other timeframes, I see that line at the same time on a different level (in max about 300 pips). In one the big timeframes (>H4) the line doesn't exist. I checked the properties and it is visible/allowed in each timeframe.
What is wrong? Is there a method to draw these lines exactly?