Weird behaviour of my charts
Note that your chart displays BID price; this is normal
Note that a buy occurs at ASK price which is BID + Spread; this is normal
Buy occurred 13 points above bar BID High, and indicates that the spread was at least 13 points, which is within a reasonable spread to me (but what bad timing to go long!)
Consider displaying ASK price on your charts, just to remind you of the difference of it from BID.
Thank You Brewman,
You are right, it is bid prices. Now what is wierd is I haven't noticed before. Maybe it is because spread was so small that the arrows were too close to the bar to be noticed. Anyway, good to know WYSIWYG is not always true :)
Sorry I'm back with more weird charts.
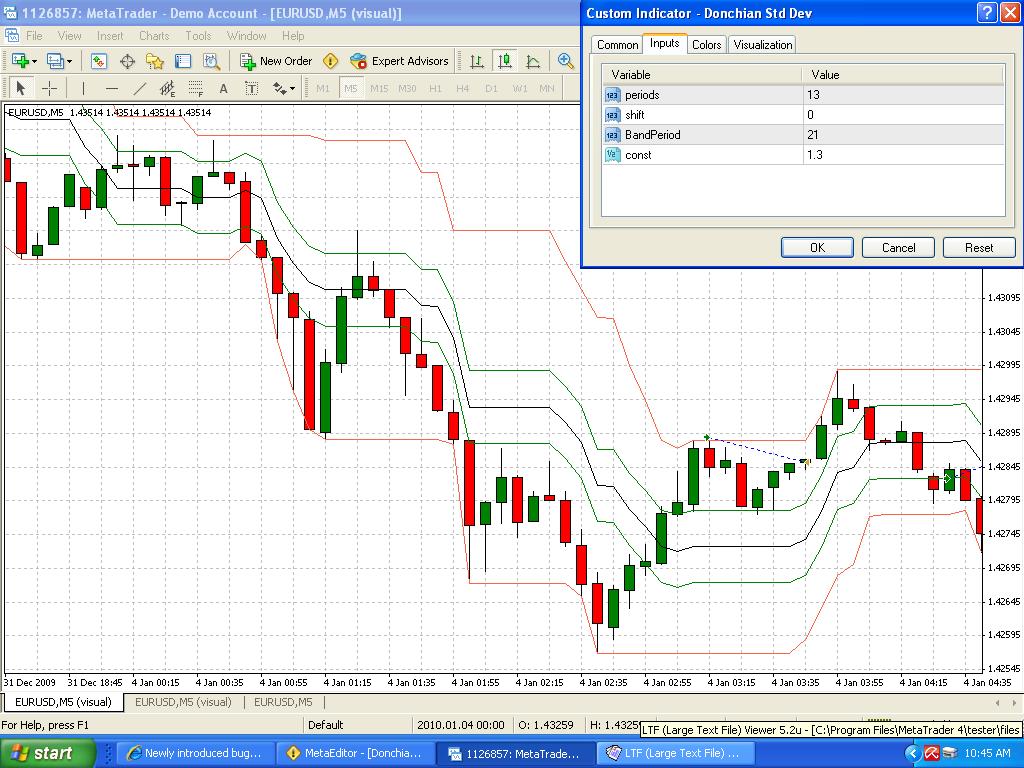
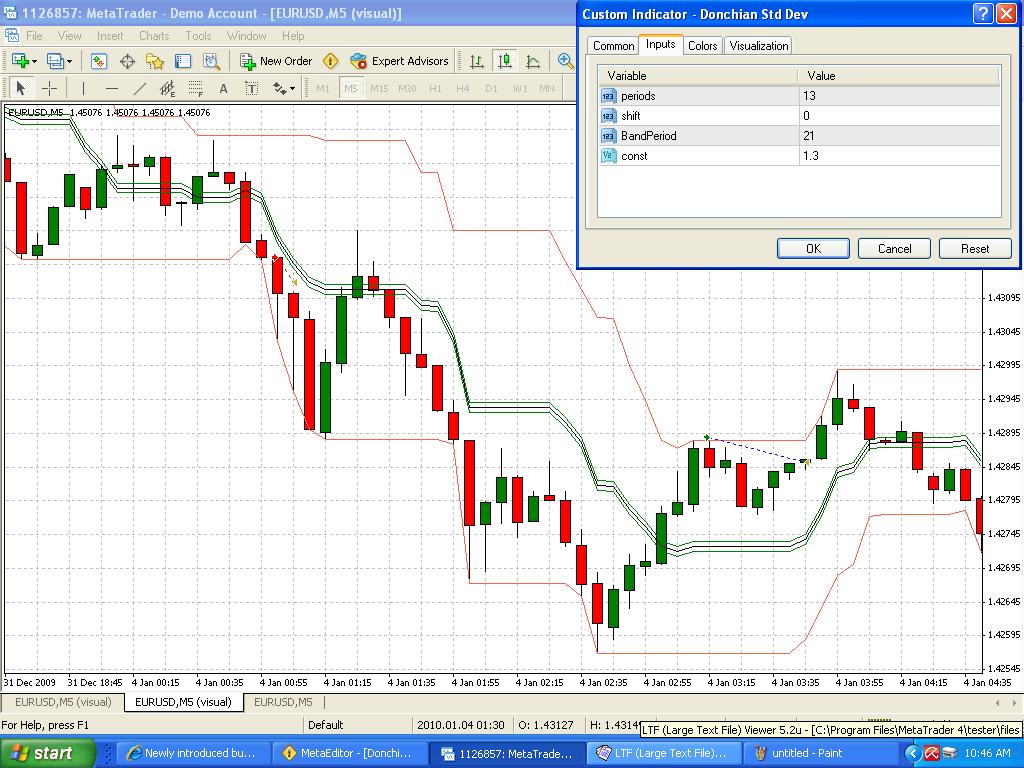
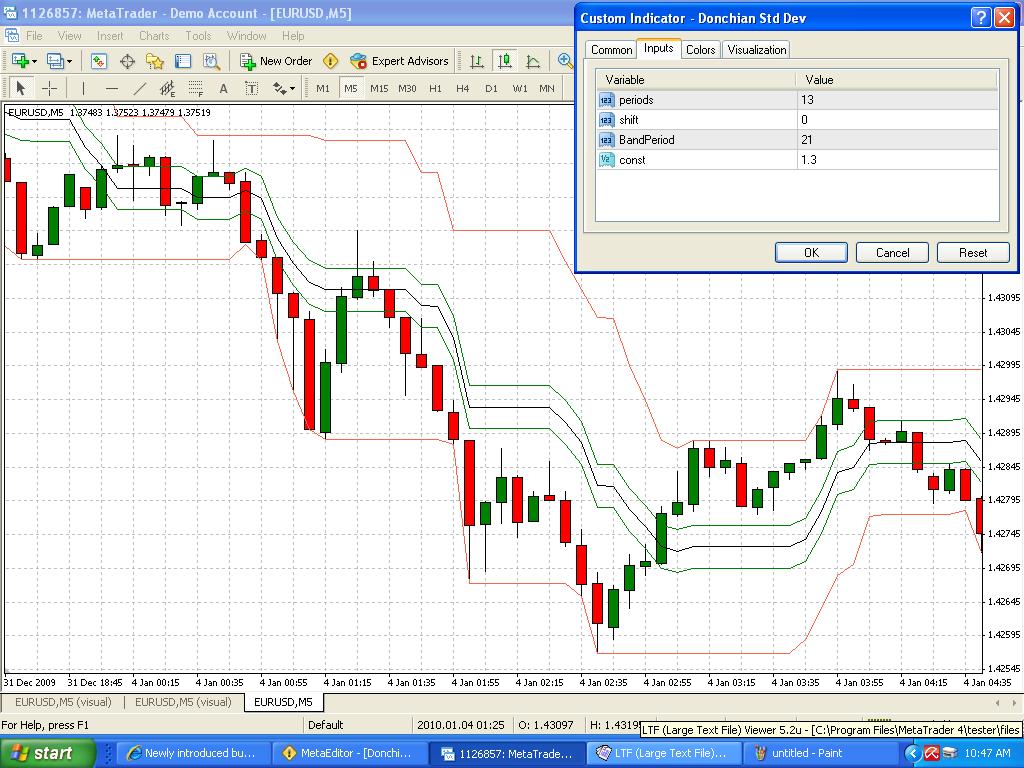
The chart display an indicator that is basically a Donchian Channel with two std dev above and below the center channel. The three charts have same settings for the indicator. The first chart is from a testing EA, the second chart is same EA just a change in entry rules, but indicator is the same as in the first chart. Finally third chart is from the templates where you save chart settings. The three should be identicals, right?.
Well, check the std dev lines, they are differents on the three charts.
How could this be related to Bid or Ask prices? This stuff is complicated enough and on top of that you can't trust what you are seeing. Anyone? Any thoughts?
If you post the indicator maybe we can help.
Sure,
//+------------------------------------------------------------------+
//|                                             Donchian Std Dev.mq4 |
//|
//|
//+------------------------------------------------------------------+
#property copyright ""
#property link      ""

//---- indicator settings
#property  indicator_chart_window
#property  indicator_buffers 5
#property  indicator_color1  Tomato
#property  indicator_color2  Tomato
#property  indicator_color3  Green
#property  indicator_color4  Green
#property  indicator_color5  Black
#property  indicator_width1  1
#property  indicator_width2  1

//---- indicator parameters
extern int periods=13;
extern int shift=0;
extern int BandPeriod = 21;
extern double const=  1.3;
//---- indicator buffers
double     upper[];
double     lower[];
double     upDev[];
double     loDev[];
double     center[];
//+------------------------------------------------------------------+
//| Custom indicator initialization function                         |
//+------------------------------------------------------------------+
int init()
  {
   IndicatorDigits(Digits);
//---- drawing settings
   SetIndexStyle(0,DRAW_LINE);
   SetIndexStyle(1,DRAW_LINE);
   SetIndexStyle(2,DRAW_LINE);
   SetIndexStyle(3,DRAW_LINE);
   SetIndexStyle(4,DRAW_LINE);

//---- indicator buffers mapping
   SetIndexBuffer(0,upper);
   SetIndexBuffer(1,lower);
   SetIndexBuffer(2,upDev);
   SetIndexBuffer(3,loDev);
   SetIndexBuffer(4,center);
//---- name for DataWindow and indicator subwindow label
   IndicatorShortName("Donchian Channel("+periods+")");
   SetIndexLabel(0,"Upper");
   SetIndexLabel(1,"Lower");

//---- initialization done
   return(0);
  }
//+------------------------------------------------------------------+
//| now do the dance.                           |
//+------------------------------------------------------------------+
int start()
  {
   int limit;
   double up,dn,ctr;
   int counted_bars=IndicatorCounted();
//---- last counted bar will be recounted
   if(counted_bars>0) counted_bars--;
   limit=Bars-counted_bars;

//---- calculate values
   for(int i=0; i<limit; i++)
   {
      up=iHigh(Symbol(),Period(),iHighest(Symbol(),Period(),MODE_HIGH,periods,i+shift));
      dn=iLow(Symbol(),Period(),iLowest(Symbol(),Period(),MODE_LOW,periods,i+shift));
      upper[i]=up;
      lower[i]=dn;
      ctr=up-MathAbs((up-dn)/2);
      center[i]=ctr;
   }
   for(i=0; i<limit; i++)
   {
      upDev[i]=center[i]+(const * StDev(center,BandPeriod));
      loDev[i]=center[i]-(const * StDev(center,BandPeriod));
   }

   return(0);
  }

double StDev(double& Data[], int Per)
{
  return(MathSqrt(Variance(Data,Per)));
}

double Variance(double& Data[], int Per)
{
  double sum, ssum;
  for (int i=0; i<Per; i++)
  {
    sum += Data[i];
    ssum += MathPow(Data[i],2);
  }
  return((ssum*Per - sum*sum)/(Per*(Per-1)));
}
//+------------------------------------------------------------------+
This is frustrating!!!!, I inserted some printouts in the code to verify the output of this indicator.
2010.09.17 - 02:00:00 - - - *******************New Bar************************************
2010.09.17 - 02:00:00 - - - upper1=1.30720 lower1=1.30681
2010.09.17 - 02:00:00 - - - open1=1.30741 high1=1.30801
2010.09.17 - 02:00:00 - - - low1=1.30730 close1=1.30776
2010.09.17 - 02:00:00 - - - upper2=1.30711 lower2=1.30672
2010.09.17 - 02:00:00 - - - open2=1.30752 high2=1.30757
2010.09.17 - 02:00:00 - - - low2=1.30734 close2=1.30741
2010.09.17 - 02:05:00 - - - *******************New Bar************************************
2010.09.17 - 02:05:00 - - - upper1=1.30733 lower1=1.30689
2010.09.17 - 02:05:00 - - - open1=1.30776 high1=1.30779
2010.09.17 - 02:05:00 - - - low1=1.30756 close1=1.30771
2010.09.17 - 02:05:00 - - - upper2=1.30722 lower2=1.30679
2010.09.17 - 02:05:00 - - - open2=1.30741 high2=1.30801
2010.09.17 - 02:05:00 - - - low2=1.30730 close2=1.30776
open1 is Open[1], open2 is Open[2] and so on. At 2:05 close2 is 1.30776 and it is close1 at 2:00, same with the Bar OHLC values. However, the indicator results are crazy. at 2:05 upper2 1.30722 should be upper1 at 2:00 but it shows 1.30720. The same happens all over the program output. Is this normal? if it is, How do you verify your custom indicators behave the way they should ? I'm lost here, this indicator doesn't re-draw itself, after the Bar 0 is closed, the indicator doesn't change, At least visually in the chart it remains without change from Bar1 and older. I like to understand how this thing works,so I go line by line and verify and re_verify actual chart values vs program output and this doesn't make any sense. What data the terminal is using to draw the indicator? Shouldn't the end of bar values for prices and indicators attached to the chart the same in the chart and in your printout?
- Free trading apps
- Over 8,000 signals for copying
- Economic news for exploring financial markets
You agree to website policy and terms of use
Hi guys, this happened before and I had to reboot the computer in order to get rid of this problem. Now, however, even after re-booting the problem remains. As you can see some of the orders are executed above the bar maximun price, they just hang in several pips over the Max. Any ideas how to solve this? I have Alpari(US) could this be their servers? Please if anybody in the US is using Alpari, could you please verify if you have the same problem? Thanks.
Order 46 opened at 1.44151, Data window shows high for this bar at 1.44138 a 13 point off.