A non-typical iCustom problem
So I code a new custom indicator that plots the same indicator on different timeframes in 1 single seperate window.
No big deal, right. But then I start to think about it and there is something wrong (either with my code or with the function, probably with my code):
The deal is: if you calculate an indicator on a H4 timeframe, you will have 4 times less observations than the calculation on an H1 timeframe,
but iCustom does not think of this: it simply takes the last n bars of the indicator calculated on that timeframe, and as a result, the values are just
behind one another, and do not correspond any more: if the indi only calculates on the close of the bar, the H4 reading should be repeated 3 times
so you have 4 times the same H4 observations for every H1 observation in that same time period (4 hours). Offcourse this is true for any timeframe.
Has anyone worked around this or do I have to reinvent the wheel here?
Some feedback (Rosh?) would be helpfull, thank you.
Here is my implementation of fixed time frame moving average.
it shows as staircase on smaller timeframes, regular way on the same timeframe and as a histo range on larger timeframes.
maybe it will help.
Hello,
Of course if we speak about MA as an exemple, the smooth line will be like stairs for results concerning higher time frame because the data shown is only changing every x bars. But what you are interesting in is to see the value of your indicator on a higher time frame no? and this data you see is correct (or revise your code) ? As far as those assertions are true, you shouldn't matter on the form in wich the data is presented so much (no matter if what you see is not a regular smooth line), the information you see is correct. You will get used to such form after a while using it. I use it like that and correcting it will alter the result I want to see so it is ok for me this way.
I have made a pic of what I meant:
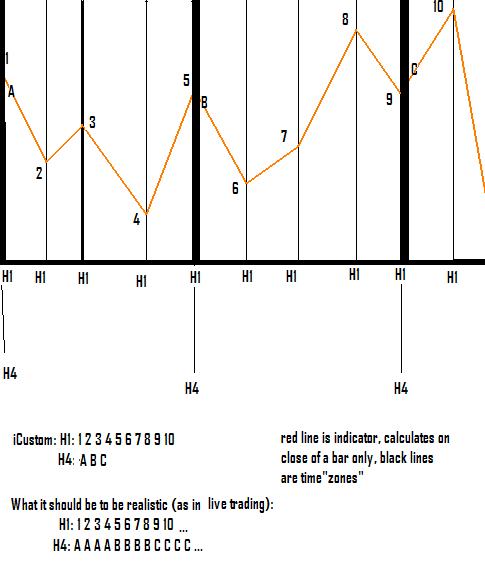
So you are right something is wrong with your result.
1. May be I could help if you show the piece of code where you use your iCustom() function and of course where are set all the parameters.
2. If you use only your indicator (not with your EA) and attach it to the H1 chart then you have the correct result (the realistic one), isn't it?
Yes I'm not using any EA's for now, and it is true, if you flip through the timeframes, they all show correct values, but referencing to them gives this problem:
here's my code:
#property indicator_separate_window
#property indicator_buffers 6
#property indicator_color1 Orange
#property indicator_color2 Red
#property indicator_color3 DarkBlue
#property indicator_color4 Pink
#property indicator_color5 Yellow
#property indicator_color6 Black
//---- input parameters
int barsToProcess=1000;
//---- buffers
double ExtMapBuffer1[];
double ExtMapBuffer2[];
double ExtMapBuffer3[];
double ExtMapBuffer4[];
double ExtMapBuffer5[];
double avg[];
//+------------------------------------------------------------------+
//| Custom indicator initialization function |
//+------------------------------------------------------------------+
int init()
{
//---- indicators
SetIndexStyle(0,DRAW_LINE,0,1);
SetIndexBuffer(0,ExtMapBuffer1);
SetIndexStyle(1,DRAW_LINE,0,1);
SetIndexBuffer(1,ExtMapBuffer2);
SetIndexStyle(2,DRAW_LINE,0,1);
SetIndexBuffer(2,ExtMapBuffer3);
SetIndexStyle(3,DRAW_LINE,0,1);
SetIndexBuffer(3,ExtMapBuffer4);
SetIndexStyle(4,DRAW_LINE,0,1);
SetIndexBuffer(4,ExtMapBuffer5);
SetIndexStyle(5,DRAW_LINE,0,5);
SetIndexBuffer(5,avg);
//----
return(0);
}
//+------------------------------------------------------------------+
//| Custom indicator deinitialization function |
//+------------------------------------------------------------------+
int deinit()
{
//----
//----
return(0);
}
//+------------------------------------------------------------------+
//| Custom indicator iteration function |
//+------------------------------------------------------------------+
int start()
{
int counted_bars=IndicatorCounted(),
limit;
if(counted_bars>0)
counted_bars--;
limit=Bars-counted_bars;
if(limit>barsToProcess)
limit=barsToProcess;
for(int i=0;i<limit;i++)
{
ExtMapBuffer1[i]=iCustom(NULL,PERIOD_M15,"reference",0,i);
ExtMapBuffer2[i]=iCustom(NULL,PERIOD_M30,"reference",0,i);
ExtMapBuffer3[i]=iCustom(NULL,PERIOD_H1,"reference",0,i);
ExtMapBuffer4[i]=iCustom(NULL,PERIOD_H4,"reference",0,i);
ExtMapBuffer5[i]=iCustom(NULL,PERIOD_D1,"reference",0,i);
// I called it reference here, the reference custom indicator does not have any external variables.
avg[i]=(ExtMapBuffer1[i]+ExtMapBuffer2[i]+ExtMapBuffer3[i]+ExtMapBuffer4[i]+ExtMapBuffer5[i])/5;
// So final goal would be to plot an average
}
return(0);
}
//+------------------------------------------------------------------+
Yes I'm not using any EA's for now, and it is true, if you flip through the timeframes, they all show correct values, but referencing to them gives this problem:
OK I think I understand, the solution is that you must modify your indicator "reference", lets say into "referenceH4" to work on H4 values, and then call it from where ever you want you will always have the values calculated on H4. (For that every parameter you use in "referenceH4" must refer to the H4 period.)
I think the only way out of this is by repeating the observations in the higher timeframes... it's not a high-tech solution :) but I can't think of anything else...
Do you have an idea of how to do that? Making the H4 buffer from H4_A, H4_B, H4_C, H4_D into H4_A, H4_A, H4_A, H4_A, H4_B, H4_B, H4_B, H4_B, H4_C, H4_C, H4_C, H4_C, H4_D, H4_D, H4_D, H4_D ?
The reason to want to do this is that you can see on your charts whether it's a good indicator or not, without having to run an empty EA backtest and attaching the indi to the chart.
- Free trading apps
- Over 8,000 signals for copying
- Economic news for exploring financial markets
You agree to website policy and terms of use
So I code a new custom indicator that plots the same indicator on different timeframes in 1 single seperate window.
No big deal, right. But then I start to think about it and there is something wrong (either with my code or with the function, probably with my code):
The deal is: if you calculate an indicator on a H4 timeframe, you will have 4 times less observations than the calculation on an H1 timeframe,
but iCustom does not think of this: it simply takes the last n bars of the indicator calculated on that timeframe, and as a result, the values are just
behind one another, and do not correspond any more: if the indi only calculates on the close of the bar, the H4 reading should be repeated 3 times
so you have 4 times the same H4 observations for every H1 observation in that same time period (4 hours). Offcourse this is true for any timeframe.
Has anyone worked around this or do I have to reinvent the wheel here?
Some feedback (Rosh?) would be helpfull, thank you.