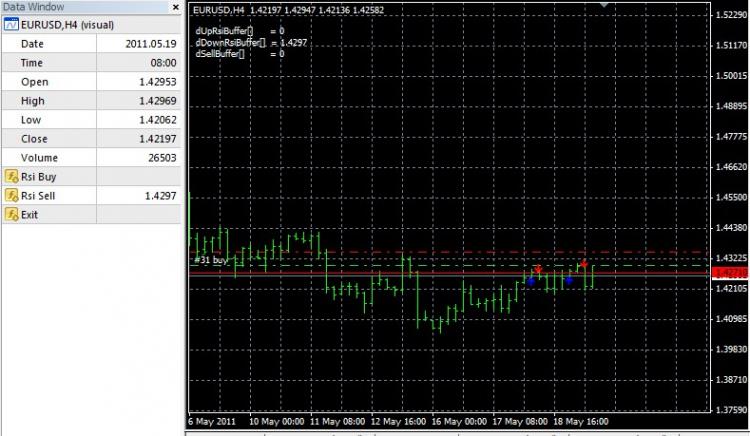
Need help with iCustom


Can anybody please help with iCustom to call an indicator. Anything wrong in my code? I allway get a value o.

this is my code using to call indicator

double RSI;  
    RSI = iCustom(NULL, PERIOD_H1, "FXA0 - RSI Crossing 50 plus ATR ver1[1].2", 0.15, 21, 21, 2, 1);
Comment("RSI :", RSI);
 
//+------------------------------------------------------------------+
//|                                       FXA0 - RSI Crossing 50.mq4 |
//|                           Copyright © 2007, Adam J. Richter M.S. |
//|                                                                  |
//+------------------------------------------------------------------+
#property copyright "Copyright © 2007, Adam J. Richter M.S."
//Version 1.2 fixed 8 digit double to 4 digits and set to remove all objects in deinitialize 
#property indicator_chart_window
#property indicator_buffers 3
#property indicator_color1 Blue
#property indicator_color2 Red
#property indicator_color3 Green
 
double dUpRsiBuffer[];
double dDownRsiBuffer[];
double dSellBuffer[];
 
extern double ATR_Percent = 0.15;  //This value sets the ATR Used, The ATR is 15%
extern double RSI_Period = 21;  //This value sets the RSI Period Used, The default is 21
extern double ATR_Period = 21;  //This value sets the ATR Period Used, The default is 21
 
int RowNum = 0;
int LastTrend = -1;
int UP_IND    = 1;
int DOWN_IND  = 0;
 
//+------------------------------------------------------------------+
//| Custom indicator initialization function                         |
//+------------------------------------------------------------------+
int init()
  {
//---- indicator buffers mapping  
    SetIndexBuffer(0,dUpRsiBuffer);
    SetIndexBuffer(1,dDownRsiBuffer);  
    SetIndexBuffer(2,dSellBuffer); 
//---- drawing settings
    SetIndexStyle(0,DRAW_ARROW);
    SetIndexArrow(0,233); //241 option for different arrow head
    SetIndexStyle(1,DRAW_ARROW);
    SetIndexArrow(1,234); //242 option for different arrow head
    SetIndexStyle(2,DRAW_ARROW);
    SetIndexArrow(2,252);  //251 x sign or 252 green check
    
//----
    SetIndexEmptyValue(0,0.0);
    SetIndexEmptyValue(1,0.0);
    SetIndexEmptyValue(2,0.0);
//---- name for DataWindow
    SetIndexLabel(0,"Rsi Buy");
    SetIndexLabel(1,"Rsi Sell");
    SetIndexLabel(2,"Exit");
//----
 
 
   return(0);
  }
//+------------------------------------------------------------------+
//| Custor indicator deinitialization function                       |
//+------------------------------------------------------------------+
int deinit()
  {
//---- 
      ObjectsDeleteAll();
//----
   return(0);
  }
  
  
void printmyline(double vala, int topbottom) //print target line
{
   vala = NormalizeDouble(vala,4);
   if(topbottom==1)//target
   {
      ObjectCreate("theentry " + vala,OBJ_HLINE,0,0,vala);
      ObjectSet("theentry " + vala,OBJPROP_COLOR, Blue);
      ObjectSetText("theentry " + vala,"Long Entry",13,"Arial",Black);
   }
   if(topbottom==2)//stop
   {
      ObjectCreate("thestop " + vala,OBJ_HLINE,0,0,vala);
      ObjectSet("thestop " + vala,OBJPROP_COLOR, Blue);
      ObjectSetText("thestop " + vala,"Long Stop",13,"Arial",Black);
   }
}
 
 
void printmylinedown(double vala, int topbottom) //print target line
{
   vala = NormalizeDouble(vala,4);
   if(topbottom==1)//target
   {
      ObjectCreate("theentry " + vala,OBJ_HLINE,0,0,vala);
      ObjectSet("theentry " + vala,OBJPROP_COLOR, Red);
      ObjectSetText("theentry " + vala,"Short Entry",13,"Arial",Black);
   }
   if(topbottom==2)//stop
   {
      ObjectCreate("thestop " + vala,OBJ_HLINE,0,0,vala);
      ObjectSet("thestop " + vala,OBJPROP_COLOR, Red);
      ObjectSetText("thestop " + vala,"Short Stop",13,"Arial",Black);
   }
}
   
void deletealllines()
{
   ObjectsDeleteAll();
}
 
//+------------------------------------------------------------------+
//| Custom indicator iteration function                              |
//+------------------------------------------------------------------+
int start()
  {
   int nBars,nCountedBars;
 
    nCountedBars=IndicatorCounted(); //ncountedbars 655
//---- check for possible errors
    if(nCountedBars<0) return(-1);
//---- last counted bar will be recounted    
    if(nCountedBars<=2)
       nBars=Bars-nCountedBars-3;
    
    if(nCountedBars>2)
      {
       nCountedBars--;
       nBars=Bars-nCountedBars-1; //number of bars in current chart-655-1
      }
double lastRSI60arrow = NULL; //if going long
double lastRSI40arrow = NULL; //if going short
int lastCloseLong=0;
int lastCloseShort=0;
 
   for (int ii=Bars; ii>0; ii--)
   {
 
      dUpRsiBuffer[ii]=0;
      dDownRsiBuffer[ii]=0;
 
      double myRSInow = iRSI(NULL,0,RSI_Period,PRICE_CLOSE,ii);
      double myRSI2 = iRSI(NULL,0,RSI_Period,PRICE_CLOSE,ii+1); //RSI One bar ago
      double myATR1 = iATR(NULL,PERIOD_D1,ATR_Period,ii);
 
      
      if (myRSInow>=50) //is going long
      {
         if(myRSInow>50 && myRSI2<50) //did it cross from below 50
         {
            deletealllines();
            dUpRsiBuffer[ii] = Low[ii] - 2 * MarketInfo(Symbol(),MODE_POINT);
            printmyline((iHigh(NULL,0,ii+1)+(myATR1*ATR_Percent)),1);
            printmyline((iHigh(NULL,0,ii+1)+(myATR1*ATR_Percent))-(0.30*myATR1),2);
            lastRSI60arrow=0;
            lastCloseLong=0;
         }
         if(myRSInow>=60 && myRSI2<60) //add to position at cross of 60, sometimes this can occur twice
         {
               if(lastRSI60arrow>=60) //don't draw another arrow
               {
               }
               if(lastRSI60arrow<=60) //draw another arrow for adding to position
               {
                  dUpRsiBuffer[ii] = Low[ii] - 2 * MarketInfo(Symbol(),MODE_POINT);
                  lastRSI60arrow = myRSInow;
               }
         }
         
         if(myRSInow<70 && myRSI2>=70) //sell first lot
         {
            if(lastCloseLong==0)
            {
               dSellBuffer[ii] = High[ii] + 2 * MarketInfo(Symbol(),MODE_POINT);
               lastCloseLong=1;
            }
         }
      }
      
      if(myRSInow<50)  //is going short
      {
         if(myRSInow<50 && myRSI2>50) //did it cross from above 50
         {
            deletealllines();
            dDownRsiBuffer[ii] = High[ii] + 2 * MarketInfo(Symbol(),MODE_POINT);
            printmylinedown((iLow(NULL,0,ii+1)-(myATR1*ATR_Percent)),1);
            printmylinedown((iLow(NULL,0,ii+1)-(myATR1*ATR_Percent))+(0.30*myATR1),2);
            lastCloseShort=0;
            lastRSI40arrow=myRSInow; //set out of area
         }
         if(myRSInow<40 && myRSI2>40)
         {
            if(lastRSI40arrow<=40) //don't draw another arrow
            {
               
            }
            if(lastRSI40arrow>=40) //draw another arrow to add to position
            {
               dDownRsiBuffer[ii] = High[ii] + 2 * MarketInfo(Symbol(),MODE_POINT);
               lastRSI40arrow=myRSInow; 
            }     
         }
         if(myRSInow>30 && myRSI2<30)
         {
            if(lastCloseShort==0)
            {
               dSellBuffer[ii] = Low[ii] - 4 * MarketInfo(Symbol(),MODE_POINT);
               lastCloseShort=1;
            }
         }
      } 


   }
}
 
myfuture2025:

Can anybody please help with iCustom to call an indicator. Anything wrong in my code? I allway get a value o.

this is my code using to call indicator


I have a similar problem where the EA returns ALWAYS a huge number like 2145672829290.0000000. BUT the custom indicator is plotted properly.
 
double RSI;  
    RSI = iCustom(NULL, PERIOD_H1, "FXA0 - RSI Crossing 50 plus ATR ver1[1].2", 0.15, 21, 21, 2, 1);
Comment("RSI :", RSI);
Document what the call is, and test for an error
#define UP_RSI      0
#define DOWN_RSI    1
#define SELL        2
#define RSIx50      "FXA0 - RSI Crossing 50 plus ATR ver1[1].2"
double ATR_Percent  = 0.15;
double RSI_Period   = 21;  
double ATR_Period   = 21;  
double RSI          = iCustom(NULL, PERIOD_H1, RSIx50, 
                              ATR_Percent, RSI_Period, ATR_Period, SELL, 1);
Comment("RSI :", RSI," Error=",GetLastError());
 
diver60:
I have a similar problem where the EA returns ALWAYS a huge number like 2145672829290.0000000. BUT the custom indicator is plotted properly.

Unless an indicator uses SetIndexEmptyValue, the default for empty values (do not paint) is EMPTY_VALUE

EMPTY_VALUE 0x7FFFFFFF Default custom indicator empty value. 0x7FFFFFFF = 2147483647

Are you looking at the right buffer. Perhaps it is a multi-color indicator

 
myfuture2025:

Can anybody please help with iCustom to call an indicator. Anything wrong in my code? I allway get a value o.

this is my code using to call indicator

Hi myfuture,

Your indicator looks like it is producing the values ok.

You may want to try getting the current values and not the past values. In your example you have "1" as the past bar. Try "0" for the current bar.

Check your Data Window and place your mouse cursor on one of the red/blue arrows to confirm the data is there.

Also it helps to add more Print statements and Comments to track the values as they change.

Hope this helps,

Robert


diver60:

I have a similar problem where the EA returns ALWAYS a huge number like 2145672829290.0000000. BUT the custom indicator is plotted properly.
Hi Diver60,

WHRoeder explained the "EMPTY_BUFFER" for you and here is a way to use it.

Some indicators can produce signals at every tick.

Other indicators, like the RSI/ATR in the above post, only produce signals when certain conditions are met.

When the conditions are NOT met, the buffer shows "EMPTY_BUFFER" or the number "2147483647", which means the previous values were reset back to zero.

You still can use this "EMPTY_BUFFER" information.

First turn the ""EMPTY_BUFFER" number "2147483647" value into zero (0)...

double Value1;

if (Value1 = 2147483647) Value1 = 0);

Then use it in your trade conditions:

if (Value1 = 0) Do Nothing;
if (Value1 > 0) Do Something; // Or... if Value1 = a specific value you are looking for (price, etc.), then do something.

Use the Print and Comments to show you the values, and look at the Data Window also.

If your indicator is plotting correctly, chances are the values are working fine, and you may have to slow down your testing to see them in the Data Window. That's why Print and Comments are so helpful.


Hope this helps,
Robert
Reason: