How Brokers Process Data history
You are missing trading opportunities:
- Free trading apps
- Over 8,000 signals for copying
- Economic news for exploring financial markets
Registration
Log in
You agree to website policy and terms of use
If you do not have an account, please register
1. Downloaded latest History Data from Alpari History Data Center.
2. used Period_Converter script to convert M1 data to remaining timeframes for each Broker.
3. Date Range: 2006.05.17 - 2006.11.24.
4. H1 timeframe & Deposit $3,000.
5. Settings for Backtest
TakeProfit=100
Lots=0.1
TrailingStop=60
MACDOpenLevel=4
MACDCloseLevel=4
MATrendPeriod=25
6. Results.
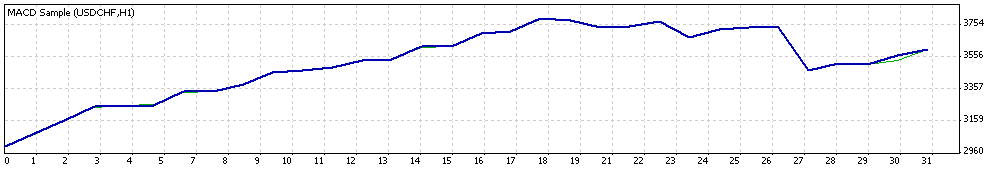
FXDD Results
Profit- $973.18, MD 4.79%, Profit Trades 28, Loss Trades 5.
FXDD Chart
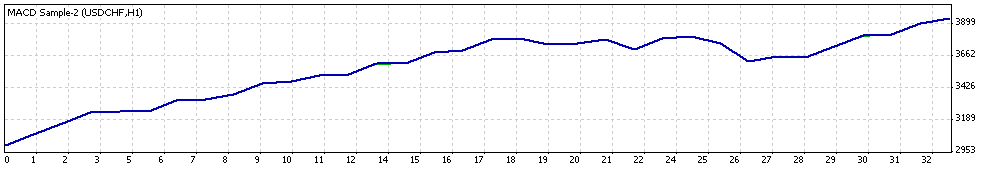
IBFX Results
Profit- $601.44, MD 8.44%, Profit Trades 25, Loss Trades 6.
IBFX Chart
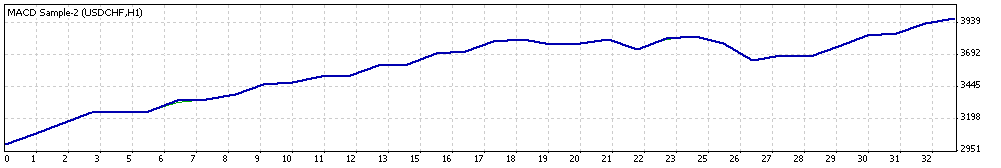
FN Results
Profit- $937.72, MD 4.76%, Profit Trades 28, Loss Trades 5.
FN Chart
Summary:
FXDD and FN results are virtually the same. IBFX results were off (down) by over 30%. I don't know which Broker's backtest reuslts are closer to forward or live results, but these results should make a concern on which Broker is used when using the MT4 Strategy Tester in EA development and confrimation. Side by Side Demo and LIve results are needed to clarify which Broker's backtest results.
Wackena