

Technical analysis, assessment and anticipation tool
Our team of analysts uses technical and chartist analysis to draw an opinion and make decisions. The preferred chartist elements are:
Chartist trend patterns (channels, trend lines)
Consolidation/Reversal patterns (triangles, rectangles, wedges, double-top/bottom,... )
Supports and resistances
Divergence on indicators
Japanese candlesticks
Gaps
Moving averages
Bollinger Bands
These elements enable the analyst to apply the following intellectual process:
Identification of important levels and trends (bullish, bearish, range)
Determination of direction (confirmation of the trend by indicators or reversal at the identified levels)
Pivot point
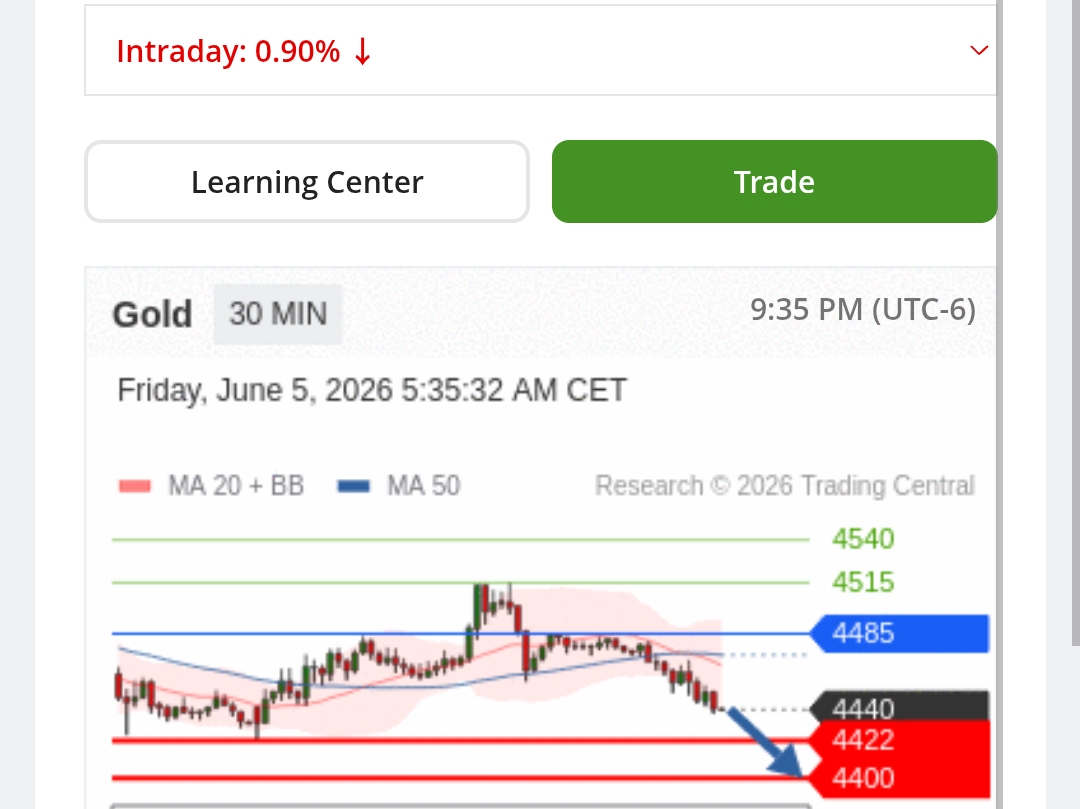
The pivot point is a key technical level where we would turn bullish from bearish, or bearish from bullish. This is an important area where buyers and sellers face off and which will determine the next move to expect. It is therefore very useful for investors because it determines whether the current trend will continue or reverse.
By "pivot point" we at TRADING CENTRAL mean a pivotal point, a key technical level, analogous to a trading stop loss level.
Actually, there is no one-way for calculating pivot points. A pivot point is always a key technical level - either intraday or longer term.
We favour the use of Fibonacci levels (either via a retracement or a projection), along with classical technical levels (gaps, horizontal lines, patterns’ area, etc.). The choice will depend on the current market configuration.
Very important: Our pivot point levels (stop loss) must be managed at the close of a bar (30-minute, daily or weekly, depending on timeframe’s analysis). This means that the price may temporarily cross the stop loss level without invalidating the preferred scenario.
Risk/reward
In technical analysis, risk/reward is an indicator that measures the ratio between the risk taken on a trade and the expected potential gain.
Risk: the maximum possible loss if the trade fails (the distance between the entry point and the stop-loss or pivot point).
Reward: the potential gain if the trade succeeds (distance between the entry point and the price target).
We offer trades with a risk/reward ratio of at least 1:1.7 calculated by using the second target. If the return is not sufficient, we suggest an entry zone that is better suited to opening a position (Long or Short).
Investment Horizon
The investment horizons proposed by Trading Central depend on the time scale of the chart used (30 minutes, daily or weekly).
We estimate that our expectations at a given moment “T” and on a given time scale are the most consistent up to about 20 periods. Beyond this, for a longer forecast, we need to complete our analysis with a chart on a larger time scale.
Thus, for an intraday chart (30 minutes), we think that the most appropriate anticipation is up to about 20 bars, which corresponds to a maximum of 10 hours. For a daily chart we think that the most appropriate anticipation is up to about 20 days (20 bars).