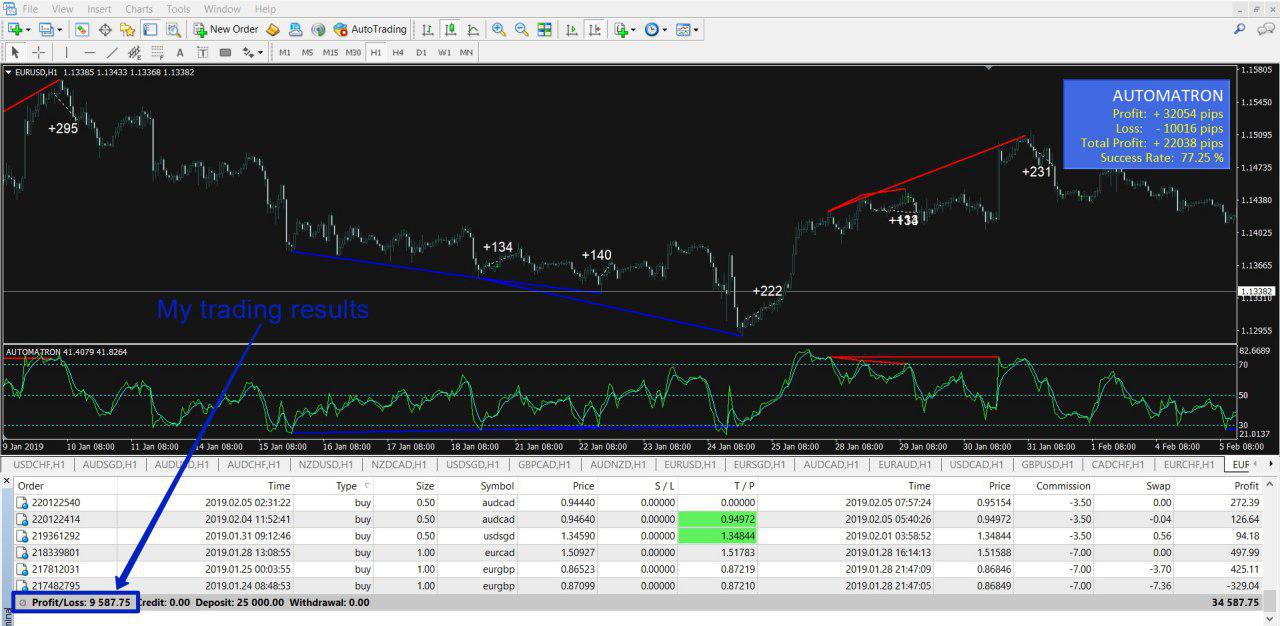
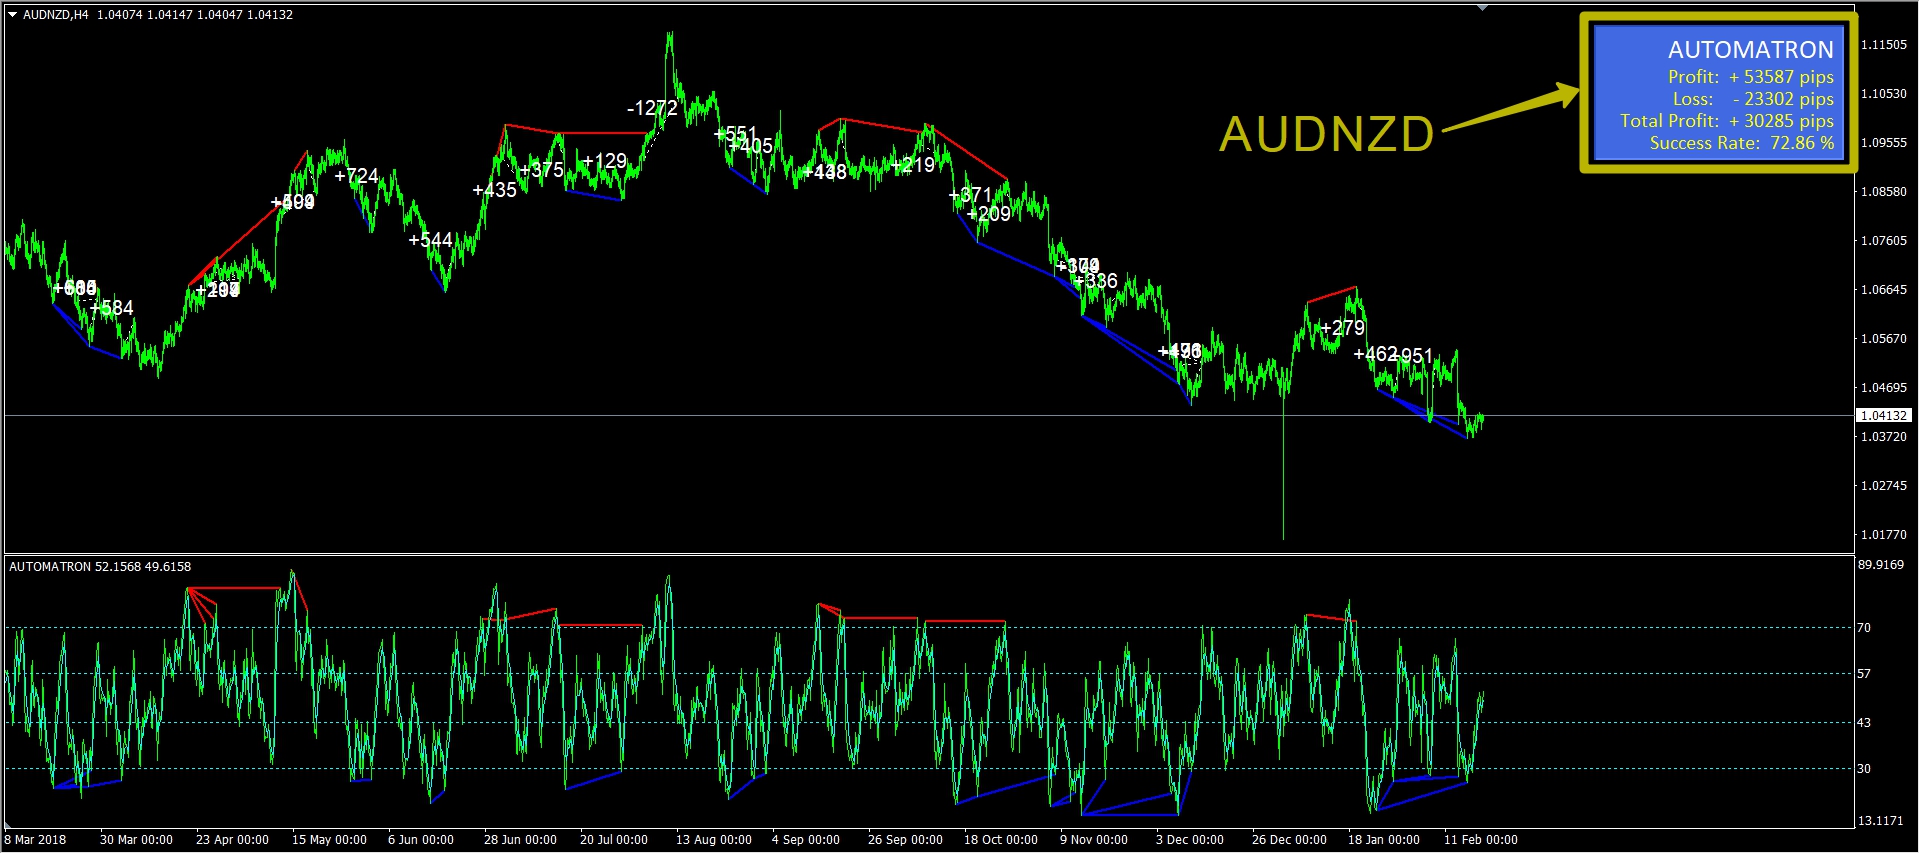
Features:
- independently analyzes the market;
- independently determines the best moments for making deals and closing them;
- gives alerts, PUSH-notifications and emails about the need of opening and closing deals;
- independently calculates the statistics of the implementation of trading signals.
Looking for effective addition to any trading strategy?
VD BARS - paints bars chart of quotes in accordance with the dynamics of the Relative Strength Index.
Parameters for manual adjustment of the indicator:
- RSI_Period - period of the Relative Strength Index indicator;
- RSI_Price - method of construction of indicator;
- Overbought - level of overbought;
- Oversold - oversold level;
- BarWidth - the thickness of the visualization object on the bars chart;
- CandleWidth - the thickness of the visualization object on the candles chart.
Looking 4 effective addition to any trading strategy?
VD BARS - paints bars chart of quotes in accordance with the dynamics of the Relative Strength Index.
Parameters for manual adjustment of the indicator:
- RSI_Period - period of the Relative Strength Index indicator;
- RSI_Price - method of construction of indicator;
- Overbought - level of overbought;
- Oversold - oversold level;
- BarWidth - the thickness of the visualization object on the bars chart;
- CandleWidth - the thickness of the visualization object on the candles chart.
is an indicator that paints bars (candles) chart of quotes in accordance with the dynamics of the Relative Strength Index. Thanks to this indicator, you can quite accurately determine the stage of the market – in the stage of growth or in the stage of decline. In other words, it is much better to analyse the market. Also, this indicator can be an effective addition to any trading strategy. Parameters for manual adjustment of the indicator: RSI_Period - period of the Relative Strength Index
* 32 set-files for trading currency pairs (H1 and H4 time frames) included FOR FREE!
Features:
- independently analyzes the market;
- independently determines the best moments for making deals and closing them;
- gives alerts, PUSH-notifications and emails about the need of opening and closing deals;
- independently calculates the statistics of the implementation of trading signals.