Young Ho Seo / Profile
- Information
|
10+ years
experience
|
62
products
|
1173
demo versions
|
|
4
jobs
|
0
signals
|
0
subscribers
|
Harmonic Pattern Indicator - Repainting + Japanese Candlestick Pattern Scanner + Automatic Channel + Many more
https://www.mql5.com/en/market/product/4488
https://www.mql5.com/en/market/product/4475
https://algotrading-investment.com/portfolio-item/harmonic-pattern-plus/
Non Repainting and Non Lagging Harmonic Pattern Indicator – Customizable Harmonic + Japanese Candlestic Pattern Scanner + Advanced Channel + Many more
https://www.mql5.com/en/market/product/41993
https://www.mql5.com/en/market/product/41992
https://algotrading-investment.com/portfolio-item/profitable-pattern-scanner/
Supply Demand Indicator – Multiple Timeframe Scanning Added + Non Repainting + Professional Indicator
https://www.mql5.com/en/market/product/40076
https://www.mql5.com/en/market/product/40075
https://algotrading-investment.com/portfolio-item/ace-supply-demand-zone/
Momentum Indicator – Path to Volume Spread Analysis
https://www.mql5.com/en/market/product/30641
https://www.mql5.com/en/market/product/30621
https://algotrading-investment.com/portfolio-item/excessive-momentum-indicator/
Elliott Wave Indicator for the Power User
https://www.mql5.com/en/market/product/16479
https://www.mql5.com/en/market/product/16472
https://algotrading-investment.com/portfolio-item/elliott-wave-trend/
Forex Prediction - Turn Support and Resistance to the Advanced Strategy
https://www.mql5.com/en/market/product/49170
https://www.mql5.com/en/market/product/49169
https://algotrading-investment.com/portfolio-item/fractal-pattern-scanner/
MetaTrader 4 and MetaTrader 5 Product Page: https://www.mql5.com/en/users/financeengineer/seller#products
Free Forex Prediction with Fibonacci Analysis: https://algotrading-investment.com/2020/10/23/forex-prediction-with-fibonacci-analysis/
Free Harmonic Pattern Signal: https://algotrading-investment.com/2020/12/17/harmonic-pattern-signal-for-forex-market/
============================================================================================================================
Here are the trading education books. We recommend reading these books if you are a trader or investor in Forex and Stock market. In the list below, we put the easy to read book on top. Try to read the easy to read book first and try to read the harder book later to improve your trading and investment.
First Link = amazon.com, Second Link = Google Play Books, Third Link = algotrading-investment.com, Fourth Link = Google Books
Technical Analysis in Forex and Stock Market (Supply Demand Analysis and Support Resistance)
https://www.amazon.com/dp/B09L55ZK4Z
https://play.google.com/store/books/details?id=pHlMEAAAQBAJ
https://algotrading-investment.com/portfolio-item/technical-analysis-in-forex-and-stock-market/
https://books.google.co.kr/books/about?id=pHlMEAAAQBAJ
Science Of Support, Resistance, Fibonacci Analysis, Harmonic Pattern, Elliott Wave and X3 Chart Pattern (In Forex and Stock Market Trading)
https://www.amazon.com/dp/B0993WZGZD
https://play.google.com/store/books/details?id=MME3EAAAQBAJ
https://algotrading-investment.com/portfolio-item/science-of-support-resistance-fibonacci-analysis-harmonic-pattern/
https://books.google.co.kr/books/about?id=MME3EAAAQBAJ
Profitable Chart Patterns in Forex and Stock Market (Fibonacci Analysis, Harmonic Pattern, Elliott Wave, and X3 Chart Pattern)
https://www.amazon.com/dp/B0B2KZH87K
https://play.google.com/store/books/details?id=7KrQDwAAQBAJ
https://algotrading-investment.com/portfolio-item/profitable-chart-patterns-in-forex-and-stock-market/
https://books.google.com/books/about?id=7KrQDwAAQBAJ
Guide to Precision Harmonic Pattern Trading (Mastering Turning Point Strategy for Financial Trading)
https://www.amazon.com/dp/B01MRI5LY6
https://play.google.com/store/books/details?id=8SbMDwAAQBAJ
http://algotrading-investment.com/portfolio-item/guide-precision-harmonic-pattern-trading/
https://books.google.com/books/about?id=8SbMDwAAQBAJ
Scientific Guide to Price Action and Pattern Trading (Wisdom of Trend, Cycle, and Fractal Wave)
https://www.amazon.com/dp/B073T3ZMBR
https://play.google.com/store/books/details?id=5prUDwAAQBAJ
https://algotrading-investment.com/portfolio-item/scientific-guide-to-price-action-and-pattern-trading/
https://books.google.com/books/about?id=5prUDwAAQBAJ
Predicting Forex and Stock Market with Fractal Pattern: Science of Price and Time
https://www.amazon.com/dp/B086YKM8BW
https://play.google.com/store/books/details?id=VJjiDwAAQBAJ
https://algotrading-investment.com/portfolio-item/predicting-forex-and-stock-market-with-fractal-pattern/
https://books.google.com/books/about?id=VJjiDwAAQBAJ
Trading Education Book 1 in Korean (Apple, Google Play Book, Google Book, Scribd, Kobo)
https://books.apple.com/us/book/id1565534211
https://play.google.com/store/books/details?id=HTgqEAAAQBAJ
https://books.google.co.kr/books/about?id=HTgqEAAAQBAJ
https://www.scribd.com/book/505583892
https://www.kobo.com/ww/en/ebook/8J-Eg58EDzKwlpUmADdp2g
Trading Education Book 2 in Korean (Apple, Google Play Book, Google Book, Scribd, Kobo)
https://books.apple.com/us/book/id1597112108
https://play.google.com/store/books/details?id=shRQEAAAQBAJ
https://books.google.co.kr/books/about?id=shRQEAAAQBAJ
https://www.scribd.com/book/542068528
https://www.kobo.com/ww/en/ebook/X8SmJdYCtDasOfQ1LQpCtg
About Young Ho Seo
Young Ho Seo is an Engineer, Financial Trader, and Quantitative Developer, working on Trading Science and Investment Engineering since 2011. He is the creator of many technical indicators, price patterns and trading strategies used in the financial market. He is also teaching the trading practice on how to use the Supply Demand Analysis, Support, Resistance, Trend line, Fibonacci Analysis, Harmonic Pattern, Elliott Wave Theory, Chart Patterns, and Probability for Forex and Stock Market. His works include developing scientific trading principle and mathematical algorithm in the work of Benjamin Graham, Everette S. Gardner, Benoit Mandelbrot, Ralph Nelson Elliott, Harold M. Gartley, Richard Shabacker, William Delbert Gann, Richard Wyckoff and Richard Dennis. You can find his dedicated works on www.algotrading-investment.com . His life mission is to connect financial traders and scientific community for better understanding of this world and crowd behaviour in the financial market. He wrote many books and articles, which are helpful for understanding the technology and application behind technical analysis, statistics, time series forecasting, fractal science, econometrics, and artificial intelligence in the financial market.
If you are interested in our software and training, just visit our main website: www.algotrading-investment.com
Young Ho Seo
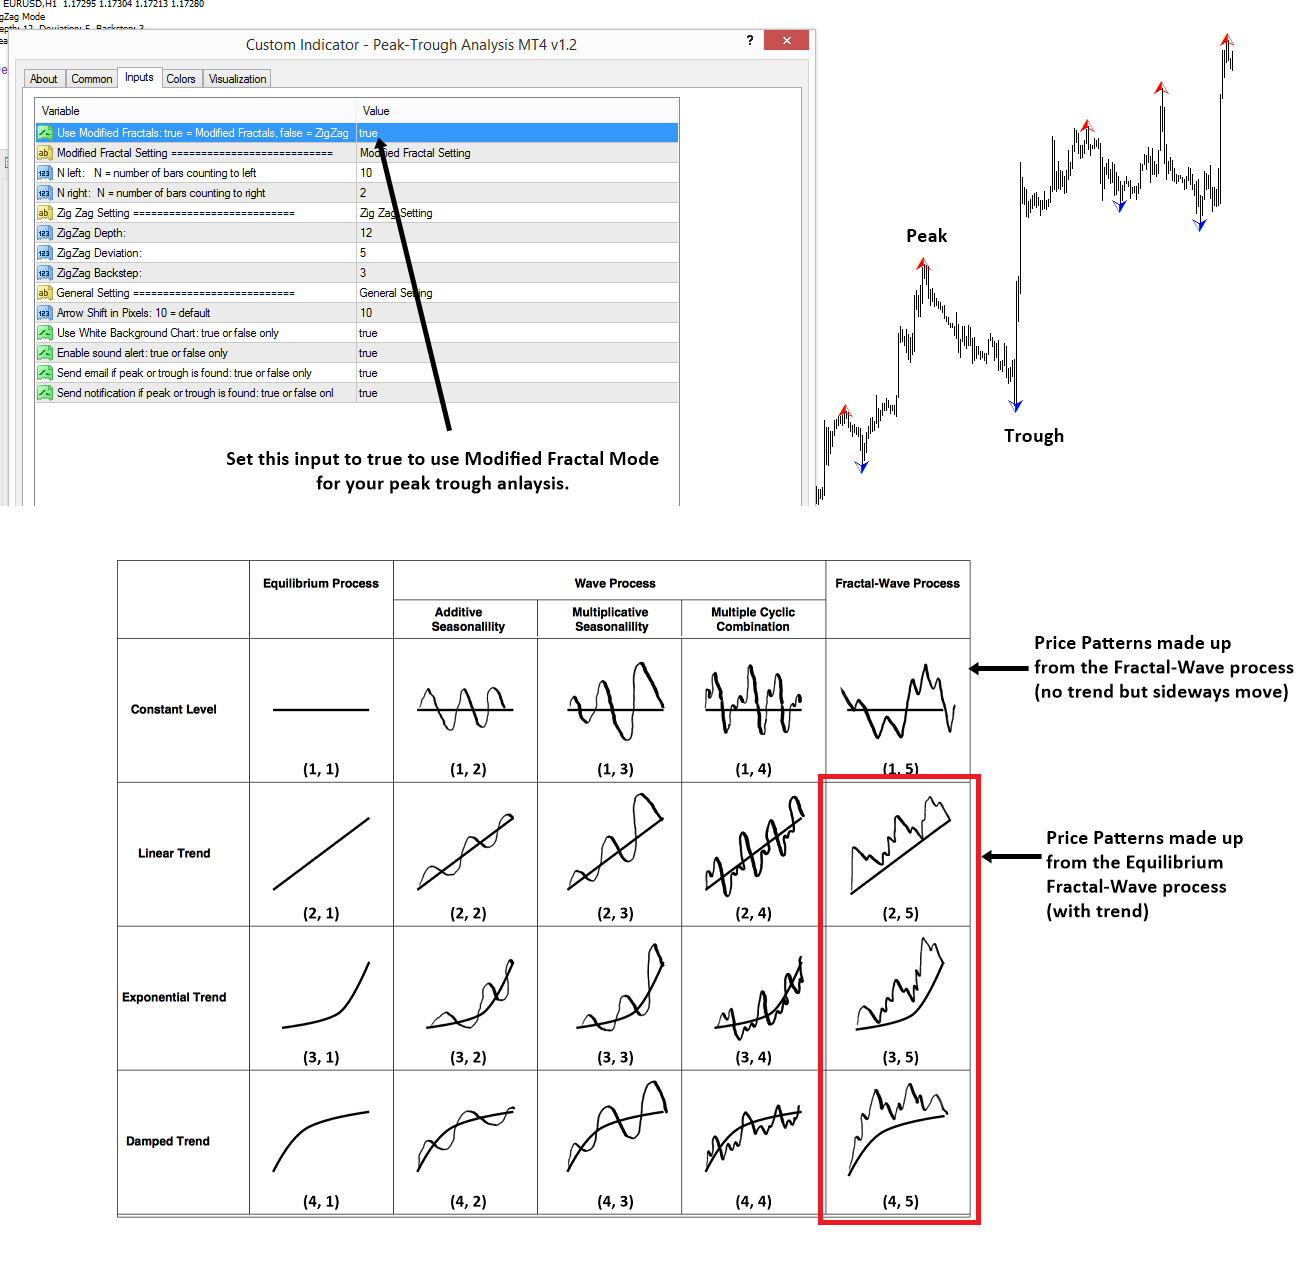
How to use the Modified Fractal Mode for your peak trough analysis.
There is always balance (trade off) in this world. Do not get frustrated with this because it is the universal law. Simply nothing is perfect in this world.
Assuming that you understood this principle, here are some information on how to use the peak trough analysis in two different mode.
Zigzag mode of the peak trough analysis can help you to detect the peak and trough without lagging but the fast detection will trade off with redrawing or repainting signals. Many traders know this already but I am just repeating this for someone new.
Instead, you can use the modified Fractal mode of the peak trough analysis if you do not like the repainting signal. The modified Fractal mode of the peak trough analysis will never redraw or repaint.
However, the modified fractal mode will detect peak and trough slow and it will lag. Also the modified fractal mode will show you more peak and trough for your analysis. Therefore, you have to filter many insignificant peaks and troughs by yourself. In a way, Zig Zag mode is convenient.
Which one you want to use for the peak-trough analysis is entirely up to you. It is really depending on your trading style.
The peak trough analysis is the ultimate tool that you can study the financial market with dominating price patterns of equilibrium Fractal Wave process. You can do many things in terms of pattern detection. See the screenshot to understand what is the equilibrium Fractal wave process.
Equilibrium fractal wave process is literally the frequently occurring price patterns in the financial markets last 85 years for some very reason. If you like to dig deeper on how to trade with these price patterns beyond the simple peak trough analysis, you can read this book:
“Price Action and Pattern Trading Course: Theory to Practice with over 85 years of Evidence” (Link on Amazon: https://www.amazon.com/dp/B073T3ZMBR)
Currently this is only book covering the full details about the equilibrium fractal wave process. It also covers the practical trading strategy on how to trade with these frequently repeating price patterns in the financial markets.
This is not an adverts for the book. If you do not want to read, it is absolutely fine. We do not make money out of selling the book. Peak Trough Analysis tool is also free tool too. Please understand that writing book with over 240 pages is really not easy. We only point this out just in case someone want to know some reference source to fully understand what are the equilibrium fractal wave process and the price patterns in the financial markets and how we trade with these patterns. Of course, if you have the solid understanding on how the financial market move, then you can trade better too. That is the whole idea behind this book.
https://www.mql5.com/en/market/product/23797
https://www.mql5.com/en/market/product/22420
http://algotrading-investment.com/portfolio-item/peak-trough-analysis-tool/

Young Ho Seo
Sideways Market Analyser Trading Tips
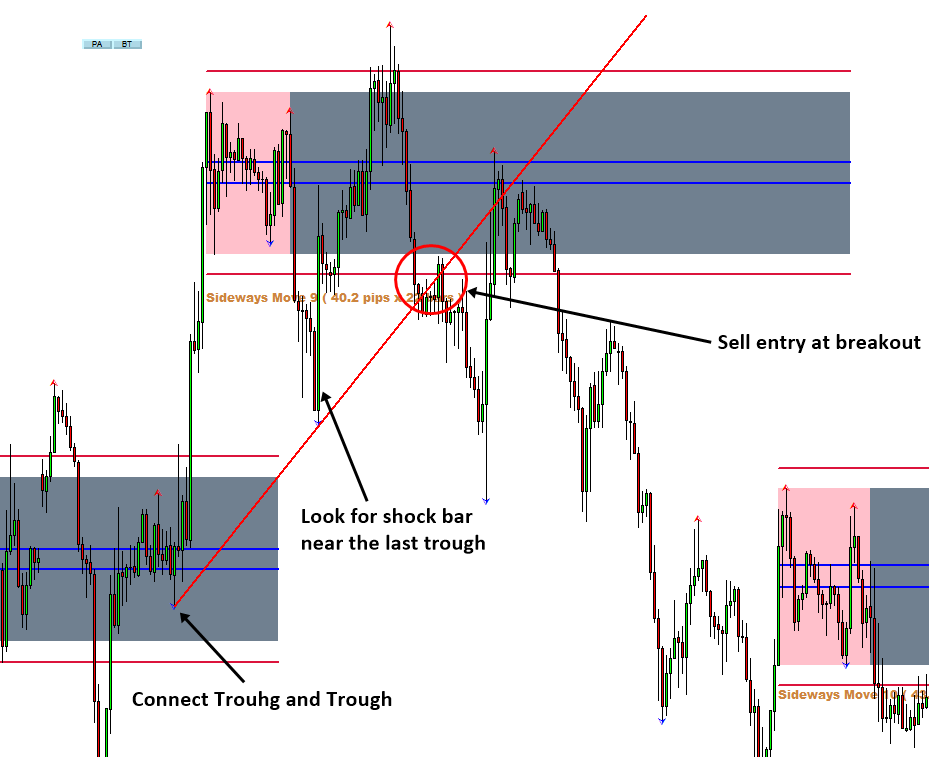
Sideways Market Analyser detect the sideways movement in rectangle form. When it detect, usually the opportunity for breakout can be materialized. Rather than just using the box as the breakout level, it is much preferred to look for short term support and resistance around the box as we have shown in our screenshot.
One might have difficulty to detect the short term support and resistance. In that case, you can apply the peak trough analysis for clear identification of such support and resistance around the box. When you do that you should aim for your entry near the box. For example for sell, your entry should be placed around the bottom of the box. For buy, your entry should be placed around the top of the box. We can say that the short term support and resistance are sort of the double confirmation of the entry.
The peak-trough analysis (Free in our site) is powerful technique which you can combine with your trading. Here we offer the screenshots for good trading setup on our Sideways Market Analyser with the Peak-Trough Analysis.
Our Peak-trough analysis tool is free of charge. You can download it from our website at no cost.
http://algotrading-investment.com/portfolio-item/peak-trough-analysis-tool/
To visit our website, follow the links below:
https://www.mql5.com/en/market/product/5314
https://www.mql5.com/en/market/product/5234
http://algotrading-investment.com/portfolio-item/sideways-market-statistical-analyzer/

Young Ho Seo
Website Moderator Position
For the Trade Invest Smart website (www.tradeinvestsmart.com), we are looking for a site moderator to join our team. Even if you have a full time or part time job, you can still apply for this role.
We are only looking for the basic requirements for this role because the passion is the most important for any job. For example as long as you are familiar with these:
•Love trading and investment
•Love internet and social network
•Love writing and discussing on internet
Contact us for this role for more details. We will discuss on what our potential road maps look like and what you are getting at from this venture: admin@tradeinvestsmart.com
Young Ho Seo
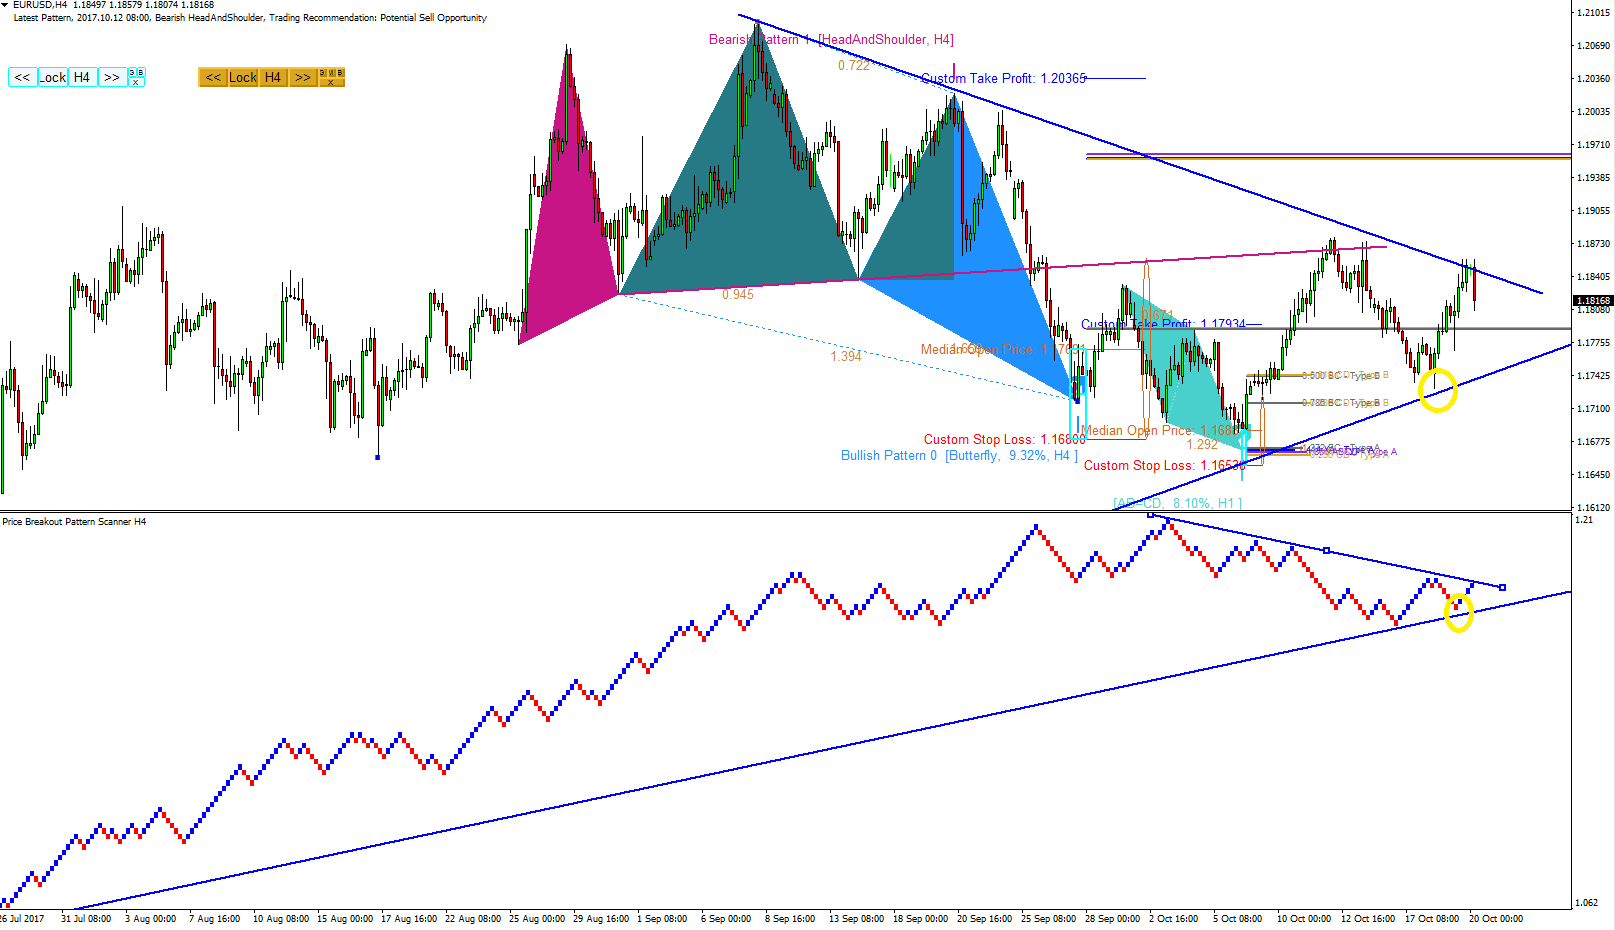
EURUSD have made a beautiful turn at the bottom of support line we have marked up earlier.
Currently it is running around 100 pips to the other side of the patterns marked up in our previous analysis.
For your information we have migrated our blog to www.tradeinvestsmart.com
The reason is simply because we want to provide more comprehensive service for you.
Feel free to visit our blog site: www.tradeinvestsmart.com
We will add ever so exciting free features in this site.

Young Ho Seo

Trade Invest Smart Site is fully open now.
The sister site of Algotrading-investment.com is fully open now. In the Trade Invest smart Website, you have a full access to the following feature for free of chages.
•Wring your own blog
•Writing any question to forum
•Post a freelance project to develop trading system and trading robots
•Find a freelance work to earn money
We hope you like our Trade Invest Smart site and get the best out of the full free contents.
http://tradeinvestsmart.com
http://algotrading-investment.com

Young Ho Seo
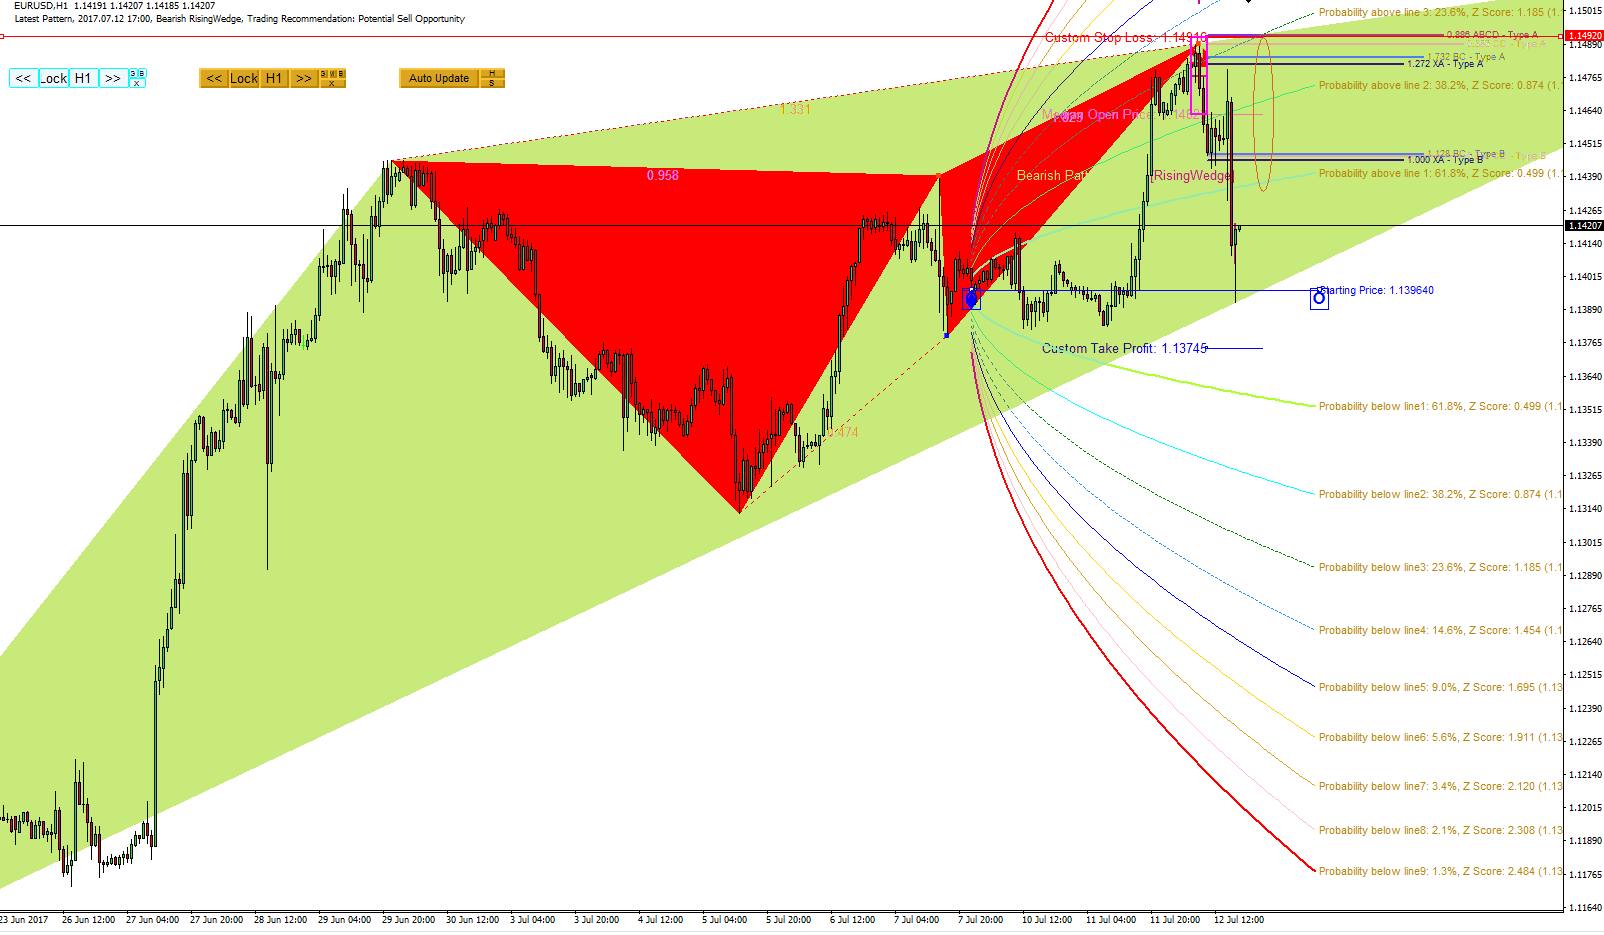
Shifting Our Blog to more Professional Website
We are preparing to shit our blog site for more professional site.
We are currently preparing for it.
You will see our new blog open soon.
http://algotrading-investment.com/
https://www.mql5.com/en/users/financeengineer/seller#products
We are preparing to shit our blog site for more professional site.
We are currently preparing for it.
You will see our new blog open soon.
http://algotrading-investment.com/
https://www.mql5.com/en/users/financeengineer/seller#products

Young Ho Seo
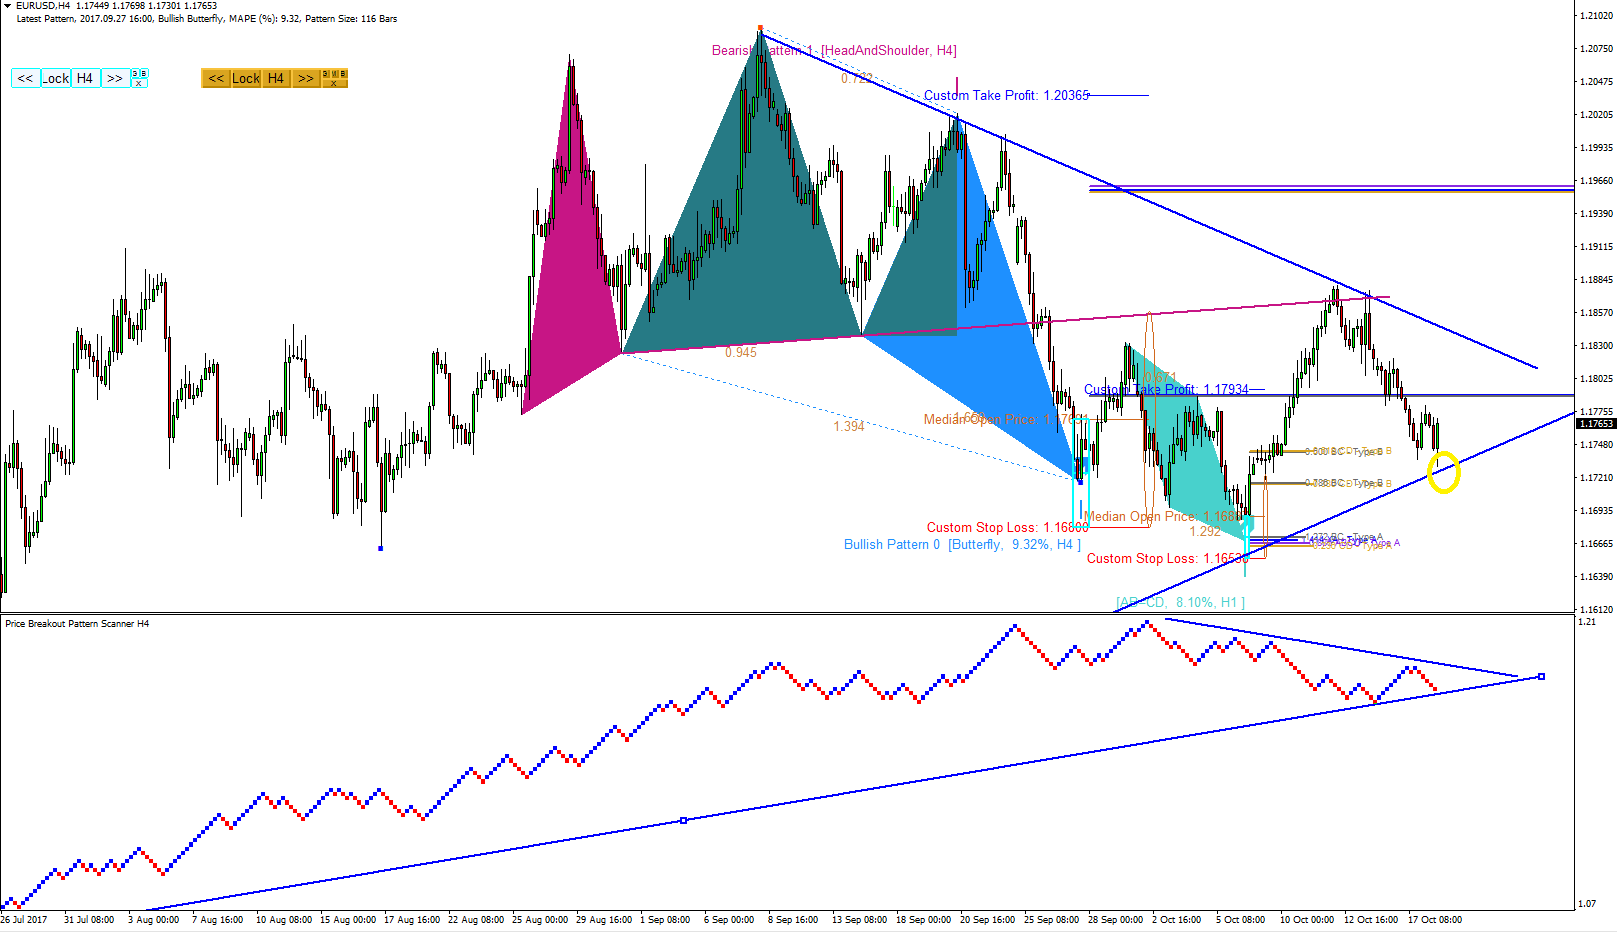
EURUSD Market Outlook
EURUSD made a beautiful turn at the slope. Currently EURUSD made a first notable correction candle bar. However, Bullish brick have not formed yet in our Smart Renko chart.
https://www.mql5.com/en/users/financeengineer/seller#products
http://algotrading-investment.com/
EURUSD made a beautiful turn at the slope. Currently EURUSD made a first notable correction candle bar. However, Bullish brick have not formed yet in our Smart Renko chart.
https://www.mql5.com/en/users/financeengineer/seller#products
http://algotrading-investment.com/

Young Ho Seo
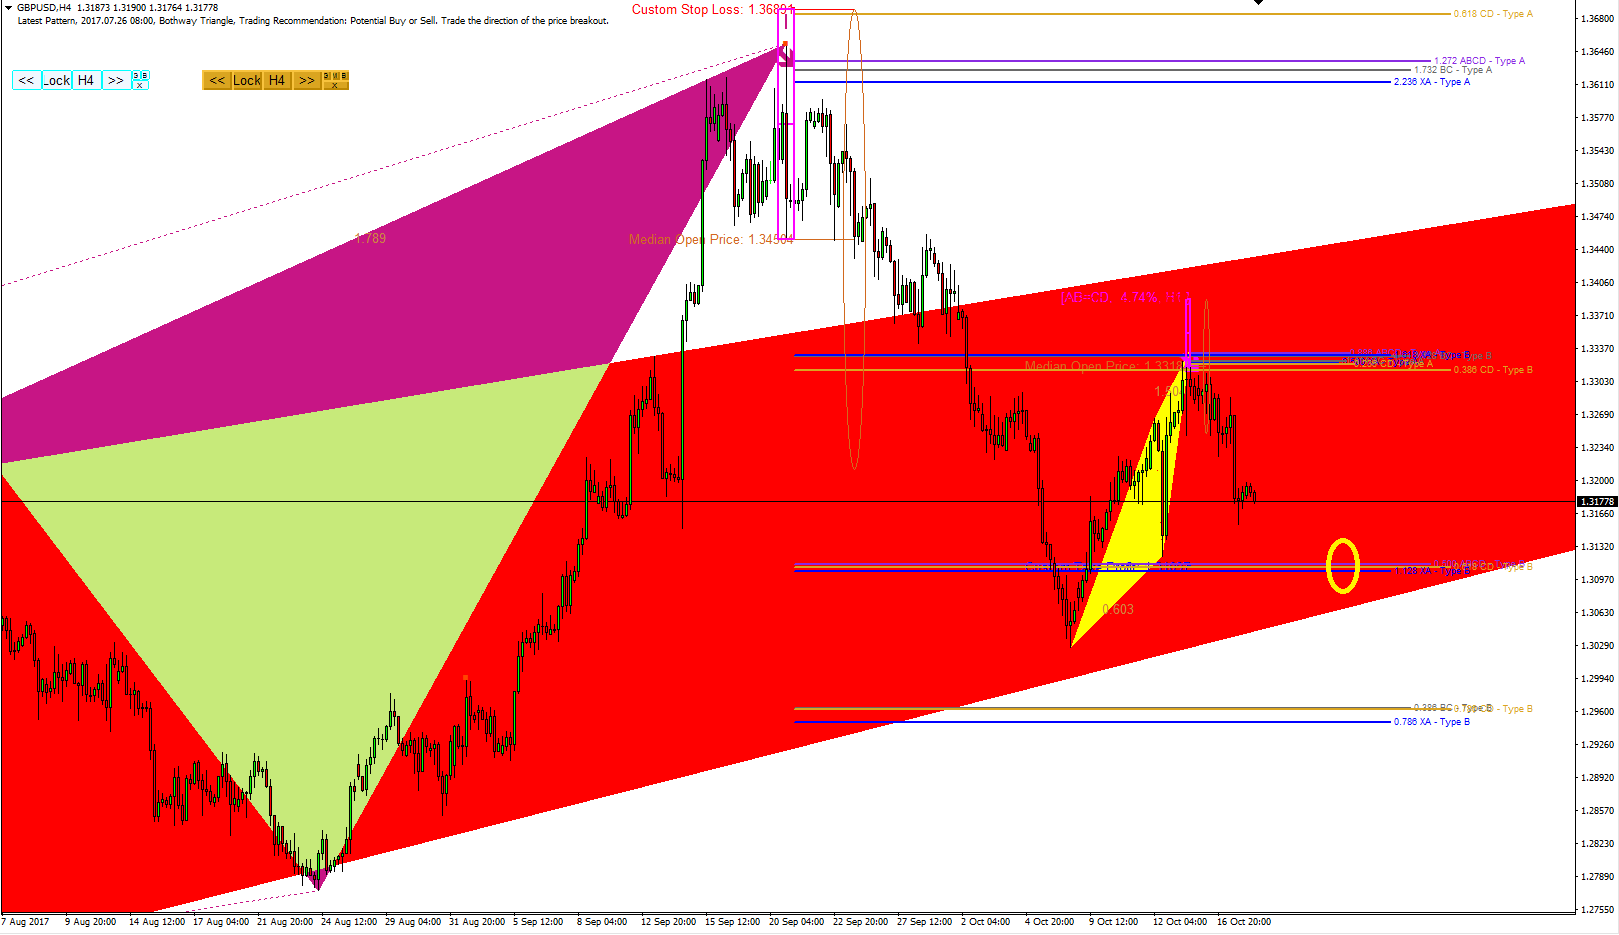
GBPUSD Market Outlook
GBPUSD continues for its bearish movement after the formation of ABCD pattern last Friday. Currently it is down by nearly 160 pips. Watch out the next PRZ Type B level for your trading at 1.3100.
Visit our website for powerful trading system and strategy.
http://algotrading-investment.com
https://www.mql5.com/en/users/financeengineer/news

Young Ho Seo
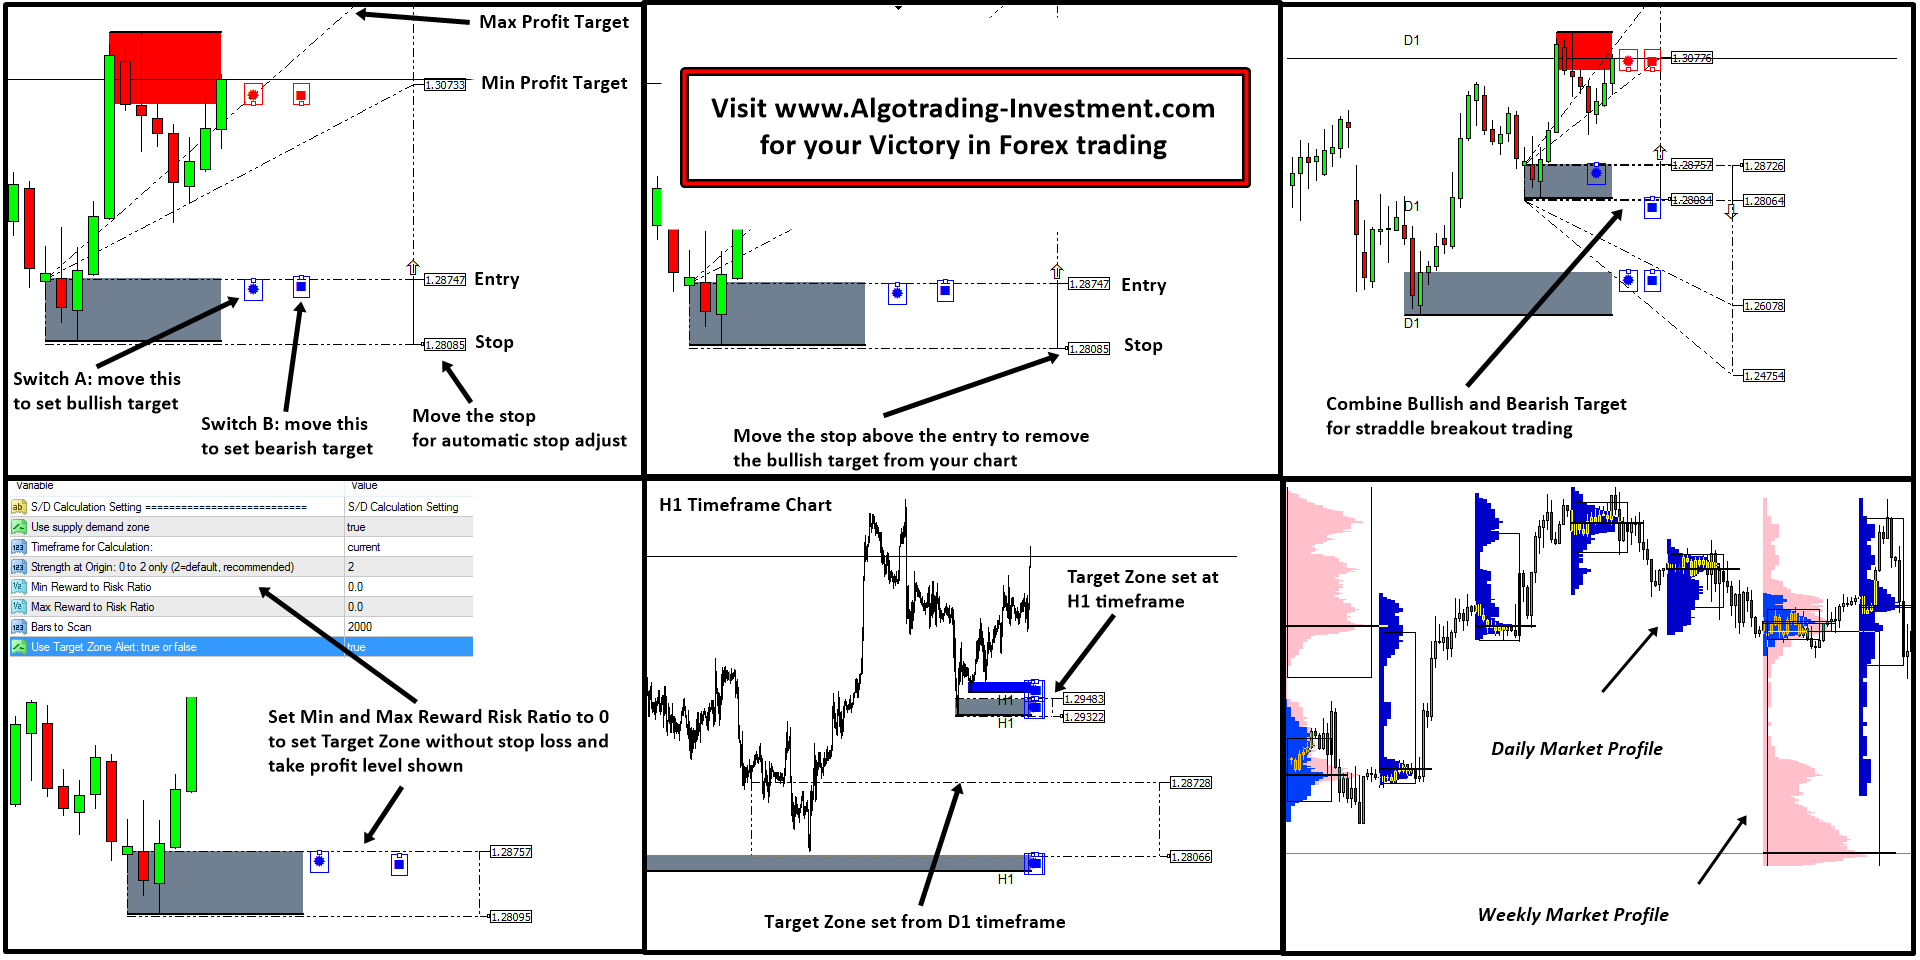
Mean Reversion Supply Demand
We have many sophisticated trading system to construct the sound portfolio of your investment and trading.
Mean Reversion Supply Demand is one of those powerful tool you can add in your collection. With the built in Market Profile indicator, the tool provide flexible and accurate control of your entry and risk management especially around the significant trading zone in your chart.
Highly automated feature can help you to readily set your profit target and even more sophisticated analysis in your chart.
http://algotrading-investment.com/portfolio-item/mean-reversion-supply-demand/
Meet the unique and powerful trading system at our sites:
http://algotrading-investment.com/
https://www.mql5.com/en/users/financeengineer/seller#products

Young Ho Seo
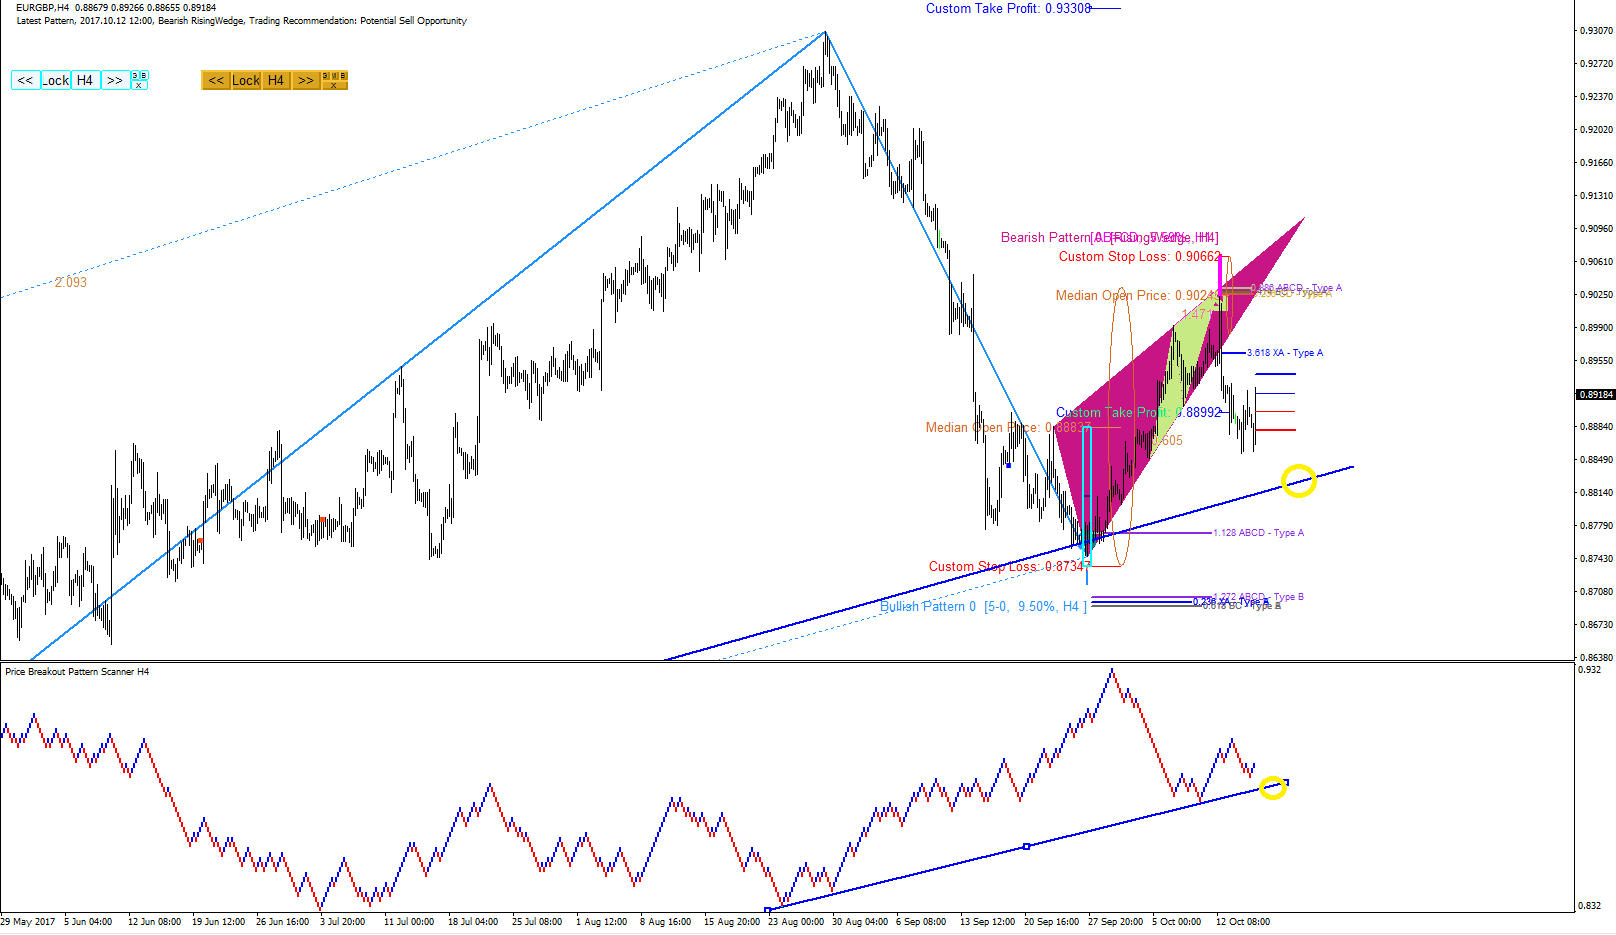
EURGBP Market Outlook
EURGBP had enjoyed bullish move after the formation of bullish 5-0 pattern in September. After the formation of ABCD pattern last Thursday, it is taking its bearish movement for about 150 pips. We recommend you to watch out the slope closely for your future trading (circled in yellow).
http://algotrading-investment.com
https://www.mql5.com/en/users/financeengineer/seller#products

Young Ho Seo
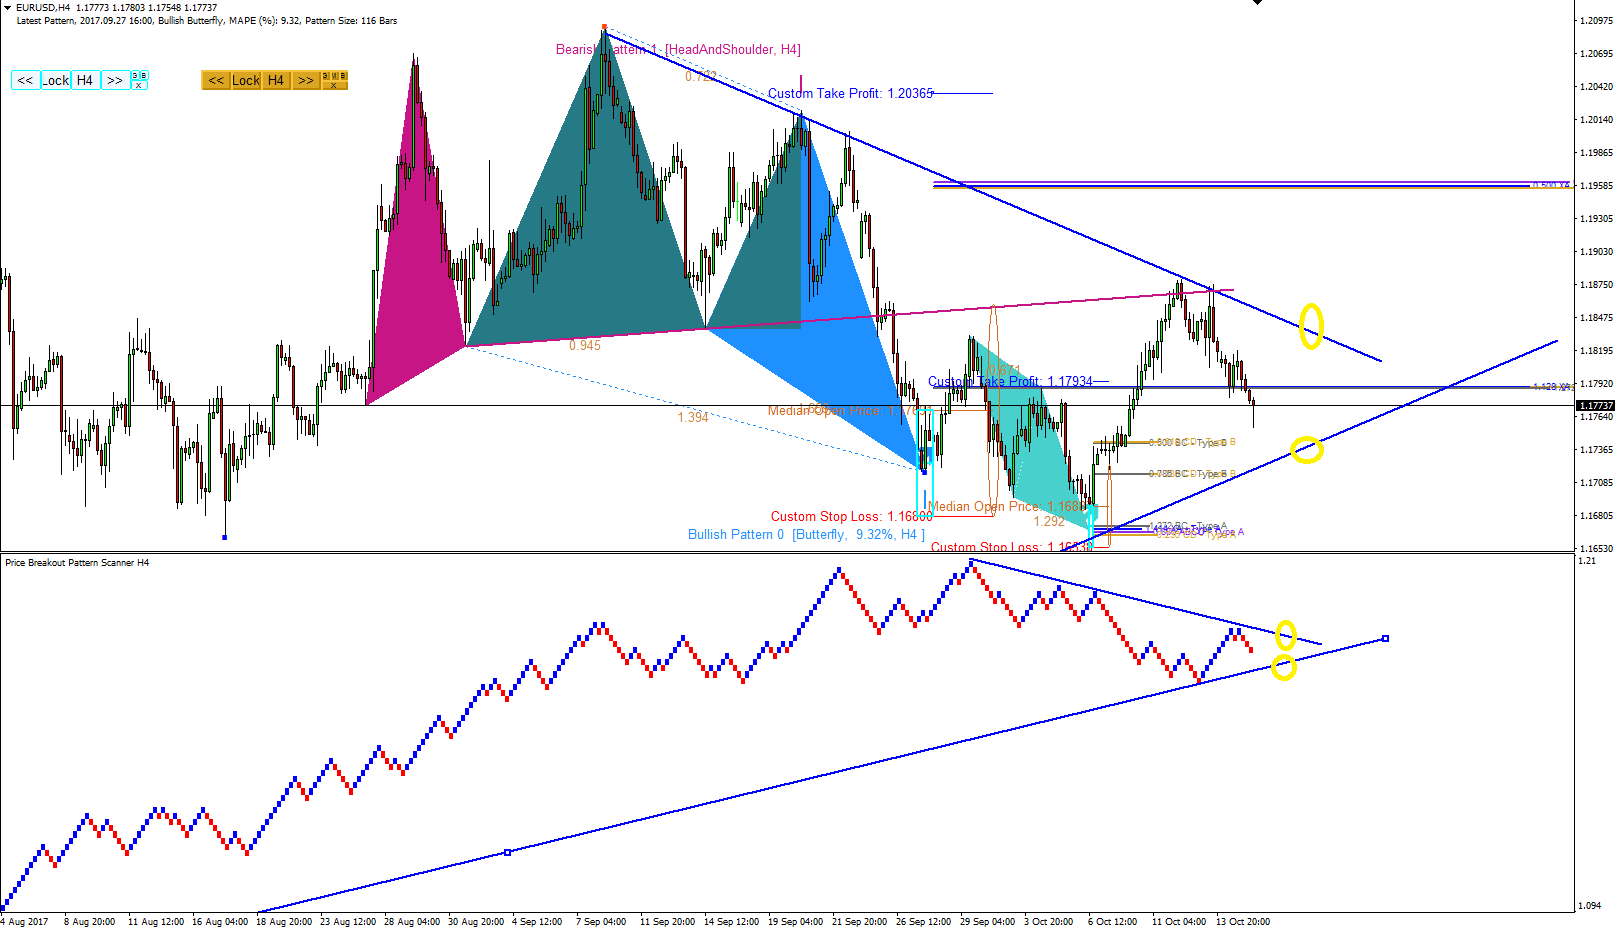
EURUSD Market Outlook
EURUSD penetrated PRZ Type B level just now. So we have marked for important support and resistance levels in our screenshots. The screenshot was created with the combined anlayis of Harmonic Pattern Plus and Price Breakout Pattern Scanner. We hope this is helpful for your trading.
Visit our website for powerful trading system and strategy.
http://algotrading-investment.com/
https://www.mql5.com/en/users/financeengineer/seller#products

Young Ho Seo
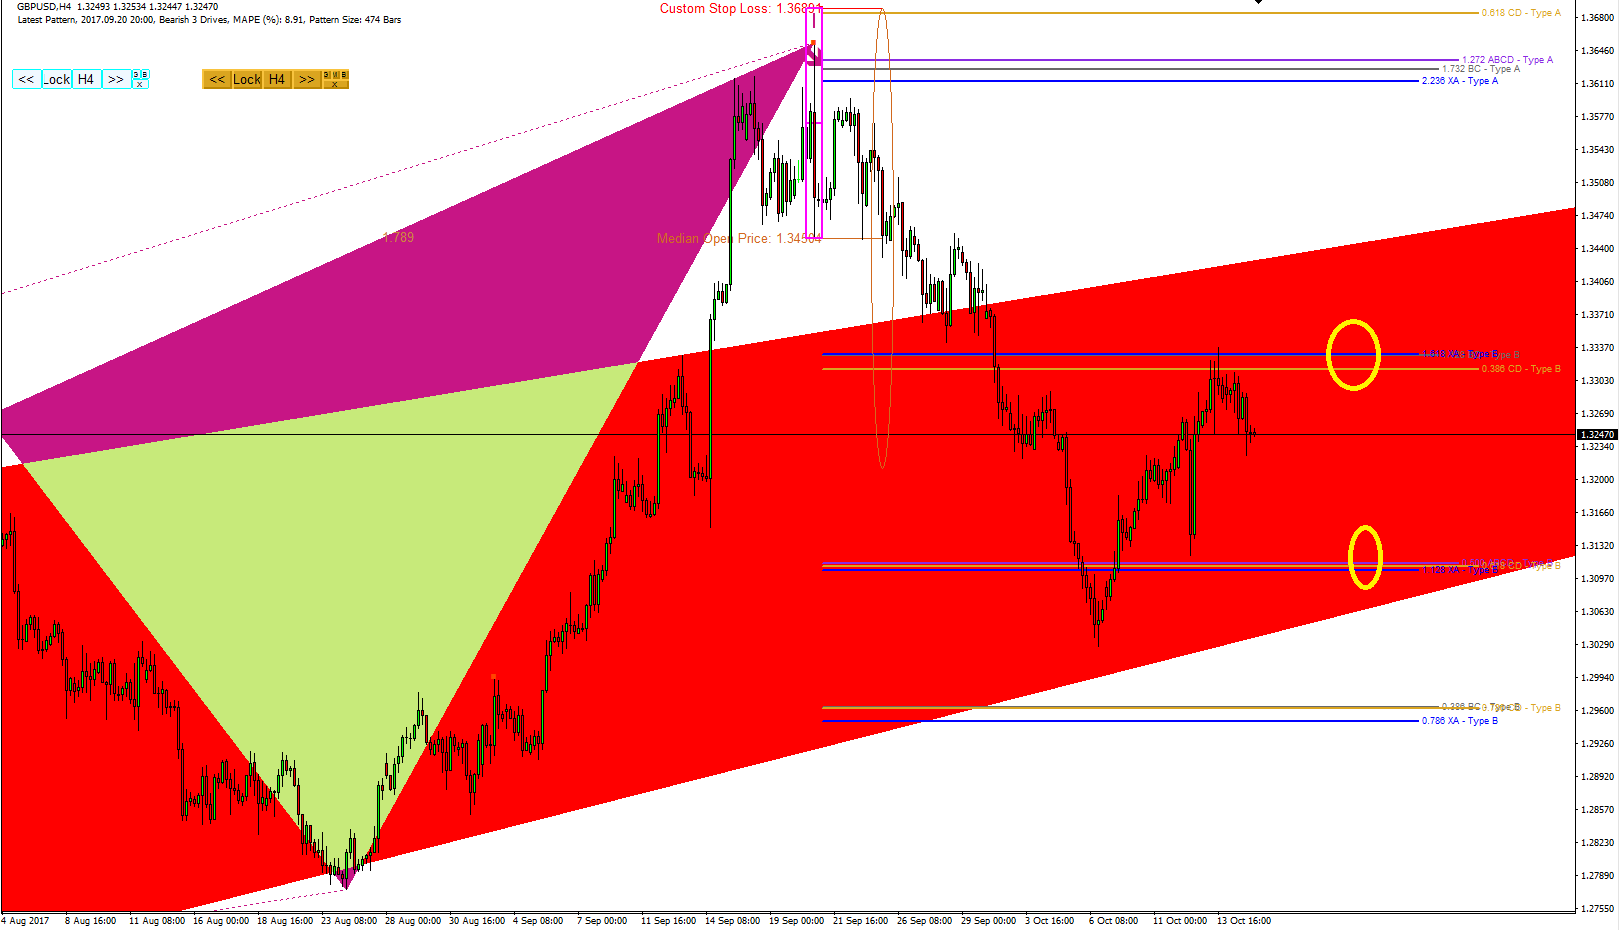
GBPUSD Market Outlook
Last Friday GBPUSD just touched the PRZ Type B level at 1.3330 (Derived from Bearish 3-0 pattern). After that, GBPUSD made a beautiful turning for its bearish correction. Currently it is down by nearly 70 pips. Watch out the next PRZ Type B level at 1.3110.
Visit our website for powerful trading system and strategy.
http://algotrading-investment.com/
https://www.mql5.com/en/users/financeengineer/seller#products

Young Ho Seo
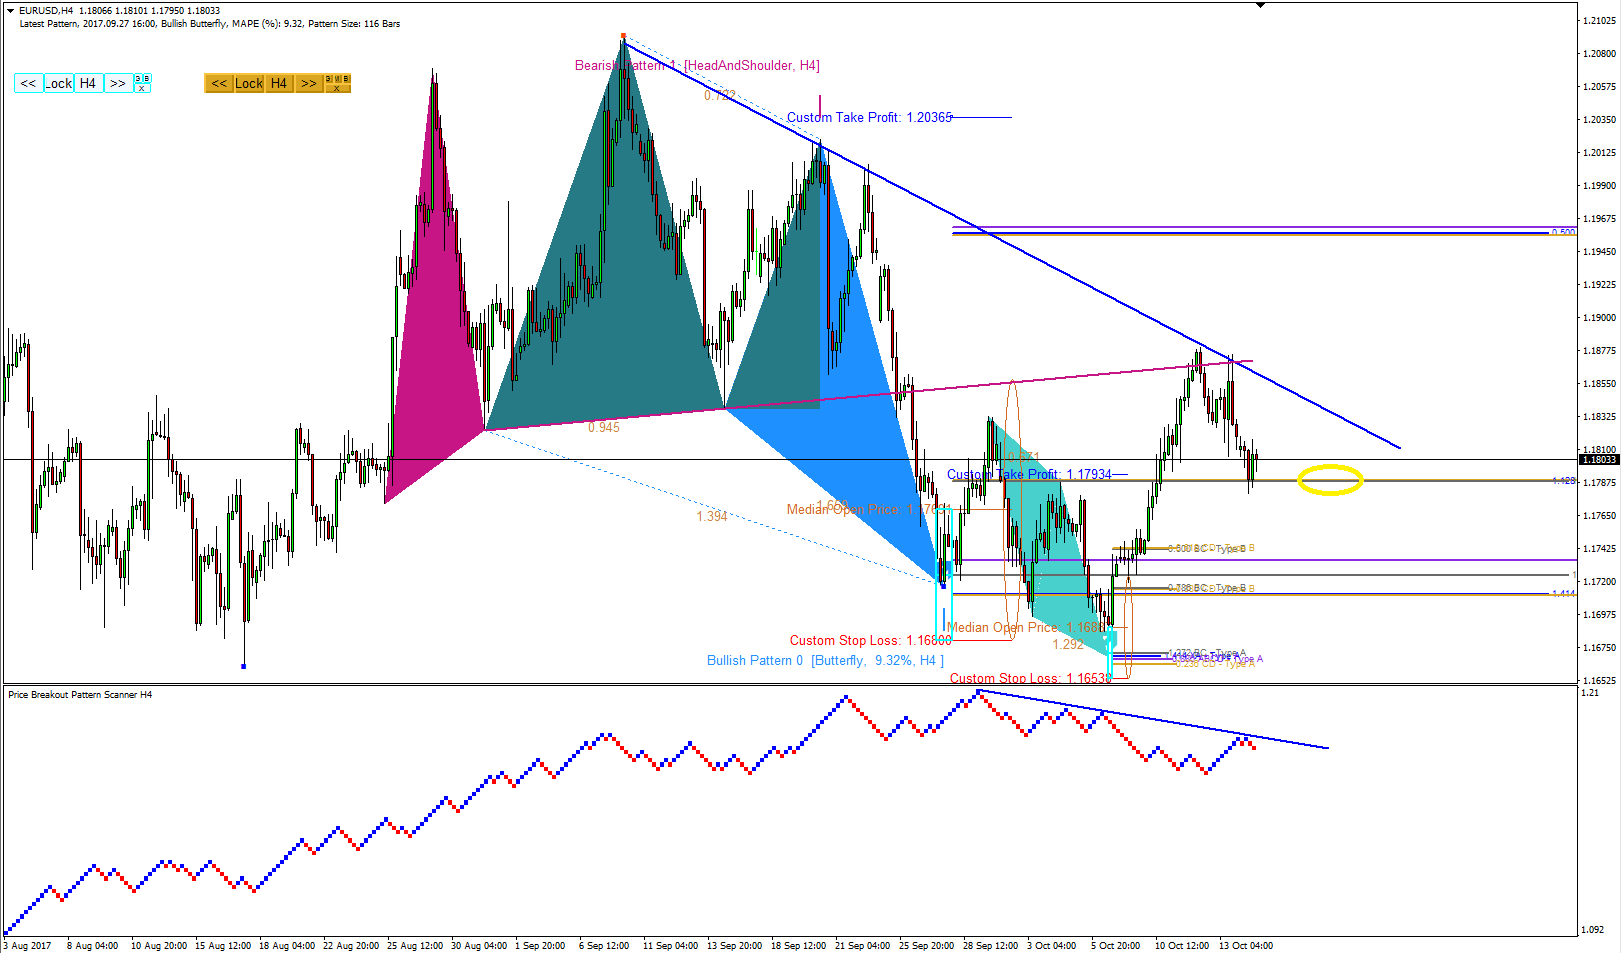
EURUSD Market Outlook
EURUSD have been testing PRZ Type B level finally. To show the touch clearly, we have extended the PRZ Type B level in the chart from Butterfly pattern. Currently EURUSD is making correction from its previous down movement. Two successive down brick were formed.
http://algotrading-investment.com/
https://www.mql5.com/en/users/financeengineer/seller#products

Young Ho Seo
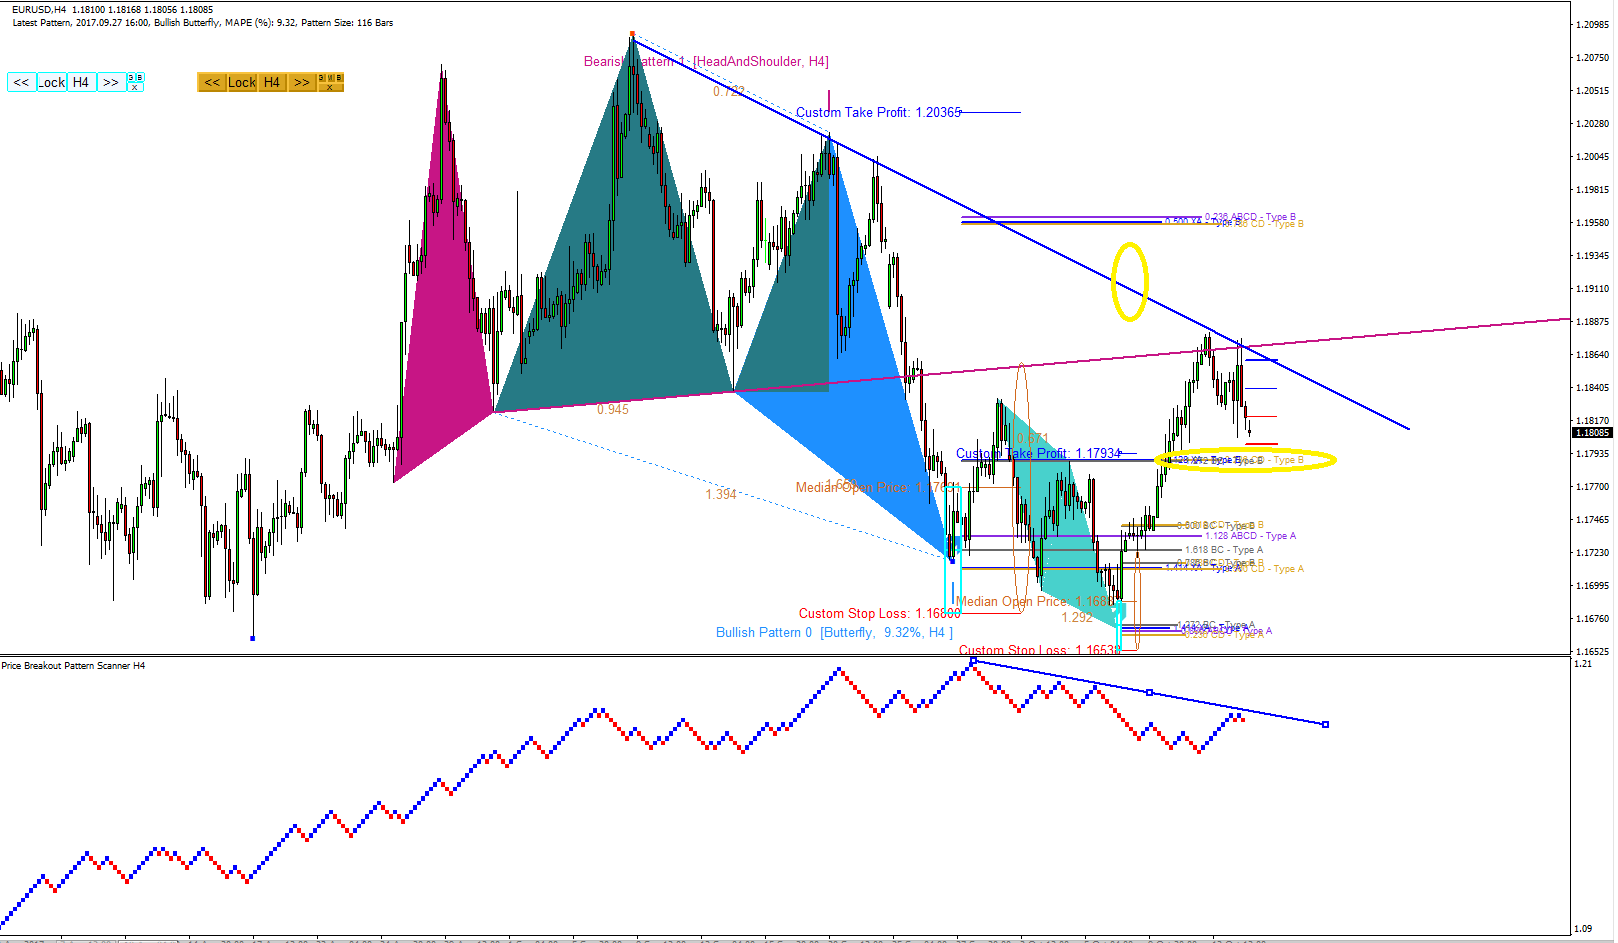
EURUSD Market Outlook
In regards to our last analysis, EURUSD have been retested the diagonal slope once more. Currently it is just 20 pips above from the PRZ Type B levels (circled in yellow). In addition, EURUSD have made a first down brick after it tested the diagonal slope last Friday. EURUSD is only 7 pips away from next down brick formation.
Visit our website for powerful trading tools and strategy.
http://algotrading-investment.com/
https://www.mql5.com/en/users/financeengineer/seller#products

Young Ho Seo

Written Instructions and Video Tutorials
Our website offers you the dedicated written instruction and video tutorials for trading and investment. Please make the best of our website for your trading and Investment.
1. Link for Written instructions:
http://algotrading-investment.com/manuals/
2. Link for video tutorials:
http://algotrading-investment.com/videos/
3. Link for articles and eBooks related to Price Action and Pattern Trading
http://algotrading-investment.com/price-action-and-pattern-trading-articles/

Young Ho Seo
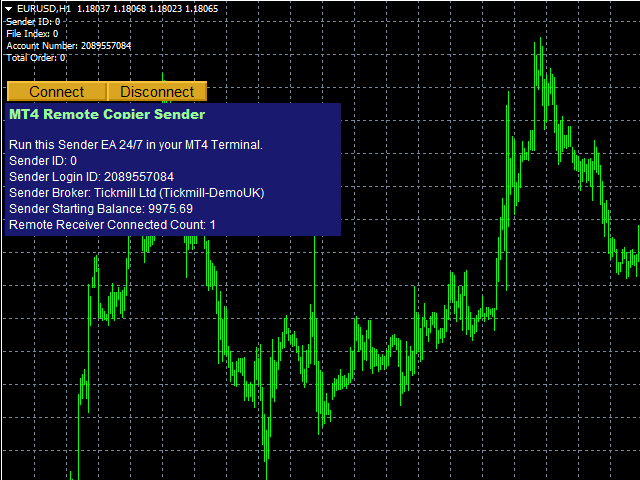
Remote Trade Copier Intro Video releaed
Remote Trade Copier Intro Video was released. The video explain how to install and how to apply the Remote Trade Copier for two computers located in two different countries. Here is the link for the intro video:
https://www.youtube.com/watch?v=G6sGkykij3E
Visit this link for more information about our Remote Trade Copier:
http://algotrading-investment.com/portfolio-item/remote-trade-copier-mt4-mt4/
if you have any questions about Remote Trade Copier, please feel free to write @ customer.support@algotrading-investment.com
https://www.youtube.com/watch?v=G6sGkykij3E

Young Ho Seo
GBPUSD Market Outlook
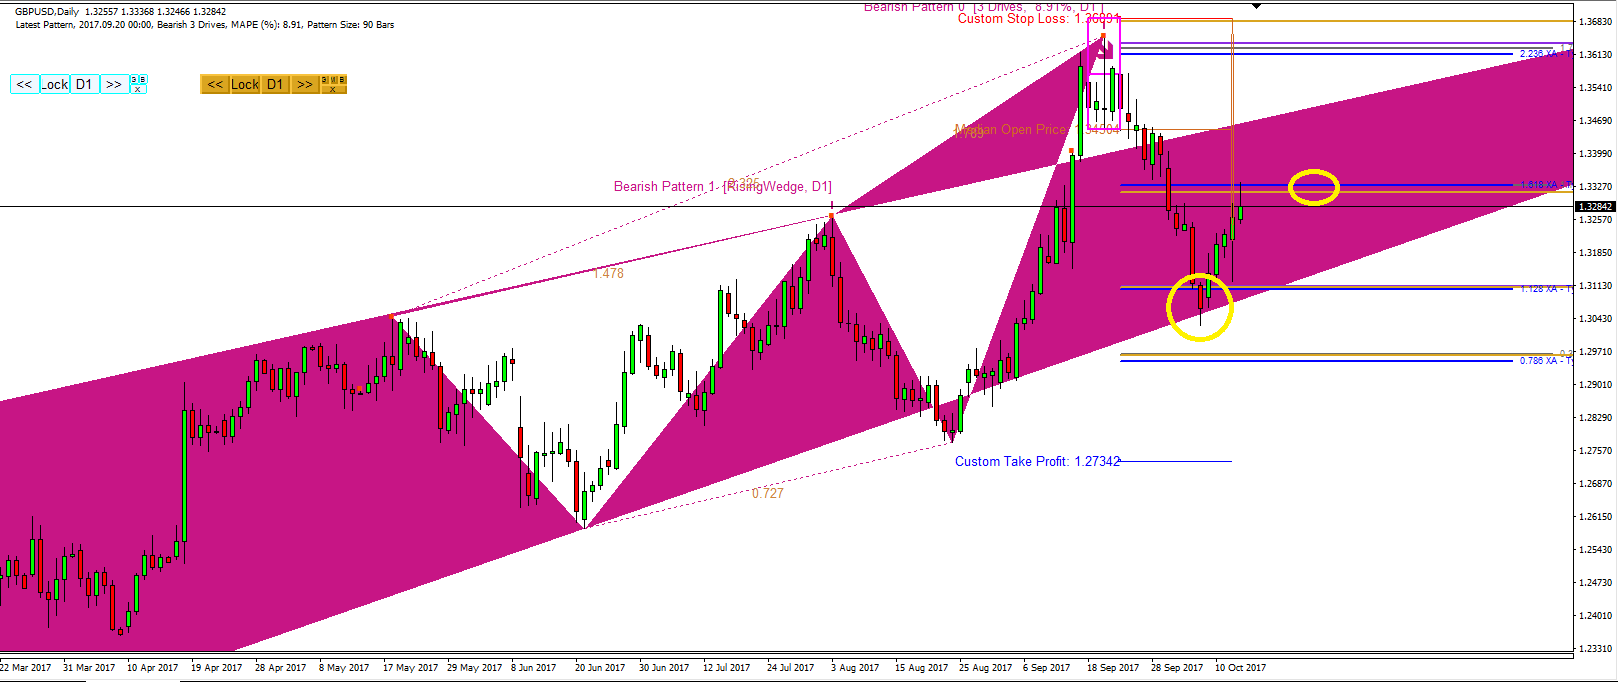
GBPUSD could not penetrate bottom of rising wedge pattern once again. GBPUSD is making correction after the bearish movement continued on the formation of the 3 Drives pattern. Currently GBPUSD tested the second PRZ Type B levels but could not penetrated at the first time.
https://www.mql5.com/en/users/financeengineer/seller#products
http://algotrading-investment.com/

Young Ho Seo
EURUSD Market Outlook
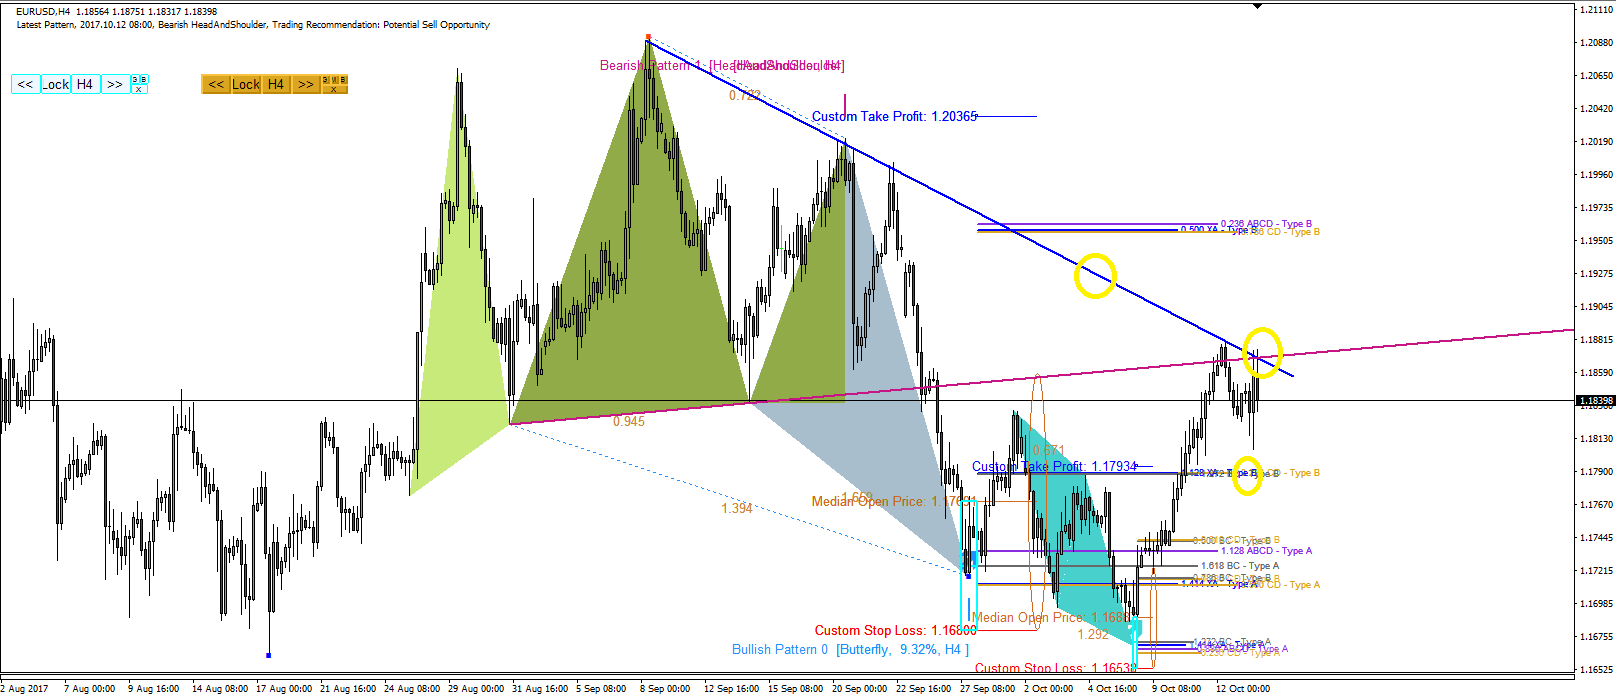
EURUSD attempted to retest the critical resistance level again. However it was not able to penetrate the resistance line. EURUSD is likely to come down to test the PRZ Type B level in the near future. Currently EURUSD is 50 pips away from the PRZ Type B level (circled in yellow).
Visit our site for powerful trading tools and strategy
https://www.mql5.com/en/users/financeengineer/seller#products
http://algotrading-investment.com/

Young Ho Seo
Market Activity Index to detect quite market
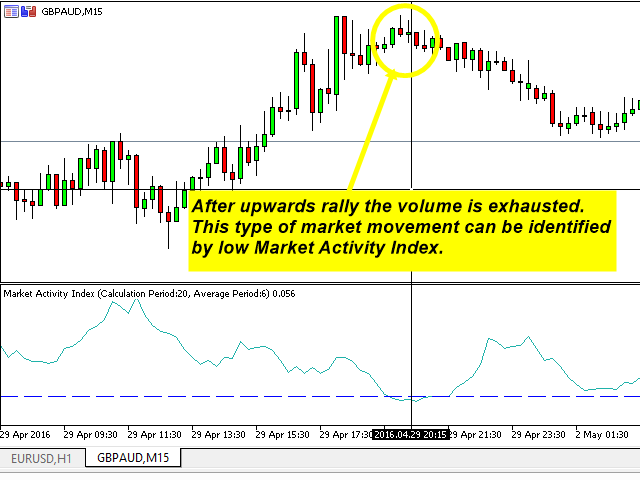
If your trading strategy requires to differentiate the volatile market from quite market, then Market Activity Index is probably the best tool for such a task.
In fact, Market activity index is comparable to Average True Range and Average Directional Movement Index. However, Market Activity Index is better than those because it gives a definite low volatility threshold at 0.05 or 0.10, which is identical to the statistical significance level. You can choose most of 0.05 or 0.10 for its threshold value.
Also Market Activity Index often spots the turning point quite successful after it hit the low Volatility market.
Here is the code line to call it from iCustom from your MetaTrader. Please use this code line for the references only because this may not work in the different testing environment.
input int CalculationPeriod = 20; // Calculation Period
input int AveragingPeriod = 6; // Averaging Period
input bool UseWeightedAverage = true; // Use Weighted Average
input double IndexCriticalLevel = 0.05; // Index Critical Level Value
input int IndexCriticalLevelWidth = 1; // Index Critical Level Width
input color IndexCriticalLevelColor = clrBlue; // Index Critical Level Color
input bool UseSoundAlert = false; // Use Sound Alert
input bool UseEmailAlert = false; // Use Email Alert
input bool UsePushNotification = false; // Use Push Notification
double value = iCustom(symbol, PERIOD_H4, "\\Indicators\\Market\\Market Activity Index MT4 v3.1.ex4", true, CalculationPeriod, AveragingPeriod, UseWeightedAverage, IndexCriticalLevel, IndexCriticalLevelWidth, IndexCriticalLevelColor, UseSoundAlert, UseEmailAlert, UsePushNotification, 0, 1);
Here is the link for the market activity Index
https://www.mql5.com/en/market/product/16189
https://www.mql5.com/en/market/product/16223
Also visit our website for many other powerful trading system and tool.
http://algotrading-investment.com/

Young Ho Seo
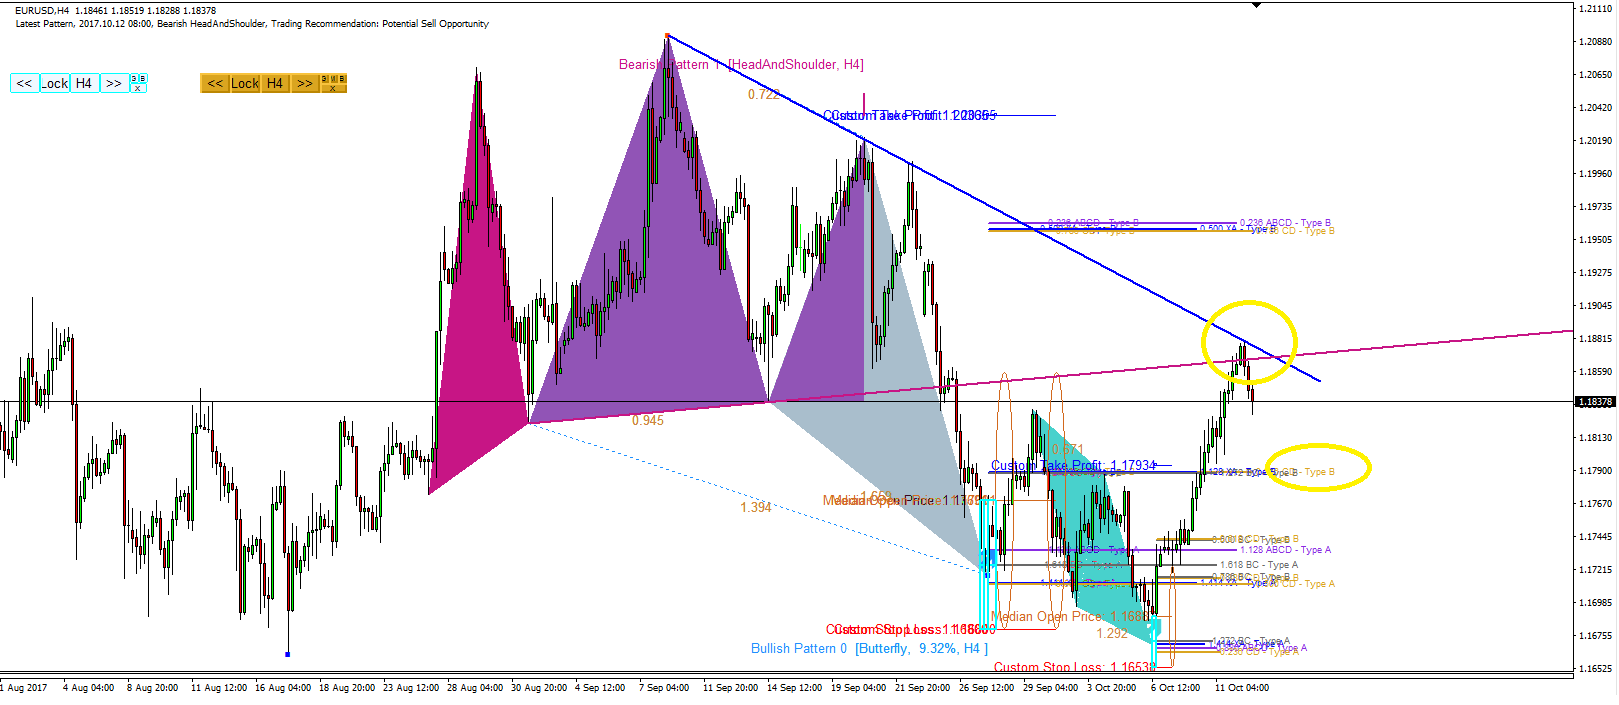

EURUSD Market Outlook
EURUSD made a down turn at the critical level we have outlined earlier. Currently it is down by nearly 45 pips. We have PRZ type B level from butterfly pattern, which can be act as another strong support levels in the future. The butterfly pattern are pattern from H4 timeframe whereas ABCD pattern are from H1 timeframe.
You are looking at H4 timeframe from the screenshot.
http://algotrading-investment.com/
https://www.mql5.com/en/users/financeengineer/seller#products

: