Смотри обучающее видео по маркету на YouTube
Как купить торгового робота или индикатор
Запусти робота на
виртуальном хостинге
виртуальном хостинге
Протестируй индикатор/робота перед покупкой
Хочешь зарабатывать в Маркете?
Как подать продукт, чтобы его покупали
Технические индикаторы для MetaTrader 4 - 23
This indicator creates synthetic charts. It creates a candlestick chart plotting the price of one instrument measured against another, helping you to find hidden opportunities in the market crossing relationships between different instruments. [ Installation Guide | Update Guide | Troubleshooting | FAQ | All Products ] Find hidden trading opportunities Get a broader sense of the price of commodities Commodities range against each other and are easier to trade Correlated Indices can be traded ag
FREE
Crosshair Levels : Free version of Object Synchronizer. ** No synchronization of objects among grouped charts and no group chart features supported in this version. Are you bored to save and load template many times for the same symbol for many chart time frames? Here is the alternative. With this indicator, you enjoy creating 3 objects. All objects that you created/modified always are moved easily with clicking the object, moving cursor to the point you wanted and clicking again). Supported
FREE

The ' Average Bar Chart ' indicator was created to showcase the traditional Heiken Ashi calculation as an exotic charting style. This indicator is known for reducing chart noise for a smoother price action. A dditional indicators are recommended
Key Features Candlesticks for OHLC are removed from the chart. Average bars may be shown as complete bars without tails. All functionality and features of this exotic chart are inputs.
Input Parameters Chart Timeframe = PERIOD_CURRENT; - period to s
FREE

Преимущества: Основан на классических индикаторах - ATR, Moving Average Определяет тренд/флэт на рынке, подкрашивая гистограмму соответствующим цветом Стрелками обозначены подтвержденные сигналы Является отличным фильтром для канальных стратегий (по экстремумам) Подпишись на мой telegram канал, ссылка в контактах моего профиля .
Настройки:
Наименование Описание настройки Period of Flat Detector Количество баров/свеч для анализа Period of EMA Период EMA (Moving Average) Period of ATR Пер
FREE
Вилка Нео v5, разрабатывалась для торговой системы "Оракул", но постепенно дополнялась, например - углами Ганна и другими опциями...
Можно создавать графические объекты с заданным цветом, стилем и толщиной, такие как: прямоугольники с заливкой и без, отрезки трендлиний и нестандартный инструмент - "вилка Нео" в виде трезубца, так же есть возможность интерактивно настраивать цветовую палитру прямо с графика, настраивать видимость объектов для разных ТФ, толщину и стили... Панель переключается кл
FREE

The volume weighted average price (VWAP) is a trading benchmark used by traders that gives the average price a security has traded at throughout the day, based on both volume and price. VWAP is calculated by adding up the dollars traded for every transaction (price multiplied by the number of shares traded) and then dividing by the total shares traded. You can see more of my publications here: https://www.mql5.com/en/users/joaquinmetayer/seller
FREE

Данный индикатор позволяет узнать сколько цена может пройти на текущем баре. Он выискивает среднее значение ATR для предыдущих 5 баров и рисует 2 границы цены. Вы можете его использовать на любом таймфрейме любого инструмента. На основе этого индикатора можно выставлять уровни стоп лосса и и профита, а также использовать его и в других хороших стратегиях. Не забывайте пользоваться риск менеджментом во время торговли!
FREE

This indicator applies the biquad high pass filter to the price-chart data, and displays the filter output for the OHLC as candlesticks. The candlesticks corresponds to the actual calculations of the filter value during the formation of each price bar (not from all historical highs lows or closes). The shape of the bars therefore corresponds directly to the shape of each price bar. High pass filters are an underappreciated type of oscillator that are seldom used in technical analysis in the st
FREE

Fisher Yur4ik Indicator is a momentum indicator originated by Yuri Prokiev (Russian). I combined the Fisher Test indicator with other indicators to sieve/filter signals. It is not used as a standalone indicator but in combination to filter out Price Action signals. I have uploaded this indicator (Fisher test) for download alongside the 3Bar_Play signal indicator for signals to appear. It is free.
FREE

SuperTrend AM - индикатор который позволяет открыть позицию в самом начале значительного движения цены. Вторым важнейшим качеством индикатора является способность максимально долго следовать тренду для получения всей потенциальной прибыли при этом минимизируя потенциальные убытки. Индикатор не перерисовывается и не пересчитывается. Вариант данного индикатора с расширенными возможностями по настройке и уведомлениями о сигналах - SuperTrend 3 .
Сигналы при работе с индикатором: появление красно
FREE

Данная версия индикатора работает только в потоке тиковых данных. Таким образом мы видим только текущую ситуацию с момента запуска. Рекомендую использовать классическую версию Real-Time Currency Valuation . Индикатор рассчитывает силу восьми основных валют, а также может рассчитать силу любой другой валюты, металла или CFD.
Основные особенности Умеет отображать только необходимые на данный момент валюты, таким образом не перегружая Вас лишней информацией и уведомлениями. Имеет встроенный набо
FREE

This indicator integrates the Bollinger Band strategy in calculation with a volume-over-MA
calculation to further narrow down "Areas of Interest" levels for a potential re-test zone to the right of the chart.
We added a Moving Average calculation for a multi-level cloud and further broke down more conditions to highlight both
volume flow crossover on the High and Extreme High MA's and also high and extreme high volume spikes on set period average
without bull\bear conditions. Original Bull
FREE

Fibonacci retracement is really one of the most reliable technical analysis tools used by traders. The main problem with using these levels in trading is that you need to wait until the end of the impulse movement to calculate the retracement levels, making difficult to take a position for limited retracement (0.236 or 0.382). Fibo Dynamic solves this problem. Once the impulse movement is identified the retracement levels are automatically updated allowing very dynamic trading in trends with onl
FREE

Индикатор отображает свечной паттерн Pin Bar. С помощью настроек коэффициента легко настраивается соотношение тени, тела и размера. Возможна фильтрация по тренду (2 скользящие средние) и по развороту (RSI и полосы Боллинджера). Это самый популярный паттерн прайс экшн. В наличии мультивалютный дэшборд. С его помощью вы можете легко переключаться между графиками.
Торговые паттерны: Ретест по тренду. Ложный пробой. Другие.
EURUSD, GBPUSD, XAUUSD, ... M15, M30, H1.
Входные параметры.
Основн
Трендовый осцилятор с продвинутой системой фильтрации. Определяет тренд, его ослабление и усиление. Имеет встроенную мультитаймфреймовую панель. AW Trend Oscillator работает на любых таймфреймах и на любых символах (валюты, индексы, нефть, металлы, акции). MT5 версия -> ЗДЕСЬ / Решение проблем -> ЗДЕСЬ Особенности и преимущества:
Продвинутая фильтрация тренда Изменение чувствительности индикатора в один клик Простая настройка Мультитаймфреймовая панель Возможность перемещения и минимизации
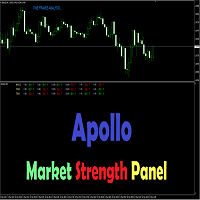
Apollo Market Strength Panel - это мульти-таймфреймовая панель, которая будет полезна в торговле как форекс трейдерам, так и трейдерам бинарных опционов. Панель отображает рыночную ситуацию на нескольких тайм фреймах от M1 до H4. Индикатор отображает три важные аспекты рынка. Это Trend, Force и Impulse. Если все три компонента согласованы, то это будет указывать на сигнал, в зависимости от движения рынка. Индикатор дает сигналы в виде сообщений на графике. Вы можете сами выбирать для каких тайм

This indicator is stand alone version from MP Pivot Levels (All in one) containing Woodie Pivots. Woodie’s pivot points are made up of multiple key levels, calculated from past price points, in order to frame trades in a simplistic manner. The key levels include the ‘pivot’ itself, and multiple support and resistance levels (usually up to three each). Traders use these levels as a guide for future price movements when setting up trades.
The pivot : (Previous high + previous low + 2 x previou
FREE

Pattern Explorer – надежный инструмент для применения всех возможностей самых популярных свечных паттернов . Для подтверждения всех паттернов используются алгоритмы машинного обучения. Выберите тейк-профит и стоп-лосс и нажмите кнопку Backtest your strategy (протестировать стратегию на истории) для тестирования стратегии на истории в реальном времени и увидеть следующие данные (в зависимости от настроек): Общее число сигналов Сигналы, достаточно надежные для тестирования Прибыльные сигналы (%) У
FREE

Key Features: Type of Indicator: Line Break Chart Indicator Usage: Identifying trend reversals and potential market turning points. Input Parameters: The primary input parameter is 'Lines_Break,' which represents the number of lines the price needs to move to create a new line in the opposite direction. How it works: The indicator draws green and red histogram bars to represent the line break chart. Green bars indicate an upward trend, and red bars indicate a downward trend. The indicator calcul
FREE

Индикатор показывает объем каждого бара в пунктах в виде гистограммы. Вторая версия индикатора. Теперь в виде осциллятора. Более информативный и функциональный. При этом не загружает основной график. Вы можете изучить код или самостоятельно модернизировать индикатор: Исходник на GitHub Показывает: объем бара в пунктах в виде гистограммы (буфер 0) среднее значение объема за весь период (буфер 1) другим цветом бары, которые выше клиентского среднего значения (буфер 2) среднее значение за количеств
FREE

FREE TopClock Indicator: This indicator is an Analog Clock That Shows: Local Time Of Pc or Time Of Broker Server or sessions(Sydney -Tokyo London -NewYork)Time or custom Time( with GMT -Base) this can shows Candle Time Remainer with Spread live. You can run this indicator several times for different times and move it to different places on the chart. If you would like, this indicator can be customized for brokers and their IB based on customer needs. For more information contact us if you
FREE
Highly configurable Bollinger Bands indicator. Features: Highly customizable alert functions (at levels, crosses, direction changes via email, push, sound, popup) Multi timeframe ability Color customization (at levels, crosses, direction changes) Linear interpolation option Works on strategy tester in multi timeframe mode (at weekend without ticks also) Parameters:
Bollinger Bands Timeframe: You can set the lower/higher timeframes for Bollinger Bands. Bollinger Bands Bar Shift: Y ou can set
FREE

Concept
Market arranges in Time upcoming Phases according to the present Results of its Interest. Directing Modulations are an Interaction of immanent Periods, which show in Reference to Time cyclic Activity and to Price leveling Activity. PointZero is a projecting Price Mask of this Concept of Time and Price and categorizing developed Price Movements related to their own Range: how far moved ? indicating their Status by marking special Events: when which Action ? setting the Situation in a fu
FREE
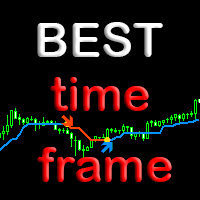
Индикатор BestTF поможет быстро выбрать самый лучший для торговли таймфрейм валютной пары или криптовалюты. Индикатор BestTF рассчитает и покажет в таблице крутизну графика (волатильность) для всех существующих таймфреймов текущего торгового инструмента. Почему важно правильно выбрать таймфрейм
Выбор таймфрейма является ключевым аспектом при торговле на валютном рынке по нескольким причинам:
Торговые стратегии: Различные торговые стратегии эффективны на разных таймфреймах. Например, краткоср
FREE

Индикатор Volume Weighted ATR - полезный инструмент для измерения рыночной активности. В его основе лежит идея индикатора Volume-Weighted ATR. Сочетание этих двух элементов помогает определить потенциальные поворотные точки или возможности для прорыва. Индикатор для классификации активности рынка использует скользящую среднюю и ее мультипликаторы. Соответственно, где находится бар VWATR (относительно скользящей средней), он маркируется как сверхнизкий, низкий, средний, высокий, очень высокий ил
FREE

UniversalFiboChannel - универсальный индикатор, строит торговый канал по уровням Фибоначи. Данный индикатор является полноценной торговой канальной стратегией. Индикатор устанавливается обычным образом и работает с любым торговым инструментом. Параметры HelpBasisTF = "M:43200;W:10080;D1:1440;H4:240;H1:60" - подсказка для параметра BasisTF
BasisTF = 1440 - базовый период для расчета уровней Фибоначи DisplayDecimals = 5 - количество знаков после запятой цены торгового инструмента Преим
FREE

Введение в алгоритм GARCH Improved Nelder Mead GARCH - это сокращение от Generalized Autoregressive Conditional Heteroskedasticity (Обобщенная авторегрессионная условная гетероскедастичность). Представляет собой модель прогнозирования волатильности, обычно применяемую в финансовой сфере. Модель GARCH впервые появилась в работе датского экономиста Тима Петера Боллерслева (Tim Peter Bollerslev) в 1986 году. Лауреат Нобелевской премии 2003 года Роберт Ф. Энгл внес огромный вклад в усовершенствовани
FREE
Уникальный индикатор IceFX VelocityMeter для платформы MetaTrader 4 измеряет скорость рынка форекс. Это не обычный индикатор объемов или других величин, т.к. IceFX VelocityMeter способен понять скорость скрытых в тиках движений рынка, а эта ценная информация не доступна в обычных свечах, поэтому не может быть получена простым индикатором. Этот индикатор контролирует приход тиков (частоту и величину изменения) в пределах указанного диапазона времени, анализирует эти данные, определяет, записывает
FREE

Indicator for the 4th strategy of the Pipsurfer EA. This indicator will allow the user to visually see the points of entry for strategy 4 of Pipsurfer. In the settings you will be able to adjust the parameters to mix and match to your trading style and find the settings that you want to either trade manually or tune the EA to do. Strategy 4 uses a market structure trend continuation approach to trading and looks for confirmed highs in downtrends and confirmed lows in uptrends to find great trend
FREE

KFX SMA: Symbol Changer + Moving Average (3x) + ATR + RSI + Candle Timer.
This indicator allows you to create a Symbol list and change between symbols of the current chart or Timeframe by selecting the appropriate button. On Chart there are three(3) multi timeframe Moving Averages shown (selected by you), ATR Value MTF ( selected by you - helps with setting SL and TP), RSI Value MTF (selected by you) and a Candle Timer. Features: - Symbol Changer : Change Symbol and Timeframe of Chart. (
FREE

Индикатор рисует ценовые каналы. Можно настроить, чтобы показывались каналы только на покупку или на продажу. Также можно отображать линии тренда вместо каналов. Индикатор очень прост в использовании, но, тем не менее, существует много торговых стратегий, которые основаны на торговле в каналах. Советник на основе этого индикатора: https://www.mql5.com/ru/market/product/37952 Параметры History - максимальное количество баров для построения каналов; Distance - минимальное расстояние от одного мак
FREE

This product is a part of ON Trade Waves Patterns Harmonic Elliot Wolfe
you can test free version on EURJPY from this link Wolf Waves Indicator
Откройте для себя Wolf Waves - ваш идеальный инструмент для торговли! Вы ищете мощный инструмент для легкой идентификации Wolf Waves на любом временном интервале? Дальше смотреть не надо! Наш индикатор Wolf Waves делает это легко. Вот почему он идеально подходит именно вам: Основные характеристики: Автоматическое обнаружение: Наш индикатор Wolf Wav

Тренд индикатор Уникальная система определения тренда для каждого таймфрейма,
Позволяет по любой валютной паре иметь реальную картину тренда по всем стандартным таймфреймам! Зеленые квадратики BUY тренд а красные SELL.
Техника торговли если мелкие тайм фреймы противоположны тренду старших то по инерционости движения рынка вход по старшим таймам как на скринах.
FREE

The " Comfort Zone Signal " indicator identifies a daily zone that, when broken, has a high probability of the market continuing the established trend .
Upon signal, the indicator calculates stop loss and take profit, which can be set by you.
You can also set the trend. If the price is above the MA, it looks only for long positions, if below, it looks only for short positions.
You can choose to ignore the moving average and display all signals.
Additionally, you have the risk percentage d
FREE
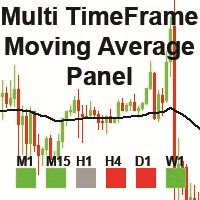
The "MTF Moving Average Panel" indicator is more of a helping tool than an indicator, it serves to help traders to spot the trend direction without having to change the timeframe and check all timeframes. It is best used with other indicators and signals, to help filter the signals according the trend based on multiple timeframes.
Indicator inputs : - Moving Average period : The period for the Moving Average. Default is set to 50 periods. - Moving Average method : The method of calculation of
FREE

Данный индикатор позволяет сканировать символы в окне "Обзор рынка" (не более 15 в демо-версии), отфильтровывать тренды и отправлять оповещения. Он работает на основе эффективного индикатора "SuperTrend" , который используется многими трейдерами для торговли: Когда цвет ячейки меняется на " зеленый " или " красный ", это указывает на изменение тренда для открытия длинной или короткой позиции. Также появится экранное уведомление. Когда цвет меняется на зеленый , это указывает на восходящий тренд
FREE
How To Trade
Execute your trades in 3 Easy Steps!
Step 1: Trade Setup Entry Buy in Signal Arrow color DodgerBlue. Entry Sell in Signal Arrow color RED. Success Rate ≥ 75% 100:25 Step 2: Set Stop Loss Stop loss BUY ----> You can set stop loss on Line RECTANGEL color DodgerBlue. Stop loss SELL ----> You can set stop loss on Line RECTANGEL color RED. Step 3: Set Take Profit Take profit BUY on RECTANGEL color RED. Take profit SELL on RECTANGEL color DodgerBlue. Strategy SIMPLE Day trading / Swi
FREE
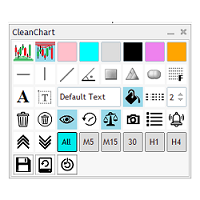
Вы устали от того, что на вашем текущем графике появляются испорченный график с объектами графика из разных пар?
Вам скучно нажимать несколько кликов, чтобы обновить цвета и стили объектов?
Вы хотите иметь возможность загружать определенный набор конфигураций для наиболее часто используемых объектов диаграммы?
Не смотрите дальше, у CleanChart есть все.
4 настраиваемых цвета Настраиваемые пользователем цвета поддержки и сопротивления 10 наиболее часто используемых объектов графика Таймфр
FREE

Индикатор вычисляет и рисует линии на графике. Два типа тренда: Тренд A: линия отрисовывается по локальным минимумам для восходящих трендов и по локальным максимумам - для нисходящих. Тренд Б: линия отрисовывается по локальным максимумам для восходящих трендов и по локальным минимумам — для нисходящих. Нужно, чтобы ситуация полностью удовлетворяла нескольким условиям, которые можно настроить во входных параметрах (см. также рис. 4): MinBarAge : количество баров до последней базовой точки линии н
FREE

Индикатор уровней на основе индикатора Zig-Zag - это высокоточный инструмент для торговли на Forex, который поможет вам улучшить вашу стратегию и принимать более точные решения. Он использует алгоритм Zig-Zag для определения различных уровней поддержки и сопротивления на рынке, исходя из чего можно определить, когда лучше всего войти или выйти из сделки. Этот индикатор обладает высокой производительностью и точностью в расчете уровней, что позволяет трейдерам получать максимальную прибыль при ми
FREE

VR System – это не просто индикатор, это целая, хорошо сбалансированная торговая система для торговли на финансовых рынках. Система построена на классических правилах трейдинга и комбинации индикаторов Moving Average и канал Дончана ( Donchian channel ). В системе VR System учтены правила входа в рынок, удержание позиции в рынке и правила выхода из позиции. Простые правила торговли, минимальные риски, четкие инструкции делают VR System привлекательной торговой стратегией для трейдеров на финансо
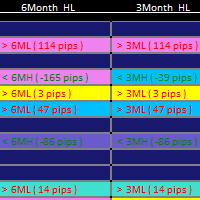
1. Updated usage instructions in blog below: Smart Market Structure Trading System and Automatic Scanner - Trading Systems - 13 October 2023 - Traders' Blogs (mql5.com) https://www.mql5.com/en/blogs/post/754495 2. The Smart Market Structure Opportunity Scanner is a great tool to find trading entries and exits based on Smart Money Concepts. It has a build-in custom choice of Forex pair lists to choose from for the scan, and it also has a user-defined entry choice to put down your own list of Fo
FREE

NOTE!: The trend vote and the buy sell option shall match to the same direction before you put a trade!!
Indicator that uses Kalman filters (same as used on autonomous vehicles for data fusion between different sensors / technologies such as RADAR, LIDAR and Camera with Artificial Intelligence for object detection) by using the high and low price in order to identify buy and sell signals as indicated on the graph.
This indicator can be used on any timeframe with any currency or symbol.
Thi
FREE

With this indicator, you can easily make price regions in all time zones. In addition, with the automatic supply demand finder, you can ensure that the new regions are found automatically. You can increase your transaction quality by reaching more accurate operations with this auxiliary Tool and indicator.
I share your trial version of EURUSD for free with you. If you want to buy the working version in all parities, you can contact me. +New version Gap Bar Add ( Press G keyboard ) Default co
FREE

Индикатор использует линии Полос Боллинджера для обнаружения тренда. Очень полезный инструмент для ручной торговли. Кроме того, можно использовать индикатор с ATR в качестве фильтра, а также включить всплывающее уведомление при развороте тренда. Показатели индикатора очень понятны и просты в использовании. Лучше всего индикатор работает на таймфрейме H1.
Параметры советника: BarsCount - количество баров для расчета линии. BBperiod - период полос Боллинджера. BBdeviations - отклонения полос Бол
FREE

BuySell Volume is an indicator that approximates Buy and Sell volumes based on price movement. Input Description: applied_model: Choose the applied model. In low reversal mode, price is considered receive low bearish pressure during bullish candle's creation (high bearish pressure on high reversal model. In other words, Bullish Marubozu candles has really high Buy Volumes in low reversal model than in high reversal one.
Output Description: Buy and Sell Volume: Determines how many Buy and Sell v
FREE

BeST_Chande RAVI (Range Action Verification Index) is an MT4 Indicator that is based on the corresponding indicator developed by Tushar Chande which is mainly based on market momentum while focuses on identifying ranging and trending markets.
By default RAVI is defined by the formula: RAVI = Absolute value (100 x (SMA(7) – SMA(65)). Also by default there is an arbitrary reference level of 3% that means a market is ranging if the RAVI is less than 3%, or trending strongly if it is is greater t
FREE
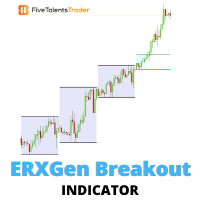
Без волатильности торговля на финансовых рынках была бы невозможна. Получить прибыль можно ТОЛЬКО за счет движения цены. Система ERXGen (Early Riser Next Generation) – методика краткосрочной торговли, основанная на том, что в определенные моменты времени в течение торгового дня волатильность растет. Основу ERXGen составляет очень популярная стратегия London Open Breakout с добавлением правил, повышающих стабильность и эффективность продукта. Для определения условий входа используется поведение ц

Определяет экстремумы. Данный индикатор состоит из двух частей: Первая рисует линии на графике, обозначающие низкую волатильность относительного дневной активности рынка. Вторая отвечает за определение экстремума и дает сигналы на покупку или продажу. Данная система подходит для любых инструментов. Рекомендуется использовать таймфрейм от м15 до н4. Перед использованием необходимо подобрать настройки под себя. Настроить отклонение линий. Указать коэффициент волатильности. Подпишись на мой telegr
FREE

BinaryFortune - индикатор, разработан и адаптирован специально для торговли краткосрочными бинарными опционами. Алгоритм индикатора, прежде чем выдать сигнал анализирует множество факторов. Устанавливается индикатор обычным способом. Сам индикатор состоит из информационного окна, где отображается имя торгового инструмента, уровни поддержки и сопротивления, непосредственно сам сигнал ( BUY , SELL или WAIT ). Появление торгового сигнала сопровождается также звуковым сигналом и окном Alert. Преиму
FREE

Представляем Ms. Fibonacci , мощный и бесплатный индикатор, разработанный для упрощения процесса рисования и корректировки уровней Фибоначчи на графике. Этот индикатор автоматически идентифицирует и отмечает новые самые высокие и самые низкие уровни Фибоначчи, обеспечивая точное и точное размещение. Одной из ключевых особенностей Ms. Fibonacci является его способность правильно рисовать уровни Фибоначчи, указывать точки на точки и отмечать соответствующие ценовые уровни. Эта функция экономи
FREE
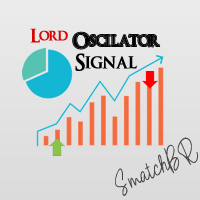
LordOscilatorSignal is a financial market indicator for Meta Trader, which uses standard market indicators; Stochastic, Moving Average, MACD, MA Xover, P.SAR.
Exactly! this single indicator has the help and assistants of (5) indicators.
The LordOscilatorSignal has a graphic panel of great visualization and understanding, being able to observe the values of each indicator and timeframes.
LordOscilatorSignal identifies through the trends of the buying and selling indicators, if all indicato

About testing Mode step1.Copy the settings below into txt and save as presets file such as "QDT3.set" step2.Copy the presets file into the "tester" folder which is located in the MT4 root directory step3.Load the settings when testing the indicator step4.Use the tick data to test and adjust the test speed to 30
InpDivideLine1=*******************************通用设置******************************* InpTheme=2 InpSHIcon=0 InpShowSHIcon=true InpShowOnRight=true InpShowMainTabByClickAutoHide=true In
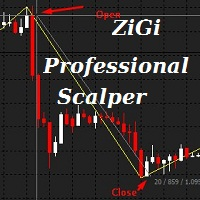
Индикатор ZiGi Professional Scalper : Инструмент реального анализа волн Этот индикатор раскрывает истинные волны рынка, выявляя чередующиеся максимумы и минимумы на графике цены, тем самым отображая волновую структуру рынка. Алгоритм этого индикатора совершенно новый, и его связь с ZiGi Professional Scalper и zigzag чисто косметическая. Он основан на восьми радикально различных алгоритмах и способен вычислять объемы рынка в реальном времени. При использовании этого индикатора ручное нанесение
Moving Average Crossover Scanner This Scanner scans two moving averages(MA) crossover across multi-currency pairs and multi-time frames and shows all the result in the dashboard. 1. The fast MA is about to cross up the slow MA - designated as "XUP". 2. The fast MA is about to cross down the slow MA - designated as "XDN". 3. The fast MA has just crossed up the slow MA - designated as "UP". 4. The fast MA has just crossed down the slow MA - - designated as "DN". Input parameters can be changed

The Market Profile Indicator for MT4 displays the price levels and zones where increased trading activity happens. These zones with substantial forex trading activity provide the forex traders with the best entry levels, support, and resistance levels. Moreover, price levels indicate the best reversal zones. As a result, forex traders can identify BULLISH and BEARISH market trends and BUY and SELL entry points as well as the best reversal points. The indicator works well in all intraday timefram
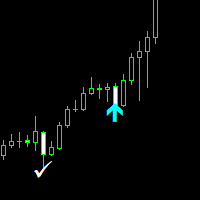
Nasdaq Savages Non-repaint indicator works on all timeframes 1 minute to 15 minutes timeframe for scalpers. 30 Minutes to Monthly timeframe for swing traders The Nasdaq Savages indicator comes with a top right info tab which tells you about the current buy or sell signal, Profit in pips, Stop loss and Target Red arrow is your sell entry signal the white right tick is your exit signal and take profit hit signal Light blue arrow is your buy entry signal the white right tick is your exit signal an

Introducing the "Magic Trades" for MetaTrader 4 – your ultimate tool for precision trading in dynamic markets. This innovative indicator revolutionizes the way you perceive market trends by harnessing the power of advanced analysis to detect subtle changes in character, paving the way for optimal trading opportunities.
The Magic Trades Indicator is designed to empower traders with insightful entry points and well-defined risk management levels. Through its sophisticated algorithm, this indica

Search for an entry with low risk for trading by Lisek Waves Indicator. Using Lisek Waves Indicator can improve your trading performance. In it’s simplest form, this trading tool make it easy to s earch for an entry with low risk and to manage your trade and risk. Lisek Wave analysis is based on the notion that markets follow specific patterns called waves which are the result of a natural rhythm of crowd psychology that exists in all markets. You can avoid the loss from taking trades that are
FREE

本指标是根据黄金分割理论,分别获取过去22(默认)根K线高低价,并通过黄金分割系数计算得出支撑、压力曲线。 当价格第一次向上靠近压力线,或者多次靠近压力线时,会出现向下的箭头符合,提示有压力,适宜做空sell; 当价格第一次向下靠近支撑线,或者多次靠近支撑线时,会出现向上的箭头符合,提示有支撑,适宜做多buy; 在数据窗口,会提示各条支撑、压力线的价格数值,出现的箭头符合数值为up、down。
这个指标,适合在所挂的图表里做短线,也即进场开仓后,持仓几根K线柱,然后可以平仓。做多的话,止损可以在支撑线下方,止盈在压力线附近。做空的话,止损可以在压力线上方,止盈在支撑线附近。
本指标涉及的黄金分割系数分别为0.382、0.618、1.618、2.168、4.236,计算得到对应的支撑压力线。 由于MT4的指标数量有限,本指标分成了2个EX4文件,第一个的黄金分割系数为0.382、0.618、1.618,第二个为2.168、4.236,第二个文件名为“Golden Ratio Support Pressure Indicator extend”,可免费下载和使用。
FREE
It is a very simple indicator to display daily loss percentage, open position loss percentage, monthly loss percentage and monthly profit percentage. MT5 version
We assure you that we welcome any suggestions to improve this indicator and make the necessary changes to improve this indicator.
You can contact us via Instagram, Telegram, WhatsApp, email or here. We are ready to answer you.

The Market Sessions Indicator for MT5 helps you predict market turnarounds by detecting major supply and demand areas. These pivot points tend to occur after a new session has started and the previous one is still open. It is also used to gauge how many points or pips the market moves on average during a session. This helps us to place better our take profits and stop losses. The indicator works on all forex pairs, gold, silver, commodities, stocks, indices and any other instrument that your
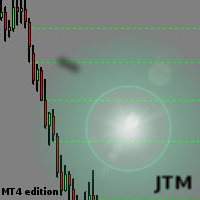
This indicator scanning thorough the history and drawing horizontal rays on all bars untested lows and highs. Fresh supply/demand zones and support/resistance levels will be marked down. It allows to be sure that certain levels is fresh and has not been tested yet. Usually after strong departure price is not retesting base immediately and leaving unfilled orders. There is no inputs, so indicator is ready to go. Version for MT5 is also available here: https://www.mql5.com/en/market/product/3084
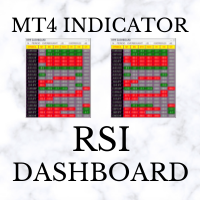
RSI Dashboard uses the value of Relative Strength Index indicator. The parameters can be adjusted via the Edit boxes of this dashboard. The monitoring pairs will be selected by adding to the Market Watch (no need to set prefixes or suffixes) , you can monitor many pairs as you like. This dashboard will check almost popular time frame (M1,M5,M15,M30,H1,H4 and D1). The colors can be customized. We can have a look at many pairs and many time frames without opening the chart. In addition, we can

Описание
Trend Influencer - индикатор который определяет потенциальную динамику влияния трендовых волновых движений на состояние рынка. В основе индикатора лежит значение скользящих средних, скорректированных стандартным среднеквадратическим отклонение. Индикатор отображен в виде основной штрих-пунктирной скользящей средней и сигнальной сплошной скользящей средней. Сигнальная скользящая средняя окрашивается в синий или красный цвет в зависимости от того, какой тип тренда сейчас наблюдается на р

Imbalance / Fair Value Gap (FVG), this is a zone / gap created when the price move with force in a given direction. It identify a zone where the price could potentially go back. This gives perfect targets for your trades.
Imbalance is created from the high and low of 3 candles. When the wicks the of 1st and 3rd candle does not fully overlap the middle one.
This indicator will help you to easily spot mitigated/unmitigated imbalances in your chart.
NEW FEATURE Update: Multi-TimeFrame Feat

Wicks UpDown Target
Choppy movement up and down on the opening range every day. Trading breakouts on London session and New York session is recommended. Wicks UpDown Target is specialized in all forex pairs.
Guideline Entry Strategy Idea:
Step 1 - Breakout Forming (Warning! Trade on London Session and New York Session) Step 2 - Breakout Starting (Take Action on your trading plan) Step 3 - Partial Close your order & set breakeven (no-risk) Step 4 - Target complete Step 5 - Don't trade in

The Candle High Low Exit indicator uses the highest high and the lowest low of a range to draw trailing stop lines (orange under buys, magenta over sells) that advance with the trend until the trend changes direction. Moreover, the trailing stop lines are generated to support the order’s trend direction (long or short): In an upward trend, the long trailing stop line (orange line under buy) appears and advances upward until the close crosses under the line.
In a downward trend, the short tra
FREE
MT5 Version
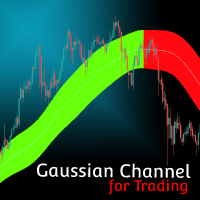
Gaussian Channel MT4 Gaussian Channel MT4 is the first indicator in the market that uses Ehlers Gaussian Filter methods to define trends. Nowadays, this Gaussian Channel is highly known as a method to support HOLD techniques in crypto. If the price is above the channel the trend is strong, if it comes back to the channel this can react as a resistance and indicate the beginning of a bear market (or Winter) if the price breaks below it. Eventhough the use of this channel focuses on

Heikin-Ashi charts , developed by Munehisa Homma in the 1700s. Munehisa Honma was a rice merchant from Sakata, Japan who traded in the Dojima Rice market in Osaka during the Tokugawa Shogunate. He is considered to be the father of the candlestick chart. Th e man who invented the use of candlestick charts for finding and profiting from chart patterns.He was a billionaire trader on those days if we compared his net-worth with todays dollar . Heikin Ashi Scanner is an Multi-Currency and Multi
MetaTrader Маркет предлагает каждому разработчику торговых программ простую и удобную площадку для их продажи.
Мы поможем вам с оформлением и подскажем, как подготовить описание продукта для Маркета. Все продаваемые через Маркет программы защищаются дополнительным шифрованием и могут запускаться только на компьютере покупателя. Незаконное копирование исключено.
Вы упускаете торговые возможности:
- Бесплатные приложения для трейдинга
- 8 000+ сигналов для копирования
- Экономические новости для анализа финансовых рынков
Регистрация
Вход
Если у вас нет учетной записи, зарегистрируйтесь
Для авторизации и пользования сайтом MQL5.com необходимо разрешить использование файлов Сookie.
Пожалуйста, включите в вашем браузере данную настройку, иначе вы не сможете авторизоваться.