• Тип индикатора
  • Цена
     - 
  • Сбросить
Смотри обучающее видео по маркету на YouTube
Как купить торгового робота или индикатор
Запусти робота на
виртуальном хостинге
Протестируй индикатор/робота перед покупкой
Хочешь зарабатывать в Маркете?
Как подать продукт, чтобы его покупали

Технические индикаторы для MetaTrader 4 - 16

icon На основании сигналов технических индикаторов из списка ниже вы сможете принимать решения относительно открытия или закрытия сделки в платформе MetaTrader 4. Работа индикаторов заключается в математическом преобразовании цены и/или объемов финансового инструмента для прогнозирования изменений цен.
High Volume Turns
Nesimeye Oswald
4.7 (10)
YOU CAN NOW DOWNLOAD FREE VERSIONS OF OUR PAID INDICATORS . IT'S OUR WAY OF GIVING BACK TO THE COMMUNITY ! >>>  GO HERE TO DOWNLOAD Most of the time, market reversals / pull backs usually follow volume and price spikes thus  these spikes could be the first indication of an exhaustion and possible reversal/pullback. High volume Turns is an indicator that scans the market for price and volume spikes around over-bought/over-sold market conditions. These spikes when spotted serves as the first ind
FREE
OsMA Arrow MTF
Pavel Shutovskiy
3.92 (12)
Индикатор отображает в виде стрелок пересечение индикатора Скользящая Средняя Осциллятора (Moving Average of Oscillator, OsMA) нулевого уровня. Индикатор является мультитаймфреймовым и отображает сигналы с других временных интервалов В индикаторе есть уведомление при появлении сигнала - всплывающее окно (Alert), отправка на EMail. Параметры Time-frame - Выбор временного интервала для отображения сигналов индикатора. Fast EMA Period - Быстрое EMA – скользящая средняя от цены, экспоненциального
FREE
MT5 Version   Kill Zones   SMT Divergences Order Blocks ICT Multi TF The Order Blocks ICT Multi TF indicator is a cutting-edge tool designed to help traders make better trading decisions based on order block analysis. Order blocks are key levels on a price chart where large institutional traders placed their orders. These levels tend to act as strong support or resistance zones and often signal a potential reversal or continuation of a trend. By identifying these order blocks, traders can gain
PZ 123 Pattern
PZ TRADING SLU
3.75 (4)
Паттерн 123 - один из самых популярных, мощных и гибких графических паттернов. Паттерн состоит из трех ценовых точек: дна, пика или долины и восстановления Фибоначчи между 38,2% и 71,8%. Паттерн считается действительным, когда цена выходит за пределы последнего пика или долины, в момент, когда индикатор строит стрелку, выдает предупреждение, и сделка может быть размещена. [ Руководство по установке | Руководство по обновлению | Устранение неполадок | FAQ | Все продукты ] Четкие торговые сиг
Индикатор HHHC-LLLC использует свечной анализ на основе принципа подтверждения тренда по (бычьим) свечам с более высоким максимумом (Higher High) и более высокой ценой закрытия (Higher Close) и по (медвежьим) свечам с более низким минимумом (Lower Low) и более низкой ценой закрытия (Higher Close). Индикатор не запаздывает, не перерисовывается, не использует усреднение. HHHC-LLLC помогает подтверждать: структуру рынка и уровни - смотрите налево, чтобы увидеть, как они выстраиваются тренды, откаты
Investment Castle Trend Lines MT4
Ahmed Alaaeldin Abdulrahman Ahmed Elherzawi
5 (2)
All traders should know the trend before making their decision when placing the buy or sell orders. The first step always starts with  supply and demand , rising and falling channels , trend lines, engulfing candles etc. All the above contribute to what is called “Price Action” and that is the best and most reliable way in trading and catching the trend and making profits, without stress. The  Investment Castle Trend Line Indicator  will automatically draw the trend lines on the MT4 for you. An
FREE
ATR Exit
BLAKE STEVEN RODGER
4.75 (8)
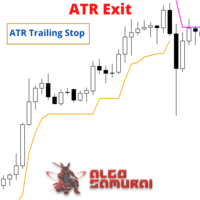
The ATR Exit indicator uses the candle close + ATR value to draw trailing stop lines (orange under buys, magenta over sells) that advance with the trend until the trend changes direction. It uses a multiple of the Average True Range (ATR), subtracting it’s value from the close on buy, adding its value to the close on sell. Moreover, the trailing stop lines are generated to support the order’s trend direction (long or short):  In an upward trend, the long trailing stop line (orange line under bu
FREE
Doji Bar Finder Indicator
Ahmad Ar Abedalaziz Alazaizeh
5 (1)
This automated DOJI BAR FINDER INDICATOR can be utilized to manage trades and identify potential areas of support and resistance for both buying and selling. It is designed to identify zones for Sell/Buy trades and can be effectively used in conjunction with other indicators, such as order block indicators, and more. Currently designed for MT4, it will later be adapted to function on MT5. We also offer the opportunity to customize the robot according to your trading strategy. https://t.me/FXTSPr
FREE
Сглаженный осциллятор основанный на базовых индикаторах DeMarker. Показывает изменчивость направления цены. Может применяться для определении внутридневных точек входа и выхода из рынка. Подходит для использования на всех тайм-фреймах и торговых инструментах. Рекомендуется использовать На M5, M15 и M30. Зеленая линия показывает направление цены вверх, синяя линия показывает направление цены вниз. Красная линия сглаженное представление цены. Входные параметры Period - Период основного инди
FREE
BoxInside MT4
Evgeny Shevtsov
4.56 (9)
Индикатор вычисляет профиль объёма и выставляет метки, соответствующие уровням VAL, VAH и POC, для каждой свечи индивидуально. Особенности работы индикатора Индикатор работает на периодах от M5 до MN, но для вычислений использует исторические данные меньших периодов: M1 - для периодов от M5 до H1, M5 - для периода H4, M30 - для периода D1, H4 - для периода W1, D1 - для периода MN. Цвет и положение меток VAL, VAH и POC на текущей свече считаются корректными только по времени близкому к закрытию
FREE
The PERFECT TREND HIT creates   BUY and SELL  perfect trend   arrow signals based on ADX EMA AND RSI And all filters inbuilt with accurate trend entries. Furthermore, the indicator and template display the trend direction, strength, and trade recommendation for independent price charts. ROCK WITH THE TREND Moreover, it shows the final trade recommendation to BUY or SELL with all filters and displays that information as arrow signals and pop up in the chart.  The indicator works well for new and
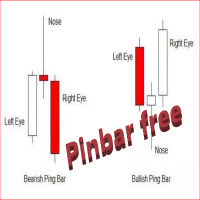
The Free  Pin Bar MT4  indicator  identifies Pin Bars  It will even give you sound or email alerts if want them. If you download it and like it please leave a review! It would be wonderful Pin Bars are purely based on price action as reflected by the candle formations created by Forex price movements. input Parameters are maximum allowed body/length ratio for the Nose bar. Nose body should be position in top (bottom for bearish pattern) part of the Nose bar.  tells the indicator that the Left E
FREE
Strength
Khurram Mustafa
5 (4)
As per name  Strength,  This Indicator is a  affordable trading tool  because with the help of  Popular Developers & Support of M Q L Platform  I have programmed this strategy. I tried to input different types and different periods of Calculation regarding Support Resistance, Trends, Trend lines, Currency Strength, Oversold and Overbought Indications for good results. Furthermore, I have also care about  Adjustable Settings  So Trader can easily get in touch with market in another way also. What
FREE
Donchian Channels Bands
Jonathan Destailleur
4.2 (5)
Price Channels are also known as Donchian Channels being named after Richard Donchian.  They use the highest and lowest price of a set number of periods to create an upper and lower channel or envelope around the price. The upper channel shows the high of the number of periods chosen. The lower channel shows the low of the number of periods chosen. For example, the screenshot shows the Price Channels using 320 periods. The upper channel in the screenshot shows the highest high of the previous 3
FREE
The "Easy Ichimoku Wave Meter" indicator is a basic tool to automatically determine Waves according to Ichimoku! The indicator gives the possibility to simultaneously apply the Wave Theory, Time Theory and Target Price Theory according to the "Little Ichimoku" strategy developed by Sense Hosoda on the MT4 platform.  The use of this tool allows not only novice traders to instantly (fully automatic) determine the waves and their rapid interpretation, it also allows to automatically measure the p
Informative & optimized Zigzag, Accumulated volume, Price change   A rewrite of the traditional zigzag tool with new additions. Features:- Optimized code Displays accumulated volume between peaks Displays price change between peaks Usage:- Identify trend swings Identify high volume swings Compare price changes between swings Drawing Fibonacci tool on strong price change or high volume swings
FREE
PZ Pivot Points
PZ TRADING SLU
4.64 (14)
Ищете качественный индикатор точек разворота? Значит, PZ Pivot Points - это то, что вам нужно! Он строит уровни не только за текущий день. Он строит исторические уровни для проведения тестирования на истории Вы сами выбираете таймфрейм Цвета и размеры настраиваются Что такое "точки разворота"? Анализ точек разворота зачастую применяется совместно с расчетом уровней поддержки и сопротивления, как и в случае с анализом трендовых линий. При анализе точек разворота первые уровни поддержки и сопрот
FREE
PZ Market Profile
PZ TRADING SLU
3.91 (11)
Индикатор профиля рынка, способный предоставить "рентгеновское видение" деятельности рынка, выделяющий наиболее важные ценовые уровни, области значений и контрольное значение дневной торговой сессии. Просто в понимании и использовании Понимает динамику рынка с легкостью Автоматический выбор таймфрейма Определяет зоны торгового значения и отбрасывает другие Полезен в любых рыночных условиях Эффективен для любой торговой стратегии Включает две цветовые схемы Параметры Параметр "Sessions to count
FREE
Buy Sell Zones   Simple indicator for BUY / Sell Zones moving Buy and Sell zones : Closest zone is wide and clear : Red for Sell zone , Green for Buy zone >>> old far zones are in bold lines :::BUY Zones (GREEN) appear only in UP Trend and disappear in DOWN Trend :::SELL Zones (RED) appear only in DOWN Trend and disappear in UP Trend input parameters ::: index bars : bars range for zone calculation levels : number of zones  Up move/Down move arrows mail and message Alerts !! used on any symbol u
This indicator will detect harmonic patterns that are drawn on the chart by manual and automatic methods. You can see user manual from this link: https://www.mql5.com/en/blogs/post/719257 There is a free version (it detect only Gartley and Nenstar Patterns) to try this product. You can buy the full MT4 version from: https://www.mql5.com/en/market/product/104689 Notes When you use this indicator and change the settings, add indicators like Moving Average or Bollinger Bands, this indicator will
FREE
The Slope Scanner is a Multi-Currency, Multi-Timeframe scanner of The Slope indicator. It calculates the slope of the price, and displays its direction for each symbol and each timeframe on a display board. Check Video Below For Live Trading Demonstration. Get a 7-Day Free Trial Version:  Click  Here  (Full Access to The Indicator for 7 Days) Key Features: Allows you to see Multiple Murrency signals from one chart Calculates the slope of the Pair on All Timeframes Get a Currency Slope Strength
Please read before you purchase : - We don't have buyer's detail when purchase was made. In order to get the bonuses, you need to contact me via product comment ( not product review). That way I will contact you back via mql message asking for email. - Please make sure you enable receiving message from non-friend list, otherwise I cannot message you for email. This indicator is not just about Smart Money Concept, with lots of features which I believe could help you understand the concept. Not on
Indicator ini berdasarkan Gain ADX - Follow Trend - Disertai Pivot, Support & Resistant Daily Dengan indicator ini semoga menjadikan indicator yang porofit able, selama mengikuti signal yang tampil, apabila berwarna Hijau siap2 untuk Buy, dan berwarna Merah siap2 untuk Sell. Akan tampil signal Sell/Buy di saat gain mencukupi, baik TF Kecil maupun TF Besar TF Besar / High TF adalah Trend Kuat TF Kecil / Low TF adalah Trend Lemah Open Posisi pada High TF, signal akan menunjukkan Sell/Buy.
FREE
Risk Reward Panel Demo
HESAMEDDIN ABDOLRAHIM RAHI
1.5 (2)
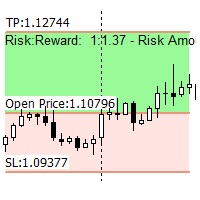
This is a useful tool to plan a trade risk to reward visually. The indicator is very simple to use with minimum settings.  Long or Short You can use the indicator for both long and short positions.  Lot Size Calculator You can also use this indicator as a lot size calculator. If you set the risk amount the indicator will calculate the lot size for you based on the stop loss line. You do not need to calculate the lot size manually.  Free Version Free versions works fully on EURUSD pair. For oth
FREE
False Breakout Stochastic to be used with our Elliott Wave Indicator as part of the overall strategy on trading the 5th wave. As we cannot upload multiple files, we have listed this separately. False Breakout Stochastic is best used as a confirmation tool rather than the sole signal indicator The Elliott Wave Indicator Suite is designed around a simple but effective Swing Trading Strategy. The Indicator Suite is great for Stocks, Futures and Forex trading on multiple timeframes You can find the
FREE
Модифицированный индикатор фракталов. Работает как оригинальный индикатор Билла Вильямса, но с возможностью изменять радиус вершины, а не работать только со стандартным радиусом в 2 бара. Если рассказывать простыми словами, то индикатор проверяет вершину и если она минимальна/максимальна в указанном радиусе, то он помечает ее соответствующей стрелкой. Преимущества Возможность изменять радиус. Использовать для построения линий поддержки и сопротивления. Использовать для построения трендовых канал
FREE
DR and IDR
Barend Paul Stander
5 (2)
Defining Range ( DR ) and Implied Defining Range ( IDR  ) indicator Show DR and IDR ranges on the chart for   Regular , Overnight and After Sessions for more information how DR and IDR work and the high probability  watch :  https://www.youtube.com/@themas7er or   https://twitter.com/IamMas7er Remember to set set your chart TimeZone when you attach indicator to the chart under indicator settings / inputs Volume Imbalance : https://www.mql5.com/en/market/product/91165?source=Site+Pr
FREE
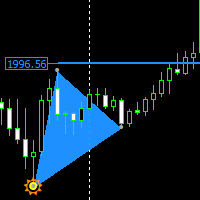
Non-repaint price action pattern based indicator works on all timeframe  the indicator is based on a 123 Triangle pattern that happens everyday on the market  the indicator will point out the pattern for you and you can turn on Fib level to see your take profit. Blue triangle is a buy signal Red triangle is a sell signal horizonal blue and red lines is an indication to place your trail stop loss one price has reached that area only entry when the triangle has fully formed
This indicator shows the direction of the trend and trend change. Ganesha Trend Viewer is a trend indicator designed specifically for gold and can also be used on any financial instrument. The indicator does not redraw. Recommended time frame H1. Ganesha Trend Viewer  is perfect for all Meta Trader symbols. (currencies, metals, cryptocurrencies, stocks and indices..) MT5 Version here! Parameter setting MA Short Period  ----- Moving Average short period MA Long Period   ----- Moving Average l
FREE
Download the USDJPY free version   here. Scalping Strategy BUY    SELL   Having a strategy in the market is one of the main conditions for trading. The presence of various and complicated indicators and tools sometimes makes trading difficult, and the user gets confused after trying various methods and gets stuck in a loss cycle, the result of which is usually clear. This indicator is a simple strategy based on the detection of pivots and short-term trends, which helps you to easily trade i
FREE
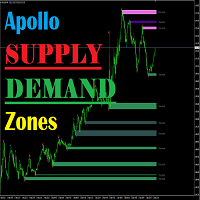
Apollo Supply Demand Zones - это индикатор, который рассчитывает уровни поддержки и сопротивления. Индикатор будет полезен абсолютно всем трейдерам, вне зависимости от того какую стратегию они используют. Данный индикатор может стать одним из основных элементов вашей торговой системы. Индикатор рассчитывает уровни как на текущем тайм фрейме, так и может работать в режиме MTF, отображая уровни с более высокого тайм фрейма. Данный индикатор может использоваться абсолютно на любом тайм фрейме и с л
Volume Champion — индикатор, который анализирует объем рынка и отображает данные в виде гистограммы. Вам не нужно углубляться в теорию анализа рынка. Вы можете просто следить за показаниями индикатора. Столбцы индикатора показывают потенциальное направление движения цены на основе анализа структуры объема рынка. Индикатор может использоваться на любом тайм фрейме. Наибольшая точность достигается на старших тайм фреймах.  СИГНАЛЫ НЕ ПЕРЕРИСОВЫВАЮТСЯ! Технически индикатор можно использовать и с др
"Turbo Helper for scalping" - полностью готовая торговая система. Показывает трейдеру стрелкой на графике когда нужно открывать ордер и в каком направлении. Так же показывает трейдеру квадратным символом, когда сделку нужно закрыть. После этого индикатор выводит на график предположительное количество пунктов по сделке. Это значение может немного отличаться, так как индикатор не учитывает реальный размер спреда и свопа Вашего брокера. Но размер спреда, для более точного подсчета можно указывать в
The UNIVERSAL DASHBOARD indicator will eliminate the need of using dozens of indicators on dozens of charts. From one place you can monitor all the pairs and all the timeframes for each of the following indicators: MACD STOCHASTIC WPR RSI CCI You can also use any Custom indicator in the dashboard as long as it has a readable buffer. With a single click you can quickly navigate between charts, pairs and timeframes. Alerts will provide clear indication about what happens for your favorite pairs on
FREE
Draw and Sync Objects Multiple Charts 1. Draw objects by key press. ( You must: 1.  Press Function key =>   2.   Click where you want to draw =>   3.   Draw it =>   4.   Press ESC to complete). (If you don't want to draw after pressing function key, you must press ESC to cancel). 2.   Developing  : Sync selected objects to multiple charts by button. 3. Developing: Hide objects that do not belong to the current symbol (Objects drawn with this indicator will belong to the symbol they are plotted
FREE
FTU Idioteka Indikator prednaznachen dlya platformy MT4, yego mozhno ispol'zovat' otdel'no, no luchshe vsego sochetat' s drugimi indikatorami ili strategiyami. Sochetayet v sebe razlichnyye indikatory, takiye kak macd, adx, dlya risovaniya strelki, ukazyvayushchey na vkhod ili izmeneniye trenda. Posmotrite korotkoye vstupitel'noye video na YouTube: https://youtu.be/lCRJ3mFNyOQ Osobennosti indikatora: Prodat' i kupit' strelki Vizual'noye i zvukovoye opoveshcheniye Prodolzheniye trenda/ranniy sig
FREE
"Capture the sleeping and waking alligator." Detect trend entrance/exit conditions - this indicator can also be tuned according to your trading style. You can adjust a confidence parameter to reduce false positives (but capture less of the trend). This is based on a modification of the Alligator indicator by Bill Williams, an early pioneer of market psychology.  2 main strategies: either the " conservative"  approach to more frequently make profitable trades (at a lower profit), or the " high r
FREE
PLEASE TAKE NOTICE: This indicator is in current development. final version will be free. This is a simple indicator that uses 3 timeframes in its formula to create Possible buy and sell signals. This indicator is optimized for the M1 timeframe Only. It has 2 types of Alerts: Push Notifications Audio Alerts UPDATES: 3/19/24: Still testing the final code Troubleshooting: When loading the indicator, if you don't see the arrows on the current chart that means that MT4 has not loaded all the h
FREE
Индикатор анализирует указанное количество свечей и строит уровни Фибоначчи на основе максимума-минимума. Поскольку уровни перестраиваются, то нас интересует правая часть диапазона. Цена магнитит к уровням и реагирует на касание. Используйте этот инструмент для поиска точки входа по тренду после коррекции. Если слева мы видим, что уровни идеально встали, то мы можем предположить, что нашли окончание движения в крайней точке. Все линии прорисовываются через буферы или объекты (на выбор). Входны
FREE
Highly configurable Macd indicator. Features: Highly customizable alert functions (at levels, crosses, direction changes via email, push, sound, popup) Multi timeframe ability Color customization (at levels, crosses, direction changes) Linear interpolation and histogram mode options Works on strategy tester in multi timeframe mode (at weekend without ticks also) Adjustable Levels Parameters: Macd Timeframe:  You can set the lower/higher timeframes for Macd. Macd   Bar Shift:  you can set the
FREE
Индикатор для скальпинга 2 в 1. Покупая этот индикатор, Вы получаете в подарок автоматического робота! Автоматическая система поиска точек разворота цены. Индикатор точками на графике валютной пары показывает вероятноные точки разворота движения цены. Красная точка указывает на разворота движения внизу, а синяя точка указывает на разворот движения цены вверх. Индикатор отлично подходит для торговли внутри дня по стратегии скальпинга. Идеально сочетается с канальными индикаторами. Когда канальны
A forex   pivot point   strategy could very well be a trader’s best friend as far as identifying levels to develop a bias, place stops and identify potential profit targets for a trade. Pivot points have been a go-to for traders for decades. The basis of pivot points is such that price will often move relative to a previous limit, and unless an outside force causes the price to do so, price should stop near a prior extreme. Pivot point trading strategies vary which makes it a versatile tool for
FREE
Индикатор Currency Strength Matrix (CSM) показывает текущую силу основных валют на нескольких таймфреймах, позволяя сортировать валюты по силе и обнаруживать потенциально прибыльные пары. Индикатор идеален для скальпинга и во время резких сильных движений. Как она работает? CSM сравнивает значение текущей скользящей средней с такое же скользящей средней на предыдущей свече для всех 28 пар и 9 таймфреймов, формируя таблицу силы всех отдельных валют. Затем валюты сортируются по силе на определен
FREE
Мультивалютный и мультитаймфреймовый индикатор ZigZag. Отображает текущее направление рынка, высоту последнего движения, количество баров в этом движении и пробитие предыдущей точки ЗигЗага. В параметрах вы можете указать любые желаемые валюты и таймфреймы. Также панель может отправлять уведомления при изменении направления ЗигЗага или когда произошел пробой предыдущей точки. По клику на ячейке с периодом будет открыт данный символ и период. Параметры Depth — минимум свечей, на котором инди
This indicator is a simple trend line indicator. The upper trend line is the highest price of 60 past candlesticks, the highest price of 30 past candlesticks, The bottom line is the trend line that connects the lowest price of 60 past candlesticks and the lowest price of 30 past candlesticks. *The color of the trend line is white. Notes This indicator is created with the above configuration, so if the highest and lowest prices of the past 60 candlesticks and 30 candlesticks are the s
FREE
Visual correlation
Andrey Tatarinov
4.17 (6)
Поведение разных валютных пар взаимосвязано. Индикатор Visual Correlation позволяет на 1 графике отображать разные инструменты с сохранением масштаба. Вы можете определить положительную, отрицательную корреляцию или ее отсутствие. Некоторые инструменты начинают движение раньше остальных. Такие моменты можно определить при наложении графиков. Для отображения инструмента на графике в поле Symbol необходимо ввести его название. Версия для МТ5  https://www.mql5.com/ru/market/product/109155
FREE
Key level breaker block
Presley Annais Tatenda Meck
5 (4)
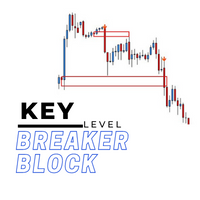
The key level breaker block indicator automatically draws breaker blocks for you on the chart. Breaker blocks are, in short, failed order blocks, but create strong support and resistance zones when price comes back to re-test them. Advantages  The key level breaker block DOES NOT RE-PAINT, giving you confidence when a signal appears and also helps when looking back.  The key level breaker block includes an on/off button on the chart to easily keep the charts clean after analysis by just o
Индикатор Camarilla Pivots Historical строит на графике исторические данные по уровням пивотов Камарилья. Уровни пивотов Камарилья были разработаны в 1989 году Ником Скоттом. Эти уровни используются в качестве основных уровней поддержки и сопротивления при внутридневной торговле. Уровни вычисляются по следующей формуле: R4 = C + RANGE * 1.1/2 R3 = C + RANGE * 1.1/4 R2 = C + RANGE * 1.1/6 R1 = C + RANGE * 1.1/12 PP = (HIGH + LOW + CLOSE) / 3 S1 = C - RANGE * 1.1/12 S2 = C - RANGE * 1.1/6 S3 = C -
FREE
Top Gun Oscillators
Safwan Rushdi Khalil Arekat
5 (3)
Note : New in 1.6: the indicator now exports the trade signal (but not displayed). Go long with light blue. Go short with red. Exit otherwise. Signal to be imported to your EA using iCustom. This indicator provides Best of the Best linear filter momentum oscillators that I am aware of (Low Pass Differentiators, LPD's) . All of them are  recent developments by this developer, or other researchers. The oscillator line is the first buffer of the indicator, and can be called  in other indicators or
FREE
You can find full version here: Harmonic Pattern Scanner MT4 Harmonic Pattern Scanner MT5 Introduction Harmonic Patterns are best used to predict turning point. Harmonic Patterns give you high win rate and high opportunities for trade in during one day. This indicator detects the best and successful patterns base on   Harmonic Trading   books by   Mr. Scott M.. Main Features Detect the best and     most successful patterns : Gartley, Bat, Crab, Butterfly, Cypher, Shark, Alt_Bat, Deep_Crab Easy-
FREE
This comprehensive technical indicator calculates and plots up to 3 moving averages with 3 different periods. By employing three moving averages of distinct lookback periods, the trader can confirm whether the market has indeed experienced a change in trend or whether it is merely pausing momentarily before resuming its prior state. SX Golden MA Pack  for MT5 is available   here . The shorter the moving average period, the more closely it tracks the price curve. When a security initiates an upt
FREE
Engulf Detector
Amirhossein Ghasemi Moroodi
После 7 лет я решил бесплатно поделиться некоторыми своими индикаторами и экспертами. Если они вам понравятся, пожалуйста,   Поддержите 5-звездочным рейтингом! Ваш отзыв поможет продолжать выпускать бесплатные инструменты! Смотрите другие мои бесплатные инструменты и мои живые сигналы здесь   здесь _________________________________ Детектор Поглощения - Упрощенный Индикатор Трейдинга Откройте для себя Детектор Поглощения, простой инструмент, созданный на MQL4 для идентификации мо
FREE
Pivot Classic, Woodie, Camarilla, Fibonacci and Demark   Floor/Classic Точки разворота или просто развороты полезны для определения потенциальных уровней поддержки/сопротивления, торговых диапазонов, разворотов тренда и настроений рынка путем изучения максимума, минимума и значений закрытия актива. Точки разворота Floor/Classic можно рассчитать следующим образом. Pivot Point (P) = (High + Low + Close)/3 S1 = P * 2 - High S2 = P - (High - Low) S3 = Low – 2*(High - P) R1 = P * 2 - Low R2 = P + (H
FREE
А. Что такое A2SR?   * Это опережающий технический индикатор (без перерисовки, без запаздывания) . -- Учебники : -- на https://www.mql5.com/ru/blogs/post/734748/page4#comment_16532516   -- и https://www.mql5.com/ru/users/yohana/blog A2SR имеет особую технику определения уровней Поддержки (спроса) и Сопротивления (предложения). В отличие от обычного способа, который мы видели в сети, A2SR имеет оригинальную концепцию определения фактических уровней SR. Оригинальная техника не была взята из Инт
Индикатор предназначен для обнаружения высоковероятностных моделей разворота: двойная вершина/дно с ложными прорывами . Это бесплатная версия индикатора: https://www.mql5.com/ru/market/product/26371 Бесплатная версия работает только на EURUSD и GBPUSD! Концепция индикатора Ultimate Double Top/Bottom и профессиональный способ его применения подробно описаны в блоге (на английском языке): Professional Trading With Double Tops/Bottoms And Divergences! Представленное видео показывает максимальную пр
FREE
Индикатор для бинарных опцыонов стрелочный прост в использовании и не требует настройки работает на всех валютных парах акцыях крипто валюте сигнал на покупку синяя стрелка вверх  сигнал на продажу красная стрелка в низ  советы не стоит торговать во время новостей и за 15-30 минут перед их выходом так как рынок слишком волотилен и очень много шума  входить в сделки стоит на одну или две свечи от текущего периода ( рекомендуется на 1 свечу ) таймфрейм до м 15 рекомендуемый мани менеджмент фиксир
Idea: RSI ( Relative Strength Index) and CCI ( Commodity Channel Index ) are powerfull to solved the market.  This indicator has Smoothed Algorithmic signal of RSI and CCI. So that, it separates the market into buy and sell zones, these areas are marked with arrows, red for downtrend, green for uptrend. This algorithm has the effect of predicting the next trend based on the historical trend, so users need to be cautious when the trend has gone many candles. Please visit screenshots
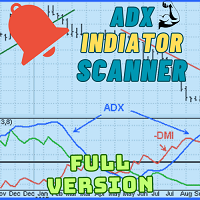
Welcome to advanced trading with the ADX Multicurrency Scanner! Elevate your trading experience with our powerful MT4 indicator, designed for seamless currency scanning and real-time insights. Key Features: Effortless Multicurrency Scanning: Unlock the full potential of the ADX Multicurrency Scanner by effortlessly scanning multiple currencies. Receive instant alerts when specific conditions are met, ensuring you stay ahead of the market and capitalize on every trading opportunity. Comprehensiv
This Indicator uses Center of Gravity (COG) Indicator to find you the best trades. It is a reversal based Swing Indicator which contains an  Arrows Indicator. That you can buy here from Metatrader Market. And a scanner Indicator. Free Download here: https://abiroid.com/product/abiroid-sway-cog Scanner needs arrows indicator to run. Copy scanner ex4 in same folder as your Arrows Indicator: MQL4/Indicators/Market/ All extra indicators and templates also available in above link. Base Strategy:
Volume Horizon - это индикатор горизонтальных объёмов, предоставляющий возможность наблюдать за плотностью объёмов участников рынка в различных ценовых и временных интервалах. Гистограммы объёмов могут быть построены на основе восходящих или нисходящих волн рынка, а также по отдельным барам. Этот инструмент позволяет более точно определять моменты для открытия или закрытия позиций, опираясь на уровни максимальных объёмов или средневзвешенные цены по объёму. Что делает Volume Horizon уникальны
Индикатор R 3MA Cross — это популярный трендовый индикатор с предупреждениями, основанными на пересечении трех скользящих средних, он состоит из более быстрой, средней и более медленной скользящих средних. Ключевые моменты Предупреждение о покупке появится, когда более быстрая скользящая средняя пересечет среднюю и более медленную скользящую среднюю вверх. Оповещение о продаже возникает, когда более быстрая скользящая средняя пересекает среднюю и более медленную скользящую среднюю вниз. К
FREE
YOU CAN NOW DOWNLOAD FREE VERSIONS OF OUR PAID INDICATORS . IT'S OUR WAY OF GIVING BACK TO THE COMMUNITY ! >>>    GO HERE TO DOWNLOAD The popular saying in forex  "The Trend is your friend"   has always stood the test of time because it is valid statement for every generation of traders and in every market. Most successful traders do not fight against the trend but lend to flow with it.  Sometimes finding the best pair to trade can be a daunting task even when you have a good strategy . Som
FREE
This all-in-one indicator displays real-time market structure (internal & swing BOS / CHoCH), order blocks, premium & discount zones, equal highs & lows, and much more...allowing traders to automatically mark up their charts with widely used price action methodologies. Following the release of our Fair Value Gap script, we received numerous requests from our community to release more features in the same category. //------------------------------------// Version 1.x has missing functions + PDAr
SPREADEX e' un indicatore per MT4 e MT5 che indica la distanza dell'ASSET dal GP. il GP e' il prezzo del vero valore dell'ASSET sottostante ottenuto per stima. Il GP e' come una calamita, attira il prezzo dell'ASSET con alta probabilita' ed all'interno della stessa giornata di trading. Quindi SPREADEX indica quali sono gli asset piu distanti dal GP al momento in tempo reale. Fornendo un punto di vista al TRADER su quali asset concentrarsi e cercare eventuali segnali di inversione dei prezzi per
FREE
The three white soldiers and the three black crows candlestick patterns are reversal patterns that predict a change in the direction of a trend.  The pattern consists of three consecutive long-bodied candlesticks that open within the previous candle's real body and a close that exceeds the previous candle's.  It's important to note that both formations are only valid when they appear after a strong uptrend or a downtrend, while their efficiency decreases in choppy markets. Inputs AlertOn   - e
FREE
Anchored Volume Weighted Average Price (AVWAP, or Anchored VWAP). Tells you who is in control, the buyers or the sellers. Better than all other moving averages because it adds weight to the traded volume. This technique was made popular by Brian Shannon of Alphatrends. It is calculated by multiplying typical price by volume, and the dividing by total volume. It is very simple to use. 1. Press a number from 1 to 9 on the keyboard, then click the chart where you want to anchor the VWAP. 3. Hold C
Order Book
Thomas Bradley Butler
В сочетании с диаграммой Delta Footprint Chart вы получите полное представление о профиле объема рынка: https://www.mql5.com/en/market/product/94153 Индикатор «Книга ордеров» отображает гистограмму на ценовом графике, представляющую кластеры объема спроса и предложения.   Индикатор анализирует исторические ценовые данные и рассчитывает кластеры объемов спроса и предложения для каждого ценового уровня в пределах заданного количества баров. Кластеры объема предложения показаны синим цветом, а
The 5X target indicator is an indicator that plots the optimal entry zone and the target for the trading day. It also plots a level where the stoploss can be moved to breakeven for a risk free trade which is 2X. This indicator has time window inputs. The default settings are from 02:00 to 19:00 CET+1 time zone. This indicator is based used with a direction bias for the day. I post the direction bias for several pairs in the comments section. Added a new feature Time Zone to help trade the highes
MACD Intraday Trend PRO - это индикатор, разработанный на основе адаптации оригинального MACD, созданного Джеральдом Аппелем в 1960-х годах. За годы торговли было замечено, что, изменяя параметры MACD с пропорциями Фибоначчи, мы достигаем лучшего представления непрерывности движений тренда, что позволяет более эффективно обнаруживать начало и конец ценового тренда. Благодаря своей эффективности в обнаружении ценовых тенденций, также можно очень четко идентифицировать расхождения вершин и ос
Accuracy Meter
Ashkan Hazegh Nikrou
5 (1)
Метр точности Введение: Accuracy Meter - это мощный инструмент для определения% выигрышных стратегий, чтобы показать вам все точки входа и выхода из сделок, такие как этот мета-тестер стратегий, вы можете иметь простой тестер стратегий в качестве индикатора на графике, прикрепить его к разным парам и таймфреймам и выяснить процент точности вашей стратегии, измените стоп-лосс и риск на коэффициент вознаграждения и посмотрите, как он может повлиять на вашу идею торговли Accuracy Meter - это ваш
FREE

MetaTrader Маркет позволяет максимально безопасно покупать программы для платформы MetaTrader. Вы можете скачать демо-версии понравившихся роботов и индикаторов прямо из терминала и проверить их в тестере стратегий.

Протестируйте программы в различных режимах перед покупкой для получения максимального представления о продукте и оплатите понравившийся продукт через платежную систему MQL5.community.

Платежная система MQL5.community обеспечивает оплату продавцам, а возможность тестирования программ в различных режимах позволяет покупателям получить максимальное представление о продукте.