Смотри обучающее видео по маркету на YouTube
Как купить торгового робота или индикатор
Запусти робота на
виртуальном хостинге
виртуальном хостинге
Протестируй индикатор/робота перед покупкой
Хочешь зарабатывать в Маркете?
Как подать продукт, чтобы его покупали
Технические индикаторы для MetaTrader 4 - 28

Free Scalping System представляет собой полноценную торговую систему для максимально эффективной торговли в любых рыночных условиях на всех временных масштабах.
Система состоит из двух основных блоков:
1. Блок определения тренда, рассчитывающий динамические уровни сопротивления и поддержки. Для этого блока доступна функция автооптимизации.
2. Блок определения отклонения цены от среднего значения, основанный на большом наборе линий регрессии разного периода для получения статистически достов
FREE

Double Exponential Moving Average ( DEMA ) is a moving average (MA) that gives the most weight to recent price data.Like exponential moving average (EMA), it is more reactive to all price fluctuations than a simple moving average (SMA) and so DEMA can help traders to spot reversals sooner, because it is faster responding to any changes in market activity. DEMA was developed by Patrick Mulloy in an attempt to reduce the amount of lag time found in traditional MAs. ( TASC_Feb. 1994 ). DEMA can al
FREE

Описание Продукт основан на индикаторах RSI и Momentum. Он также учитывает скользящие средние этих двух индикаторов. Настройки всех трех индикаторов редактируются. Стрелки не перерисовываются, так как индикатор использует только подтвержденные значения и ждет закрытия свечи перед тем, как вывести на график стрелку. Индикатор также может выдавать алерты при появлении стрелок. Предусмотрены три типа алертов - всплывающие, отправляемые по электронной почте и push-уведомления на мобильные устройства
FREE

Day Points
Indicadtor that shows the points considered important for X days. (Open,Close, High, Low) Used a lot by those who do day trade. These points can be used for decision making by a trader. You will choose the amount of days ago for it to show.
Settings High/Low/Close/Open Show - True/False. Days - Number of days that will show on the chart. Color - Line Color. Style - Line Style.
FREE

Current Pips and Money Profit This indicator displays the results of the currently open position on the graph. Result in pips and in the invoice currency. Thanks to this, you can enlarge the chart to the entire screen and have control over the result of trading without opening a terminal window which takes a space of a screen. The display positions of this data can be adjusted at the user's discretion and colors also.
FREE

Сбалансированный вход VArmadA
Простой, но мощный фрактальный индикатор поддержки/сопротивления
Работает с таймфреймами 1Н и выше и протестирована на всех основных парах. Обратите внимание на сигнал: Стрелка, указывающая на длинную или короткую запись.
Как это работает:
Стрелки указывают на обратную поддержку/сопротивление. Стрелка вверх означает длинную - стрелка вниз указывает на короткую сделку.
Инструкции:
- IndicatorLong/IndicatorShort: Выберите цвета для стрелок данного
FREE

The M.O.D.E stands for " Multiple Oscillator Divergence Exit ". It is an indicator which signals a divergence between the price, and multiple oscillators. It is initially an exit indicator because it signals the weakening of a trend, but it could be used as an entry signal if used analytically Key Features: Check many divergences at once Non repainting Sends Alerts and Push Notifications You could load the M.O.D.E onto a single chart, and be able to see the divergences happening on multiple os
FREE
Top and Bottom Scalper
BINARY AND FOREX
The signals indicate strong reversal points (Tops/bottoms)- The indicator gives accurate signals on any currency pairs and instruments. It also has a setting for adjusting the frequency of the signals. It is further strengthened and made robust by the support and resistance zones. There are different qualities of zones as per robustness.
Inputs ZONE SETTINGS; BackLimit - default is 10 000. Check the past bars for formations. First Time Fram

Этот простой индикатор использует Ichimoku Kinko Hyo для поиска сильных и слабых валют в составе пары, чтобы обнаружить тренд. Индикатор также выдает сигналы на покупку и продажу на основе стандартного отклонения оборота вместе с силой валюты. Если цена выше как дневного облака (кумо), так и 26-дневной линии Kijun-sen, валюта считается сильной. Аналогично, если цена ниже как дневного облака, так и линии Kijun-sen, валюта считается слабой. Сопоставляя сильную и слабую валюты, советник ищет тренд.
FREE

The MT4 indicator that we are describing is designed to provide traders with an alert, notification, and email when Fibonacci levels are crossed. The Fibonacci levels are calculated based on the zigzag indicator, which helps to identify potential trend reversals in the market. When the indicator detects that a price has crossed a Fibonacci level, it will trigger an alert and send a notification to the trader's MT4 mobile app. Additionally, the indicator can be configured to send an email to the
FREE

Технически индикатор представляет собой разницу двух фрактальных адаптивных скользящих средних. Фрактальная адаптивная скользящая средняя (FRAMA) — это умная адаптивная скользящая средняя, разработанная Джоном Элерсом. FRAMA учитывает изменения цен и точно следует за уровнем цены, оставаясь прямой в моменты колебания цены. FRAMA использует тот факт, что рынки фрактальны и динамически корректирует ретроспективный период, основанный на этой фрактальной геометрии. Индикатор имеет возможность отпр
FREE

Наша команда наконец-то добилась ожидаемого результата.
Мы создали искусственный интеллект для торговли бинарными опционами. Не верите? Многие пользователи уже оценили его положительно. Результаты вас тоже удивят. Этот индикатор транслирует сигналы для бинарного опциона через телеграм-канал. Все сигналы надежные и качественные.
Читайте далее !!! ВНИМАНИЕ !!!
Вы и не мечтали !!! КАК ЗАРАБАТЫВАТЬ уже прямо сейчас? Самый успешный сигнальный канал для бинарных опционов С нами зара
FREE

+ 2 бонусные стратегии! + Алерты! Рекомендую посмотреть моего советника - Night Zen EA Индикатор объединил в себе наиболее популярные стратегии по скользящим средним: Простое пересечение скользящих средних. Пересечении скользящих средних относительно положения более медленной скользящей средней. 2 бонусные стратегии: Пересечение быстрой скользящей средней с расчетом цен открытия медленной скользящей средней с расчетом цен закрытия с учетом более медленной скользящей средней. (Настройки данной
FREE

Индикатор сконвертирован из кода другого языка программирования программистом "sbtnc". MQL-версия упрощена, чтобы быть более полезной за счет меньшей сложности настроек.
Есть несколько подсказок от программиста по поводу индикатора:
Индикатор отслеживает и сообщает процент появления дневных вершин и низов по времени суток. В определенное время в течение торгового дня рынок разворачивается и отмечает максимум или минимум дня. Вершины и низы крайне важны при входе в сделку, поскольку они опр
FREE

Have you ever wondered which currency is the strongest at any particular time? Or which currency pair is trending the most. Well, the currency strength meter helps with just that. It compares USD , EUR , AUD , CHF , GBP , CAD and NZD depending on the timeline you have chosen in settings, and ranks them on the number of pips each has moved compared to the rest. N/B: All currency charts of the above pairs must have loaded. You can do this by highlighting all major and minor currencies
FREE

Индикатор Candle GAP является важным инструментом для трейдеров, использующих стратегии Gap Trading , поскольку он автоматически определяет свечные разрывы для каждого дня недели. Гэп относится к разнице ценовых уровней между закрытием и открытием двух последовательных дней. Этот индикатор распознает четыре типа гэп-паттернов: обычный, прорыв, продолжение и истощение. Включив этот индикатор в любой график, трейдеры могут проверять свои сигналы и улучшать свои торговые решения. Одной из
FREE
An indicator for analyzing different currency pairs simultaneously Forex is a complex market that requires several currency pairs to be analyzed simultaneously Determine the number of currency pairs yourself Determine the currency pair you want to analyze to analyze 4 of the most important and similar currency pairs at the same time. For direct and simple analysis, some currency pairs have changed (EURUSD>>>USDEUR) Do not doubt that to succeed in this market, you must analyze several currency pa
FREE

This indicator graphically displays profit ($),risk/reward and % of risk according SL&TP Open orders on Current Symbol. when you open orders on current symbol and set StoplLoss and TakeProfit this indicator automatically calculate Risk/Reward and calculate %risk Of Equity Account that your order get stop Loss. If you trade on several symbols at the same time, you can install the indicator on each one separately and see the relevant calculations on each one.
FREE

The ADX Indicator is known to be used to determine the trend direction. Not only that, but it also has deviation (+DI and -DI) that determine the direction of the trend as well. The role of the indicator is to spot the trend and its direction and generate signals accordingly.
Indicator Settings: - ADX period : default is 14 periods (it works best with the timeframe H1). - Signal Width : the size of signals arrows. - Signal Distance : the distance of the signal arrow from the candle. - Signal c
FREE

Th3Eng HistoMaster indicator Free Histogram Indicator to detect the current trend direction. The indicator is based on CCI indicator. Also draw arrows when it detect the trend is strong buy or strong sell, with Alerting system (Popup with sound, Email alerting and mobile notification). Also draws a dashboard shows all Time-Frames' current signal.
Requirements
works with all pairs, stocks, CFDs and crypto currencies. works with all Spreads works with all Account types works on all Time-Frames
FREE

MACD is well known indicator that still can be use for prediction where price will go next few minutes, hours or even weekly With colored bar of Macd, your eyes can easily catch when color is changed based what market price movement to find any early trend on market. here is the parameter of the indicator: TF_MACD , default is 1 Hour , this mean you can see clearly MACD of 1 Hour TimeFrame on Lower TimeFrame. InpPrice , default is Price Close , this is original MACD parameter from Metaquotes st
FREE

Технический индикатор, в реальном времени осуществляет поиск свечей, которые своим размером превышают заданный в настройках и дает об этом сигналы. Как правило, такие аномально большие свечи появляются либо в начале сильных импульсов, либо на окончании направленного движения цены. В начале импульса сигнал может служить основанием для поиска точки входа, в конце движения - является признаком кульминации и может говорить о близком окончании тренда. Эталонным размером для фильтрации аномальных све
FREE

Простой тиковый индикатор цены Bid и Ask. Разделитель периода (1 минута) отображен в виде гистограммы. Параметры Price_levels_count - количество отображаемых ценовых уровней. Bar_under_calculation - количество баров индикатора отображаемых на графике.
FREE

Вертикальные линии времени. Простой индикатор который рисует на графике вертикальные линии времени. 1,3,5,10,12,15,20,30,60 минут. Можно изменить цвет линии, стиль линии, выбрать период времени от 1 до 60 минут. Применяется на любом графике, таймфрейме. Входящие параметры: Minute_Num = 20; // step 3,5,12,10,20,15,30,60 minutes color Line_Color = clrYellow; // color line Line_Dash = 2; //0,1,2,3,4... solid, dash, dot, dash dot,dash dot dot
FREE

Indicator overview Trend indicator usage Moving averages. Highest quality alerts that need no introduction. It is completely loyal to the original algorithm and uses other useful features.
Easy to trade Carry out all kinds of notifications It's not a new paint and it's not a back paint. Setting Indicator SMA50 in Time frame H1 for any pair currency and Gold Spot. EMA200 in Time frame H1 for any pair currency and more than EMA250 for Gold spot. Using it for maximum benefit Set up notificatio
FREE

Индикатор PZ Tick Chart отображает полный тиковый график с двумя опциональными скользящими средними и позволяет легко анализировать ценовые данные меньше минутных. С легкостью определяет скачки цен Цена Ask обозначается синей линией Цена Bid обозначается красной линией Индикатор не теряет тиковые данные при повторной загрузке Имеет две опциональные скользящие средние Индикатор не перерисовывается
Параметры Единственными функциональными параметрами являются цена, режим и период, применяемые к с
FREE
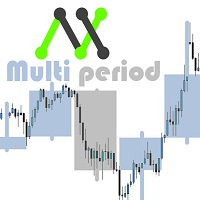
С помощью этого настраиваемого индикатора вы сможете наблюдать другие таймфреймы, кроме обычного. Таким образом, вы узнаете лучше общей среде, в которой цена движется и, вероятно, будет лучше вашей эффективности. «Важно, чтобы таймфрейм в индикаторе был больше, чем в Metatrader. Я посвясь больше показателей бесплатно в ближайшее время. Если у вас есть какие-либо конкретные идеи индикатора, который вы хотите иметь, вы можете написать мне личное сообщение напрямую. Мнения, обзоры, предложения прин
FREE
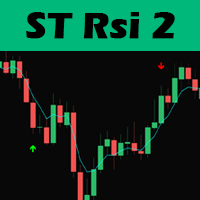
Hello traders, this trading strategy is based on the the Larry Connors RSI-2 strategy, We begin with a 200 periods EMA to find the direction of the market. This is important because we only trade in the main trend direction.
We then look for pull backs using the RSI with a period of 2 to get entry signals. Trades are then exited using the 5 EMA.
Lot size should be calculated using 1% of 1 the ATR value and positions can be added as long as the entry criterion is met.
TRADING IS RISKY AND
FREE

Supreme Direction is an indicator based on market volatility , the indicator draws a a two lined channel with 2 colors above and below price , this indicator does not repaint or back-paint and signal is not delayed. how to use : long above purple line , short below golden line. Parameters : channel period ========================================================
FREE

The Hull Moving Average (HMA), developed by Alan Hull from 2005, one of the most fast-moving Average, reduce lag and easy to use to identify Trend for both Short & Long term. This Indicator is built based on exact formula of Hull Moving Average with 3 phases of calculation: Calculate Weighted Moving Average (WMA_01) with period n/2 & (WMA_02) with period n Calculate RAW-HMA: RAW-HMA = 2 * WMA_01(n/2) - WMA_02(n)
Weighted Moving Average with period sqrt(n) of RAW HMA HMA = WMA (RAW-HMA, sqrt(n
FREE

Индикатор сочетает разворотные паттерны "Двойное дно" и "Двойная вершина" с индикатором определения расхождения RSI.
Особенности С легкостью определяет сильные сигналы разворота Позволяет использовать паттерны "Двойное дно" и "Двойная вершина" и сигналы расхождения RSI вместе или по отдельности. Получайте уведомления по электронной почте и/или на мобильное устройство при обнаружении сигнала. Можно использовать пользовательские цвета Индикатор не перерисовывается Можно использовать в составе со

Precision Pivot Points Yuri Congia Description: Precision Pivot Points is a sophisticated indicator designed to identify potential market reversal points with accuracy and precision. Utilizing advanced algorithms, this indicator automatically calculates key support and resistance levels based on pivot point analysis. Pivot points are essential tools used by traders worldwide to make informed trading decisions and optimize their trading strategies. Join me in the exciting world of financial trad
FREE
RaysFX Trade Info Ciao a tutti, sono entusiasta di presentarvi il nostro ultimo indicatore, RaysFX Trade Info . Questo strumento è stato progettato per fornire informazioni dettagliate sulle vostre operazioni di trading direttamente sul vostro grafico MT4. Caratteristiche principali Informazioni in tempo reale : RaysFX Trade Info fornisce informazioni in tempo reale sulle vostre operazioni aperte e chiuse. Potete vedere il profitto in punti, in valuta e in percentuale. Personalizzabile : L’in
FREE
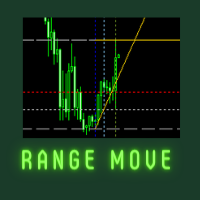
Welcome to Range Move Indicator page This indicator is suitable for Multitime frame and working with any pair including gold and silver pattern also. Very simple and profitable indicator forever. Buy open: when the candle break above the break line 100% sure buy call has open and buy tp line formed in yellow color. Sell open: when the candle break below the break line 100% sure sell call has open and sell tp line formed in yellow color.
FREE
BBMA, which stands for Bollinger Bands and Moving Average , is a trading method that is quite popular and widely used not only in the forex market but also in the stock and commodity markets. This strategy is different from another version of BBMA called BBMA Oma Ally, which uses two Moving Averages. In the BBMA strategy, traders use the Bollinger Bands to spot possible changes in direction and the Moving Average to decide when it's a good time to get in on a trade .

Индикатор предсказывает наиболее вероятное краткосрочное движение цен на основе сложных математических расчетов.
Особенности Оценка текущего движения цены; Расчет текущего тренда; Расчет наиболее важных линий поддержки и сопротивления; Алгоритмы оптимизированы для проведения сложных математических расчетов при минимальном расходе системных ресурсов; Самоадаптация для получения лучшего результата и, как следствие, возможность работы на любом символе (даже самом экзотическом) и таймфрейме; Совме
FREE

Описание индикатора Если для торговли вам необходимо знать будущую волатильность, значит вам нужен этот индикатор! С Predictor of the ATR, ваша торговая система станет более совершенной. Данный индикатор предсказывает будущую волатильность, и делает это достаточно хорошо. Точность прогноза достигает 95%, и это на дистанции до 5 баров в будущее (на периоде H1). Средняя точность прогнозов составляет около 85%, количество прогнозированных баров ограничено вашей фантазией. Прогноз можно делать при
FREE

Grey worm This indicator is a group of indicators combined
Volatility and saturation give us buying and selling and many more things
Use this indicator with your technical analysis or strategy
Do not use it alone and it will give you very good results
It is valid to work on all pairs, metals and instruments
If you have any question, I will be happy to answer it
Please do not forget to rate the good and the positive comment
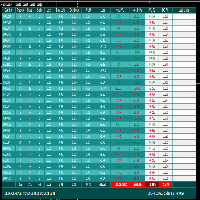
FCK Trade Report This indicator was developed by Fx Candle King. BEFORE CHOOSE CUSTOM PERIOD, GO TO TERMINAL WINDOW (ctrl+T), right click on ACCOUNT HISTORY and CHOOSE ALL HISTORY. This report searches the filtered data in your ACCOUNT CURRENT & HISTORY TRADE, Select your timespan for the report open and closed trades etc... Chose the report type - List only OPEN orders / List only CLOSED orders / List both OPEN and CLOSED orders
FREE

5/35 Oscillator to be used with our Elliott Wave Indicator as part of the overall strategy on trading the 5th wave. The Elliott Wave Indicator Suite is designed around a simple but effective Swing Trading Strategy. The Indicator Suite is great for Stocks, Futures and Forex trading on multiple timeframes You can find the main Elliott Wave Indicator here https://www.mql5.com/en/market/product/44034
FREE
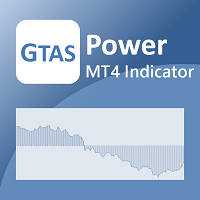
GTAS Power — это индикатор импульса, помогающий определить тренд на основе комбинации скользящих средних. Этот индикатор был создан Бернардом Пратсом Деско (Bernard Prats Desclaux), трейдером и бывшим менеджером хедж-фонда, основателем E-Winvest.
Описание Индикатор представляет собой зеленую или красную гистограмму с линией равновесия 0.
Инструкция по применению Когда GTAS Power зеленый, тренд бычий. Когда он красный, тренд медвежий. Индикатор можно использовать в качестве фильтра в дополнен
FREE

MT4 Candlestick Pattern Alert Indicator: Stay Ahead of Trading Opportunities Overview The MT4 Candlestick Pattern Alert Indicator is a robust tool designed to empower traders by detecting candlestick patterns and delivering timely alerts through notifications, emails, and pop-up alerts. This invaluable tool saves traders precious time, allowing focused analysis on patterns and potential profitable trades. Importance of Candlestick Patterns Candlestick patterns are pivotal in technical analysis,
FREE

Highly configurable CCI indicator. Features: Highly customizable alert functions (at levels, crosses, direction changes via email, push, sound, popup) Multi timeframe ability Color customization (at levels, crosses, direction changes) Linear interpolation and histogram mode options Works on strategy tester in multi timeframe mode (at weekend without ticks also) Adjustable Levels Parameters:
CCI Timeframe: You can set the current or a higher timeframes for CCI . CCI Bar Shift: you can se
FREE

The three white soldiers and the three black crows candlestick patterns are reversal patterns that predict a change in the direction of a trend. The pattern consists of three consecutive long-bodied candlesticks that open within the previous candle's real body and a close that exceeds the previous candle's. It's important to note that both formations are only valid when they appear after a strong uptrend or a downtrend, while their efficiency decreases in choppy markets.
Inputs AlertOn - e
FREE

Семафорный индикатор основан на стандартном индикаторе RSI, на который наложен индикатор Envelopes, который показывает конверт или границы колебания индикатора. Это версия индикатора RSI vs Envelopes Graph который рисуется в отдельном окне . Сигнал на продажу возникает, когда верхний конверт/граница пробивается индикатором RSI сверху вниз. Сигнал на покупку возникает, когда нижний конверт/граница пробивается индикатором RSI снизу вверх. Индикатор имеет возможность рисовать стрелки на индикаторе,
FREE

Lord Auto Fibonnaci is a free indicator for Meta Trader, in order to show the most famous chart in the financial market known as "Fibonnaci".
As we can see in the images below, the fibonnaci table will automatically analyze the graph for you, with trend factors through percentage, almost infallible use, you can always work when the percentage is low or high, start shopping and sales on time, great for analyzing entries!
In the images below we can see an example in gold in H4, where we are a
FREE

Trend is Friends is an line Indicator used as an assistant tool for your trading strategy. The indicator analyzes the standard deviation of bar close for a given period and generates a buy or sell trend if the deviation increases. It good to combo with Martingale EA to follow Trend and Sellect Buy Only/Sell Only for EA work Semi-Automatic. You can use this Indicator with any EAs in my Products.
FREE
Buy a Coffee for Yuniesky Carralero Cuellar
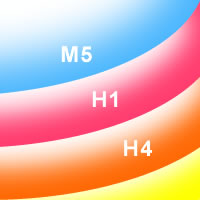
This indicator draws : . Simple Moving Average 20 - <Blue> . Simple Moving Average 20 - H1 <Purple> . Simple Moving Average 20 - H4 <Orange> on THE SAME GRAPH
You will need to use the MAV4 template that shows
1. Simple Moving Average 20
2. Period Separators
3. ASK line
Support I will be happy to hear your recommendations to improve this product.
Author Yuniesky Carralero Cuellar, Computer Scientist
FREE

Engulfing candlestick patterns are comprised of two bars on a price chart. They are used to indicate a market reversal. The second candlestick will be much larger than the first, so that it completely covers or 'engulfs' the length of the previous bar.
By combining this with the ability to look at trend direction this indicator eliminates a lot of false signals that are normally generated if no overall trend is taken into consideration
FREE

The Tmcd is a very smooth oscillator and a good indicator of trend. It has a noise filter built in which shows sideways markets and it can also show the beginning of a trend. It works on any symbol from Forex to commodities as well as crypto currencies. It does not require a change of settings. The default settings are fine. The use of it can be varied and I recommend it is be used in conjunction with other indicators. The indicator is free for use and your review will be appreciated.
Join my
FREE

3 стратегии с RSI! Алерты! Проверка на свежесть сигнала! Индикатор основан на классическом RSI. Рекомендую посмотреть моего советника - Night Zen EA
Подпишись на мой telegram канал, ссылка в контактах моего профиля . В него включены 3 стратегии: Вход индикатора RSI в зону перекупленности (для сделок на покупку) / перепроданности (для сделок на продажу) Выход индикатора RSI из зоны перекупленности (для сделок на продажу) / перепроданности (для сделок на покупку) Касание предельного уровня пе
FREE

LotSize Indicator Discover the appropriate lot size to use in your trades based on the available margin. This indicator provides valuable information for risk management. If the indicator shows a value of 0, it means that your balance or available margin is insufficient for trading. It is important to maintain adequate margin levels for safe trading practices. This indicator is exclusively designed for the MT4 platform, a popular and reliable trading platform in the market. With the LotSize Indi
FREE

Supertrend Moving Average A combination of Supertrend and Moving Average to create a converging trade setup Input parameters: signal mode: set it to true if you want to plug it into STAT (Signal Tester and Trader) arrow shift: distance between fast EMA line to arrow on chart turn on moving average signal for converging setup supertrend period ATR multiplier Moving average period Averaging method Pricing You can find the best setting for 4 hour EURUSD on this video
FREE

Индикатор GTAS BSI предназначен для определения направления тренда и подачи сигналов на покупку/продажу, используя комбинацию индикаторов импульса.
Описание Индикатор BSI представлен в виде гистограммы на заднем плане ценового графика. Значение +100 (зеленый цвет) означает бычий тренд. Значение -100 (красный цвет) означает медвежий тренд. Когда BSI достигает значения +100 (зеленый цвет), формируется потенциальный сигнал на покупку. Когда он достигает значения -100 (красный цвет), формируется п
FREE

Индикатор выводит на график размер спреда по текущему инструменту. Очень гибок в настройках. Есть возможность задать максимальное значение спреда, по превышении которого, сменится цвет надписи спреда, и прозвучит сигнал (если включено в настройках). Индикатор будет очень удобен людям, которые торгуют на новостях. Вы никогда не войдете в сделку с большим спредом, так как индикатор вас об этом уведомит как визуально так и звуком. Входные параметры: AlerT - true - включен звуковой сигнал при превыш
FREE

'Circle Rising Point' is an indicator based on the cycle theory. No matter whether your trading cycle is short or long, you can use this indicator to find the rise and fall points of different cycles and different bands. Therefore, the signals displayed to you on charts of different cycles are different, and applicable to left side transactions. This indicator is recommended to be used together with the multi cycle window for analysis. Indicator introduction Applicable products This indicato
FREE

Индикатор PipTick Pairs Spread использует популярную стратегию, известную как "торговля парами", спредовая торговля или статистический арбитраж. Индикатор измеряет расстояние (спред) между ценами положительно коррелированных инструментов и показывает результат в виде кривой со стандартными отклонениями. В результате любой трейдер может легко определить, когда инструменты находятся слишком далеко друг от друга, и использовать эту информацию для торговли.
Применение Наилучшие результаты достигаю

Индикатор PipTick Pairs Cross работает с отрицательно коррелированными торговыми инструментами, такими как EURUSD и USDCHF. Работа индикатора основана на "торговле парами" (или спредовой торговле). Он сравнивает силу двух отрицательно коррелированных пар и определяет лучшие моменты для покупки первой пары и продажи второй и наоборот. Это очень простой и эффективный подход к торговле валютными парами.
Применение Торговля с использованием индикатора довольно проста: Если гистограмма меняет цвет

Provide ideas for trend trading.
Automatic calculation and generation of trend channels.
The channel line, also known as the pipeline line, is to draw a straight line parallel to the trend line in the opposite direction of the trend line, and the straight line crosses the highest or lowest price of the recent period. These two lines run the price in the middle and have obvious pipe or channel shapes. Necessary for traders: tools and indicators Waves automatically calculate indicators, chann

----< High Accuracy Ichimoku Cloud Entry Signals >----
CloudEntry could tell you the trend direction, resistance and support, when to open orders and where to set stoploss & takeprofit. this is a multifunctional indicator, can work well on all symbols and timeframes.
Features:
real-time analysis of trend direction filter out all the minor waves show resistance and support along as price goes give highly accurate entry signals frequently send alert in popup, email, notification way at eve
this indicator functions to read buffers from other custom indicators, and combine 2 signals from each indicator Instructions 1. you have to know the buffer up or down of the indicator you want to use 2. if the indicator is in the same folder, you just need to enter the name of the indicator in the indicator name column if the custom indicator is in a separate folder, you can type it in the format folder1/folder2/name indicator

Всем привет. Предлагаю на обозрения очень достойный индикатор входы очень четкие можно по мартину отрабатывать 30 мин до и после новостей не торгуем можно накинуть индикатор новостей больше вам не чего не надо есть сигнал стрелка за крепилась на следующую входим Экспирация любая валюта тоже любая. осцилляторы и авторский алгоритм.И еще можно через бот авто торговля на скрине.И еще друзья после приобретения или аренды пишем мне свои контакты я вам помогу все настроить что бы работало на авто то
FREE

Renko Charts now have the alerts and the Win-rate . Now you can know which signal will give you that edge your trading needs. Risk to Reward Settings Wins versus Losses Count There are four alert types to choose from for notification on screen, email or phone notification. The alert types also have buffers for use with automation. This indicator can be incorporated with any system that requires renko charts. The four (4) alert types are: Three-bar Formation ; Pinbar ; Marabozu and Engulfing Ba
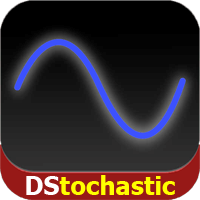
DStochastic - это усовершенствованная версия классического осциллятора Stochastic с добавленной скользящей средней. Индикатор поглощает рыночный шум, определяет направление рынка и снижает количество ложных сигналов. Дополнительно в индикатор добавлена возможность отображения сигнальной линии разными цветами для роста и падения при помощи точек. Синие точки указывают на развитие восходящей тенденции, красные точки - нисходящей. Как и все стандартные осцилляторы, DStochastic сочетается со всеми и
FREE
Moving Average Dashboard Pro is an improved and advanced indicator of the free version "Moving Average Crossover Bars ago Dashboard" The moving average dashboard pro gives you a dashboard view of bullish and bearish moving average crossovers. For example, if there was a bullish moving average crossover 5 sessions ago, then you would see 5 bars ago . This indicates that there was a bullish crossover 5 sessions ago. This indicator is useful if you want to catch the trend early on when using moving

Sometimes we need convincing data to make sure our robot, or our indicator goes exactly the way it should be. Sometimes we find out that the data is inaccurate , it can be void , or it has the same data as the previous one . that is why sometimes we find a message on the screen " Waiting for Update ". The system is trying to refresh and reload the data.
The Refresh Charts indicator. This Indicator Utility will solve those problems with just one click . It will refresh and extract data from

Индикатор выдает алерт, когда на графике появляется объект заданного в настройках типа. Также может отправлять сообщение на имейл и push-уведомление. Является идеальным решением, когда требуется отслеживать появление любых графических объектов, создаваемых другими индикаторами или советниками. Имеет два режима работы: С индикаторами, которые для рисования объектов используют буферы. С индикаторами, которые буферы не используют. Определить тип индикатора можно в его настройках. У индикаторов, ис

Introduction to X3 Chart Pattern Scanner X3 Cherart Pattern Scanner is the non-repainting and non-lagging indicator detecting X3 chart patterns including Harmonic pattern, Elliott Wave pattern, X3 patterns, and Japanese Candlestick patterns. Historical patterns match with signal patterns. Hence, you can readily develop the solid trading strategy in your chart. More importantly, this superb pattern scanner can detect the optimal pattern of its kind. In addition, you can switch on and off individu

Описание Продукт основан на применении скользящей средней к индикатору Momentum. Подтвержденные пересечения скользящей средней с линией Momentum отмечаются стрелками на графике. При пересечении скользящей средней снизу вверх отображается стрелка на покупку и наоборот. Стрелки не перерисовываются, так как индикатор использует лишь подтвержденные значения и ожидает закрытия свечи перед тем, как вывести стрелку на график. Индикатор также может выдавать алерты при появлении стрелок. Предусмотрены 3
FREE

BeST_123 Strategy is clearly based on the 123_Pattern which is a frequent Reversal Chart Pattern of a very high Success Ratio . It occurs at the end of trends and swings and it’s a serious indication of high probability for a change in trend. Theoretically an 123_pattern is valid when the price closes beyond the level of #2 local top/bottom, a moment when the indicator draws an Entry Arrow, raises an Alert and a corresponding Position can be opened. The BeST 123_Strategy Indicator is non-repai
MetaTrader Маркет - лучшее место для продажи торговых роботов и технических индикаторов.
Вам необходимо только написать востребованную программу для платформы MetaTrader, красиво оформить и добавить хорошее описание. Мы поможем вам опубликовать продукт в сервисе Маркет, где его могут купить миллионы пользователей MetaTrader. Так что занимайтесь только непосредственно своим делом - пишите программы для автотрейдинга.
Вы упускаете торговые возможности:
- Бесплатные приложения для трейдинга
- 8 000+ сигналов для копирования
- Экономические новости для анализа финансовых рынков
Регистрация
Вход
Если у вас нет учетной записи, зарегистрируйтесь
Для авторизации и пользования сайтом MQL5.com необходимо разрешить использование файлов Сookie.
Пожалуйста, включите в вашем браузере данную настройку, иначе вы не сможете авторизоваться.