Смотри обучающее видео по маркету на YouTube
Как купить торгового робота или индикатор
Запусти робота на
виртуальном хостинге
виртуальном хостинге
Протестируй индикатор/робота перед покупкой
Хочешь зарабатывать в Маркете?
Как подать продукт, чтобы его покупали
Технические индикаторы для MetaTrader 4 - 17

Этот индикатор сканирует несколько пар на нескольких таймфреймах в поисках значений RSI и рисует зеленые стрелки вверх для значений перекупленности RSI и красные стрелки вниз для значений перепроданности RSI в режиме реального времени.
Функции • Анимированное построение рядов • Изменяемый размер • Перемещаемый • Минимизируется • Несколько тем панели инструментов • Несколько таймфреймов • Вы можете открыть пару, нажав на нее • Текущая пара графиков отмечена другим цветом • Используйте пары для
FREE

прорыв линии шеи / треугольника / флагштока (прорыв линии шеи = подтвержденный сигнал для вершины / оснований и головы и плеч). Индикатор также можно использовать в режиме одиночного графика. Подробнее об этой опции читайте в разделе продукта. блог . В сочетании с вашими собственными правилами и методами этот индикатор позволит вам создать (или улучшить) вашу собственную мощную систему. Функции
Может одновременно отслеживать все символы, отображаемые в окне "Обзор рынка". Примените ин
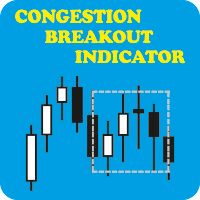
CONGESTION BREAKOUT INDICATOR: When you see a sideways price movement in a meaningless market, what goes through your mind? Is it a danger, an opportunity or completely a vacuum? Let's see if we can avoid the latter and focus on using it to our advantage. The ability to read price action through the display of rectangles on the chart could be the boost you need to achieve your trading goals. What is congestion? Congestion is a market situation where the price is trading around a particular leve

Скользящая средняя Алана Хала, более чувствительная к текущей ценовой активности, чем обычная MA. Быстрее реагирует на изменение тренда, четче показывает движение цены. Цветная версия индикатора. Развитие оригинальной версии индикатора от Sergey <wizardserg@mail.ru>. Подходит для всех таймфреймов.
Параметры Period - период сглаживания, рекомендуемые значения от 9 до 64. Чем больше период, тем мягче индикатор. Method - метод сглаживания, возможные значения 0, 1, 2 или 3.
FREE

Индикатор ищет один из наиболее эффективных свечных паттернов разворота - Three Line Strike (прорыв трех линий). По словам автора бестселлера и свечного гуру Томаса Булковски, паттерн приносит прибыль в 65-84% случаев . Индикатор сканирует до 30 инструментов (форекс, индексы и товары) на 8 таймфреймах. Вы можете получать алерты в самом терминале или по электронной почте при обнаружении паттерна Three Line Strike. Внимание: Чем крупнее таймфрейм, тем надежнее сигналы. Сигнал срабатывает, если све

"VIX Fix - это мощный индикатор, способный обнаруживать ценовые впадины для любого актива " VIX (индекс волатильности) - это тикерный символ подразумеваемой волатильности S&P 500, вычисляемый Чикагской биржей опционов. VIX является популярной мерой рыночного риска, а также одной их наилучших способов измерения существующих ценовых впадин. К сожалению, он существует только для S&P 500... Индикатор VIX Fix был опубликован Ларри Вильямсом в 2007 году. Он синтезирует индекс волатильности VIX для люб

Dark Support Resistance is an Indicator for intraday trading. This Indicator is programmed to identify Support and Resistance Lines , providing a high level of accuracy and reliability.
Key benefits
Easily visible lines Only the most important levels will be displayed Automated adjustment for each timeframe and instrument Easy to use even for beginners Never repaints, never backpaints, Not Lag 100% compatible with Expert Advisor development All types of alerts available: Pop-up, Email, Pus

Это индикатор торговых сессий который может отображать все уровни ( Open-High-Low-Close ) для четырех сессий. Сессии могут быть нарисованы линиями или с заливкой как свечи, линии могут быть продлены до следующей сессии. Вы можете легко скрывать/показывать каждую сессию нажатием на горячие клавиши. Также вы можете видеть ASR (средний диапазон сессий) (горячая клавиша по умолчанию «A»). Это похоже на расчет ADR, только он рассчитывается на основе последних X-сессий, что позволяет увидеть пот
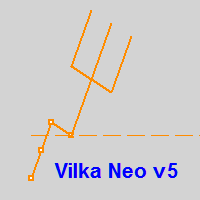
Вилка Нео v5, разрабатывалась для торговой системы "Оракул", но постепенно дополнялась, например - углами Ганна и другими опциями...
Можно создавать графические объекты с заданным цветом, стилем и толщиной, такие как: прямоугольники с заливкой и без, отрезки трендлиний и нестандартный инструмент - "вилка Нео" в виде трезубца, так же есть возможность интерактивно настраивать цветовую палитру прямо с графика, настраивать видимость объектов для разных ТФ, толщину и стили... Панель переключается кл
FREE

Indicator overview Trend indicator usage Moving averages. Highest quality alerts that need no introduction. It is completely loyal to the original algorithm and uses other useful features.
Easy to trade Carry out all kinds of notifications It's not a new paint and it's not a back paint. Setting Indicator EMA50 in Time frame H1 for any pair currency and Gold Spot. EMA200 in Time frame H1 for any pair currency and more than EMA250 for Gold spot. Using it for maximum benefit Set up notificatio
FREE

Limited time offer! For the launch of NextBot , which has been working on a real account for about a year doubling the initial capital, the price of this indicator will drop to FREE ! Introducing a pragmatic and innovative tool for MetaTrader 4 (MT4) traders: the Linear Regression Next channel indicator, enhanced with the determination coefficient R 2 . This indicator serves as a foundational tool for traders seeking to understand market trends through the lens of statistical analysis, spe
FREE

Несмотря на то, что научиться интерпретировать свечной график может любой амбициозный трейдер на ценовом действии, на овладение этим навыком в совершенстве уйдут годы. Простым же смертным без помощи не обойтись. Вот где будет полезен индикатор Quantum Dynamic Price Pivots. Как ведущий индикатор, основанный исключительно на ценовом действии, он генерирует достаточное количество простых и ясных сигналов, с клинической эффективностью отмечая потенциальные точки разворота. Так же как объем и цена, п

Gorilla Channel VZ – это канальный индикатор, доработанный на основе многолетних наблюдений . Сигнальный торговый индикатор можно использовать как в качестве индикатора, отображающего трендовый канал, так и в качестве одного из источника сигналов на вход, при условии дополнительной фильтрации. При должном подходе минимум 80% успешных сделок. Основные характеристики Gorilla Channel VZ : Аналитические функции Может использоваться на любых валютных парах и тайм-фреймах; Индикатор не пер
FREE

(Перевод Google) Стандартное представление свечи Heikin Ashi имеет значение открытия, эквивалентное экспоненциальному показателю. Скользящее среднее (EMA) от Общей цены , из которых альфа значение EMA является фиксированным с периодом 0,5 (эквивалентно периоду EMA 3,0). В этой динамической версии период может быть изменен на любое значение, которое вы хотите использовать, что также позволяет приблизительный анализ нескольких таймфреймов или используйте минимальное или максимальное значение в кач
FREE

MT5 Version Elliot Wave Oscillator MT4 Elliot Wave Oscillator MT4 is an indicator designed to support Elliot Wave counts. The default settings help filtering out the noise in the market allowing a clear perception for the waves counts in differnt timeframes. Elliot Wave Oscillator high customization level allows the you to optimize this indicator to your personal preferences. Shorter Periods and faster reactive MAs will provide more infomation but will require a higher level of experience for

"Scalping and dethatching" - сигнальный форекс индикатор для скальпинга, который показывает визуально на графике направление текущего тренда. Данный индикатор позволяет за 3 секунды после добавления на график определить направление текущего тренда с точностью до 90%. Универсальность индикатора заключается в том, что он работает на всех валютных парах. Все валютные пары подчиняются одним и тем же фундаментальным законам рынка, по этому индикатор "Scalping and dethatching" работает на всех валютны

M5 gold scalping indicator - стрелочный индикатор, который показывает на графике точки разворота цены. Не перерисовывается! Создан для скальпирования на золоте (XAUUSD), но так же может работать и на других валютных парах. В среднем до 87% сигналов показывают точное направление движения цены и примерно 9% сигналов показывают правильное направление цены но которое уже заканчивает свой импульс. В качестве дополнительного фильтра, для получения еще более точных сигналов, рекомендуем использовать лю

Индикатор Volatility Ratio был разработан Джеком Сваггером для определения торговых диапазонов и поиска возможных пробоев. Коэффициент волатильности определен как истинный диапазон (True Range) текущего дня поделенный на истинный диапазон (True Range) за определенное количество дней (т.е. N периодов). Для расчета коэффициента волатильности используется следующая формула: Коэффициент волатильности (VR) = True Range за текущий день/True Range за N дней Истинный диапазон True Range рассчитывается п
FREE

This trend scanner indicator is using two main indicators to identify trends. Frist the EMAs to provide a view on Bullish / Bearish momentum. When the shorter EMA (calculated off more recent price action) crosses, or is above, the slower moving EMA (calculated off a longer period of price action), it suggests that the market is in an uptrend. Second the Stochastic RSI, When RSI is < 20 it is considered oversold, and when > 80 it is overbought. These conditions suggests that momentum is very str
FREE

Индикатор Pattern Detector находит наиболее популярные свечные паттерны из 1, 2 и 3 свечей и отправляет уведомления при их нахождении. Демо-версия, работающая на AUDNZD, доступна по ссылке: https://www.mql5.com/ru/market/product/29189
Принципы работы Прикрепите индикатор на график, который хотите проанализировать, и выберите паттерны, которые нужно найти. Индикатор будет отображать найденные паттерны. Также индикатор может отправлять уведомления о найденных паттернах в терминал, на мобильный т
FREE
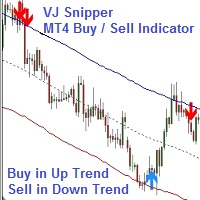
VJ Sniper - это индикатор для совершения покупки/продажи в MT4: покупка осуществляется при восходящем тренде, а продажа - при нисходящем. Предпосылки: Ни один встроенный индикатор MT4, как Stochastic, CCI или DeMarker и т.д., не работает самостоятельно. Но их сочетание с прогнозированием тренда отлично работает и превосходно находит точки входа. Данный индикатор составлен специально для обеспечения оптимальных результатов и максимального снижения количества ложных сигналов. Это не Грааль и не 10

"Тренд - друг трейдера" . Это одна из самых известных пословиц в трейдинге, потому что правильное определение тренда может помочь заработать. Однако проще сказать о торговле по тренду, чем сделать, потому что многие индикаторы основаны на развороте цены, а не на анализе тренда. Они не очень эффективны при определении периодов тренда или в определении того, сохранится ли этот тренд. Мы разработали индикатор Trendiness Index , чтобы попытаться решить эту проблему. Индикатор определяет силу и напра

Модифицированный осциллятор MACD. Классический индикатор, соединяющий в себе трендовый индикатор с осциллятором для обнаружения точек входа. Имеет мультитаймфреймовую панель, а также 3 типа уведомлений
Преимущества:
Работает на всех инструментах и таймсериях Трендовый индикатор с осциллятором для входов Мультипериодная панель на всех таймфреймах Подключаемые стрелки при появлении сигналов Три типа уведомлений: push, email, alert
MT5 версия -> ЗДЕСЬ / Наши новости -> ЗДЕСЬ
Как рабо
FREE

This Indicator was used on EA Advanced Fibo levels . Indicator is designed to trade for most popular Fibonacci strategy that's completely automated. It automatically identifies and show Entry levels included Support/ Resistance Zones , according to the time zone candle by Fibonacci levels. As well as the traditional Fibonacci tool also included. However, it is very user friendly rather than default available one. On the other hand one more tool included. It automatically identifies real Suppo
FREE

Just another plain Super Trend indicator.
On this one i have added another buffer (on index 2) which can be used on EA; the values is -1 to identify a bearish trend while for bullish trend the value is 1.
Here a code snippet:
int trend = ( int ) iCustom ( NULL , Timeframe, "SuperTrend" , Period , Multiplier, 2 , 1 ); It work on every timeframe.
If you need help to integrate it on your EA, don't hesitate to contact me.
FREE

Индикатор показывает на графике к лассические уровни пивота , рассчитанные на основе предыдущего дня. Вы можете выбрать, с какого часа рассчитывать формулу. Торгуйте во флэте на разворот. На трендовом рынке используйте их как цель. Совместите со своими стратегиями для успешной торговли. Уровни строятся с помощью буферов и отображаются на всей доступной истории котировок.
Входные параметры.
Start Hour - с какого часа считать начало дня. 00 - по умолчанию. Show Mid Pivots - отображать промежу
FREE

This Dashboard is free to download but is dependent on you owning the Gold Pro MT4 indicator. Get the indicator here: https://www.mql5.com/en/market/product/60430
The Dashboard will show you on a single chart all the timeframes (M1 to Monthly) with their own status for the indicator: Gold Pro MT4
all time frame and all symbol: smart algorithm detects the trend, filters out market noise and gives entry signals!!!
How to understand the status: Dashboard Show "Buy" - Buy Signa
FREE

Flag Pattern Indicator - Your Guide to Flagging Profitable Trade Setups Welcome to the world of precision trading with the "Flag Pattern Indicator." Designed for MetaTrader, this powerful tool is your go-to solution for identifying one of the most reliable and versatile chart patterns in technical analysis: the flag pattern. Whether you're a seasoned trader or just starting, this indicator simplifies the process of spotting flag patterns, giving you an edge in your trading decisions. Key Feature
FREE
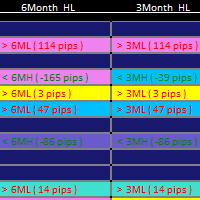
1. Updated usage instructions in blog below: Smart Market Structure Trading System and Automatic Scanner - Trading Systems - 13 October 2023 - Traders' Blogs (mql5.com) https://www.mql5.com/en/blogs/post/754495 2. The Smart Market Structure Opportunity Scanner is a great tool to find trading entries and exits based on Smart Money Concepts. It has a build-in custom choice of Forex pair lists to choose from for the scan, and it also has a user-defined entry choice to put down your own list of Fo
FREE

Indicator measures strength of each currency in your list.
Main idea: It simply iterates through all combinations of pairs and adds difference between open and close in percent. Parameters: List of currencies - what currencies will be calculated (maximum is 8) Calculation type - from which data will be strength calculated Calculation data input - used as input related to calculation type Symbol suffix - used in case of suffix on symbols, e.g: when your symbols look like EURUSDm, EURUSDmicro et
FREE

ADX Channel - это индикатор, который рисует канал в зависимости от показаний индикатора ADX (Average Directional Movement Index). Канал получается немного похож на Envelopes, однако его линии зависят от волатильности рынка. Сделка на продажу обычно осуществляется, когда цена коснется и отскочит от верхней линии канала, покупка - от нижней. Рекомендуется торговать в то время, когда нет важных новостей. Таймфремы, которые лучше использовать: M5 - H1. Индикатор не предназначен для торговли на таймф
FREE

This indicator is a personal implementation of the famous Traders Dynamic Index, which uses RSI, moving averages and volatility bands to find trends, reversals and price exhaustions. However, this particular implementation supports not only RSI, but also CCI, Stoch, AO, AC, Momentum, WPR, Demarker, RVI and ATR. It is suitable for scalping, day trading, and swing trading and aims to provide a full picture of the current market conditions. [ Installation Guide | Update Guide | Troubleshooting | FA
FREE
NOTE : This Free version only works for the EURUSD & AUDUSD Symbol !
MT4 Version Available Here: https://www.mql5.com/en/market/product/43555
MT5 Version Available Here: https://www.mql5.com/en/market/product/50048
Telegram Channel & Group : https://t.me/bluedigitsfx
V.I.P Group Access: Send Payment Proof to our Inbox
Recommended Broker: https://eb4.app/BDFXOsprey *All In One System Indicator, Breakthrough solution for any Newbie or Expert Trader! The BlueDigitsFx Easy 123 Sy
FREE
MTF Fair Value Gaps Alerts indicator is based on Fair Value Gaps (FVG), Volume imbalance (VI) and Gaps. This indicator will create 2 arrows pointing to the left showing the area of the FVG, VI and Gaps and will never repaint after the candle has been closed .
Inputs: TF (Timeframe of the Alert For Current timeframe use CURRENT)
barshilft : the barshift needs to be the same timeframe as the above TF. barshift format (CURRENT, M1, M5, M15, M30, H1, H4, D1, W1, MN) Send Email: Audible Alert Push

ATSCStrategy is a versatile indicator designed for both binary options and forex markets. Empower your trading strategies with this dynamic tool, providing valuable insights for making informed decisions in the fast-paced world of binary options and forex trading.
-Forex Market
-Binary Option Market
-Binary use timeframe 1M - 5M
-Forex use timeframe M30 or high
FREE

Pullback Viewer is designed to show valid pullback points in a bearish or bullish trend.
What is considered a valid pullback?
A valid pullback needs to have a body close outside the previous candle high (in a bearish trend ) or previous candle low (in a bullish trend ). If the candle wicks out the previous candle, it's not a valid pullback.
Pullback must liquidate the previous candle with a clean candle body close.
When is this indicator useful?
It's useful to under
FREE

FZR indicator determines fractal zigzag reversal pattern of all the time frames of the chosen symbol and shows the information in the Info label. Indicator draws the detected pattern in the chosen time frame and also you can select in the menu to draw the trend line according to FZR peaks. What it is FZR? See the first picture in the screenshots. As you can see for every peak of FZR the AO indicator must cross zero line. FZR indicator determines the trend direction.
How to use FZR for trading?
FREE
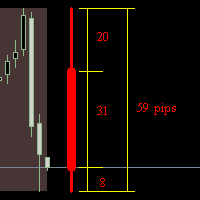
Индикатор 'рисует' дневную, недельную или месячную свечу на текущем графике. Показывает в пунктах размеры верхней и нижней тени, тела и всей свечи. Работа в реальном времени. Работает в тестере стратегий. Параметры индикатора: How_much_to_show - сколько показать блоков. Block_period - период блока (день/неделя/месяц)
Shift - смещение от края графика в барах. language - выбор языка.
FREE

Оживите свои торговые графики с помощью нашего инновационного конструктора тем для Metatrader!
Наш Конструктор тем позволяет создать торговую среду, которая соответствует вашему личному стилю и предпочтениям. Благодаря простому в использовании интерфейсу и полной интеграции в Metatrader, вы теперь можете полностью контролировать внешний вид и восприятие ваших графиков / Бесплатная версия MT5 .
Особенности Полная настройка: Легко изменяйте цвет свечей и фон графика, чтобы отразить ваш уник
FREE

Дневные ровни разворота достаточно важны в торговле. Данный индикатор позволяет выбрать четыре часто используемых типа расчета пивотов.
Входные параметры Выберите тип расчета точек разворота (Method Classic, Method Camarilla, Method TomDeMark или Method Fibonacci) Выберите таймфрейм, используем для расчетов (M5, M15, H1, H4, D1, W1 и т.д.) Можно запускать на любом таймфрейме Настройте цвет пивотов
FREE

Flow Trend BLACK FRIDAY: 50% DISCONT > OLD PRICE 100$ > NOW 50$
Flow trend is designed to detect the market trend with special calculation and a combination of Bolinger band and statistical moving period
to detect the market trend without frequency change and fault.
This indicator is designed with simple parameters to use fast and easy and helpful tools to trade in a pure direction and set your SL/TP with this indicator cloud system.
FREE

MA MTF Overlay Chart is software that allows you to overlay the candlestick chart of a financial instrument with a second candlestick chart of the same one, or of another, financial instrument, by setting a different timeframe from that of the basic chart. The software is very simple to use and the input parameters are listed below.
Input parameters: Overlay chart set-up Financial instrument : financial instrument that you want to overlay on the base chart Time period : secondary instrum
FREE

O indicador criado por Didi Aguiar, o mestre das Agulhadas!
O padrão do indicador é o cruzamento de três médias móveis simples. Média rápida, período 3. Média normalizada, período 8. Média lenta, período 20.
Quando as três médias se cruzam próximas o suficiente, acontece a agulhada! Pela posição das médias é possível identificar: Agulhada de compra, agulhada de venda, ponto falso e beijo da mulher aranha.
Quer saber mais? Procure pelo site dos robôs oficiais da Dojistar: tradesystembots.co
FREE

Индикатор ищет зоны покупки и продажи, где можно открыть сделку с минимальным стоп-лоссом и лучшим соотношением риск/прибыль (Risk Reward Ratio). В основе индикатора - качественный поиск паттерна Двойная вершина/Двойное дно. Эта версия работает только на паре USDCAD! Полностью рабочую версию индикатора можно купить здесь - https://www.mql5.com/ru/market/product/29820
Принцип работы индикатора Ищет локальные вершинки/низинки, которые потенциально смогут стать Разворотной зоной Ожидает импульсно
FREE

В основе индикатора TDI лежат следующие индикаторы: RSI, Moving Average, Bollinger bands, но основным из них нужно выделить RSI, весь расчет индикатора завязан от его значений.
Зеленая линия (линия RSI) – сглаженные простой (по умолчанию) скользящей средней значения индикатора RSI, период сглаживания 2.
Красная линия (сигнальная линия) – сглаженные простой (по умолчанию) скользящей средней значения индикатора RSI, период сглаживания 7.
Синие линии – индикатор Bollinger bands по умолчанию п
FREE
GENERAL DESCRIPTION
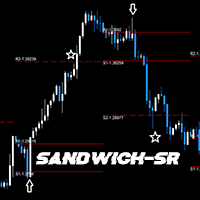
Simple SR Projection based on selected instrument's historical data. Best used in conjunction with current market sentiment, and fundamental analysis. Currently limited to selected pairs due to of historical data to project accurate levels.
Generally, for support and resistance, 2 levels are drawn, respectively. The inner levels (R1,S1) project the highs and lows during the opening stages of selected time frame. The outer levels, represent the targets to reach during the c
FREE
The MACD 2 Line Indicator is a powerful, upgraded version of the classic Moving Average Convergence Divergence (MACD) indicator.
This tool is the embodiment of versatility and functionality, capable of delivering comprehensive market insights to both beginner and advanced traders. The MACD 2 Line Indicator for MQL4 offers a dynamic perspective of market momentum and direction, through clear, visually compelling charts and real-time analysis.
Metatrader5 Version | All Products | Contac
FREE
Download the free version here.
A Full Concept of BUY/SELL Scalping Strategy Trend detection is one of the basic challenges of every trader. Finding a way to tell when to enter a trade is very important, timing is a game changer, not too early and not too late. Sometimes, due to not knowing the market conditions, the trader closes his positions with a small profit or allows the losses to grow, these are the mistakes that novice traders make. Indicator Trend Whipper is a complete trading st
FREE

About testing Mode: 1.To get the best usage experience please use the tick data to test and adjust the test speed to proper speed (tick price jump quickly but K bars scroll slowly)!!! 2.Click "Indicator Properties"-> Click "Reset" before testing the indicator to restore the default parameters of the indicator.
1. Compound Drawings (1) Line segment with arrow (2) Continuous line segment (broken line) (3) Parallelogram (4) Polygon (5) Profit and loss ratio measurement tools
2. Backtracking

This indicator tool provides mini charts, with adjustable symbol/tf that can be dragged into place. Lightweight operation with multiple mini charts are supported.
Chart features: adjustable symbol and tf draggable multiple mini charts color styling and font sizing, foreground/background colors candle coloring candle styles; candles, bars, line, high-low channel
zoom in/out
FREE
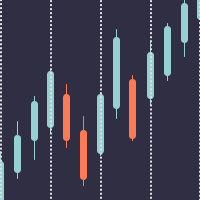
Better Period Separators For MetaTrader 4 The built-in period separators feature doesn’t allow users to specify the time period, so you can use this indicator to create more customizable period separators. On intraday charts, you could place period separators at a specific time, you could also place extra period separators at a specific time on Monday to mark the start of a week. On higher timeframe charts, this indicator works the same as the built-in period separators, On the daily chart, peri
FREE

The Donchian channel is an indicator that takes a series of user-defined periods and calculates the upper and lower bands. Draw two lines on the graph according to the Donchian channel formula. This straightforward formula is based on:
The top line is the highest price for the last periods n The bottom line is the lowest price for the last periods n
Trend systems follow periods when support and resistance levels are broken. in this case when the price breaks the upper line or the lower line
FREE
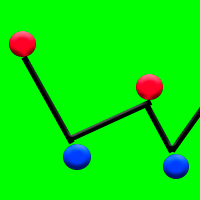
Dot scalp - показывает точки разворота цены с точностью до 93%. Не перерисовывает точки. Хорошо работает во время бокового движения цены, когда на рынке флет. Индикатор рисует точками на графике моменты разворота цены или откаты.
Как применять этот индикатор в торговле? Добавьте на график индикатор Dot scalp. Также скачайте в интернете любой канальный индикатор, который показывает на графике канал. Дождитесь бокового движения цены, это когда канальный индикатор рисует канал в горизонтальном

This indicator is stand alone version from MP Pivot Levels (All in one) containing Demark's Pivots.
Calculations: PP = X / 4 R1 = X / 2 - LOWprev S1 = X / 2 - HIGHprev Uses: When the pair currency price may change the direction of movement. Possible constraints of support and resistance that creates plateaus for the currency pair prices. Tendency identification by comparing the present prices according to current day's pivot point and also the prior day's pivot points. ___________
FREE

This outside bar indicator is the opposite of the inside bar. So what this MT4 outside bar indicator does is identifies outside bars for you as they form on your charts. Outside bar is a famous trading pattern in which the bar carry higher high and lower low compared with the previous bar, also known as mother bar. To trade based on Outside Bars, simply place buy stop order above the high price level of a bullish Outside Bar, and sell stop order should be placed below the low price level of a be
FREE

Keltner Trend Pro - Unleash the Power of Price Action! Are you ready to transform your trading approach? Meet Keltner Trend Pro, an Expert Advisor meticulously crafted to harness the dynamic movements of the market using the renowned Keltner Channel and Average True Range (ATR) indicators. Limited-time Special Opportunity: Seize the moment! Be among the first 10 (Purchasing 0/10) to seize this unique opportunity, and not only will you acquire a top-tier trading algorithm but also enjoy an exclu
FREE

В основе ZUP лежат две идеи. Идея 1 - объединить в одном индикаторе множество различных вариантов поиска экстремумов (минимумов и максимумов) на ценовых графиках рынков. Идея 2 - сделать возможным легкую привязку различных графических инструментов, позволяющих анализировать поведение рынка, к выявленным экстремумам. Для реализации первой идеи в индикаторе сделано следующее. Включены несколько алгоритмов зигзагов. Стандартный алгоритм ZIGZAG. Основа алгоритма этого зигзага взята из зигзага, котор

RSI Candle Signal Indicator will change bars’ color when set overbought or oversold levels reach.
How to Use RSI Candle Signal Uptrend/Downtrends - RSI may be used to detect trending markets. For example, the RSI may stay above the mid line 50 in an uptrend. Top and Buttoms - RSI may help in identifying the tops around the overbought readings (usually above 70), and the bottoms around the oversold area (usually below 30). Divergence - divergence occurs when RSI directional movement is not c
FREE
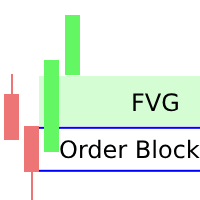
I've combined two trading strategies, the Order Block Strategy and the FVG Trading Strategy, by utilizing a combination of the FVG indicators and Order Blocks. The results have been surprisingly effective.
This is a two-in-one solution that makes it easy for traders to identify critical trading zones. I've optimized the settings so that all you need to do is install and trade; it's not overly complex to explain further. No need for any usage instructions regarding the trading method. You shou
Индикатор переведен с другой платформы, которая была разработана LuxAlgo.
Я добавил скользящие средние разных типов, а также разнообразие источников данных. В оригинальной версии скользящая средняя - это SMA и источник данных с рынка, собранный только с закрытия свечей.
В этой версии вы можете выбрать множество типов скользящих средних, а также источник данных, таких как high/low/HL2/HLC/HLC2/... .
Вот некоторые подробности от оригинального разработчика:
Индикатор Range Detector предна

В мире трейдинга тренд, который следует под углом 45 градусов, считается устойчивым. Однако точное измерение этого критического угла остается сложной задачей, поскольку четкого метода не существует. Трейдеры могут только догадываться, как он рассчитывается, сколько должно быть свечей и каков подходящий масштаб графика.
Мы решили эту проблему и логически определили все условия, и теперь представляем вам Trend Angle 45. Это инструмент, который визуализирует 45-градусную линию тренда на основе

Индикатор рисует уровни на каждый день. При входе во вчерашнюю зеленую зону - покупайте, а при входе во вчерашнюю красную зону - продавайте.
Стоп 20 пунктов. Цель - 20 пунктов или больше.
Просто разместите свои ордера и ждите.
Пары для торговли: EURUSD GBPUSD
Никаких специальных навыков не требуется. Алгоритм рассчитывает все самостоятельно.
Процент успеха отличный. Просто, но эффективно!

This indicator draws the prior Highs and Lows for multiple timeframes, and can display potential Take Profit and Stop Loss levels. In Rob Smith's # The Strat terms, these are potential entry points, or alternatively potential targets for open positions. I like to use them in both ways. On a lower timeframe, say 5 minutes to get a good entry on a daily or weekly level, and then as a potential target. Very small stops required giving an excellent risk/reward ratio. Please watch the DEMO video

Или (BD%), который представляет собой индекс волатильности, который измеряет волатильность в процентах, а не в пунктах. Идея BD% состоит в том, чтобы создать индекс, зависящий от классического стандартного отклонения (CSD), который колеблется от 0 до 100 процентов.
Вы можете использовать BD% для сравнения волатильности одной и той же ценной бумаги в разные периоды времени или в разных временных рамках. Кроме того, вы можете использовать BD% для сравнения волатильности между разными ценными бу

Update: For those who want to manually backtest this indicator, check this tool https://www.mql5.com/en/market/product/59248
The indicator will help make your calculation of stop loss easier as it will be visually aiding you in choosing where to put your stoploss level on the chart by calculating the current value of ATR indicator. For those who are unfamiliar with ATR, it is a useful indicator to calculate stoploss for trend following strategy. If volatility is high, ATR stoploss level will b
FREE

This indicator is not only for trading but also for learning, thanks to it, you can learn to identify trend, support and resistance.
You've probably heard about the Dow trend theory, where higher highs and higher lows indicate an uptrend, and lower highs and lower lows indicate a downtrend. This indicator determines this trend based on the Dow Theory. You just need to enter a number representing the number of candles between extremes. The optimal solution is the number 3 (H1 TF), unless you
FREE

This is a volume profile where you can customize the time period you want. You can do this with a line or choose automatic functions such as showing the volume from the last time period. The indicator also shows the maximum volume value (VPOC - VOLUME POINT OF CONTROL) and the average value, colors and settings you can adjust as you like, there are many possibilities. If you need an indicator that shows the constant volume time frames there is ...HERE... Volume Profile is an advanced charting
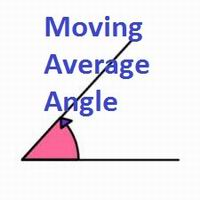
Данный индикатор показывает в отдельном окне угол скользящей средней в соответствии с вашими настройками. Значение угла отображается и в окне графика. Параметры отображения также можно настраивать. Основные особенности и входные переменные включают в себя: MAPeriod - период вашей скользящей средней. Значение по умолчанию - 5. LookBack - это очень важная переменная. Она позволяет вам установить бар, на основе которого измеряется угол. Например, если значение LookBack равно 5, индикатор будет расс

KT Higher High Lower Low marks the following swing points with their respective S/R levels: Higher High: The swing high made by the price that is higher than the previous high. Lower High: The swing high made by the price that is lower than the previous high. Lower Low: The swing low made by the price that is lower than the previous low. Higher Low: The swing low made by the price that is higher than the previous low.
Features The intensity of swing high and swing low can be adjusted by cha

5/10 копий по 30$ ---> следующая 50$ // версия MT5
Forex Vigor - это технический индикатор, который оценивает силу импульса 8 основных валют (EUR, GBP, AUD, NZD, USD, CAD, CHF, JPY). Индикатор опирается на математические расчеты, которые измеряют отсутствие корреляции между 28 валютными парами. Для расчета их значений он анализирует процентную разницу между ценами закрытия с помощью метода линейно-взвешенного усреднения (LWMA) плюс статистическая система, которая исключает значения, не предст
MetaTrader Маркет - уникальная площадка по продаже роботов и технических индикаторов, не имеющая аналогов.
Памятка пользователя MQL5.community расскажет вам и о других возможностях, доступных трейдерам только у нас: копирование торговых сигналов, заказ программ для фрилансеров, автоматические расчеты через платежную систему, аренда вычислительных мощностей в MQL5 Cloud Network.
Вы упускаете торговые возможности:
- Бесплатные приложения для трейдинга
- 8 000+ сигналов для копирования
- Экономические новости для анализа финансовых рынков
Регистрация
Вход
Если у вас нет учетной записи, зарегистрируйтесь
Для авторизации и пользования сайтом MQL5.com необходимо разрешить использование файлов Сookie.
Пожалуйста, включите в вашем браузере данную настройку, иначе вы не сможете авторизоваться.