Смотри обучающее видео по маркету на YouTube
Как купить торгового робота или индикатор
Запусти робота на
виртуальном хостинге
виртуальном хостинге
Протестируй индикатор/робота перед покупкой
Хочешь зарабатывать в Маркете?
Как подать продукт, чтобы его покупали
Технические индикаторы для MetaTrader 4 - 24

Heikin-Ashi charts , developed by Munehisa Homma in the 1700s. Munehisa Honma was a rice merchant from Sakata, Japan who traded in the Dojima Rice market in Osaka during the Tokugawa Shogunate. He is considered to be the father of the candlestick chart. Th e man who invented the use of candlestick charts for finding and profiting from chart patterns.He was a billionaire trader on those days if we compared his net-worth with todays dollar . Heikin Ashi Scanner is an Multi-Currency and Multi

This indicator tool provides mini charts, with adjustable symbol/tf that can be dragged and resized into place. Lightweight operation with multiple mini charts are supported.
Chart features: adjustable symbol and tf draggable resizeable multiple mini charts color styling and font sizing, foreground/background colors candle coloring candle styles; candles, bars, line, high-low channel
optional background color gradient predfined period separators on all tf's (eg 1hr/1day sep on 1Min, 4hr/1day

Must be owned and used by Fibonacci traders who like to open position by pending order (limit order). The strategy is that you just have to wait for the automatic custom fibonacci appear then manual place your pending order, stop loss and take profit at the level of Fibonacci. The position will be opened when the price make a successful retest. Fibo Heart Indi come with pop-up alert, email and mobile push notification. Suitable for all instruments and all time frames. Don't miss the trading set

Индикатор на основе (Williams` Percent Range) анализирует касания сигнальной линии по стенкам канала и формирует зоны для принятия решения о направлении хода цены. Для удобства встроена функция оповещения. Также можно включать и отключать искомые зоны. На одном графике можно использовать несколько индикаторов с разными настройками. Это поможет подобрать оптимальную стратегию.
FREE
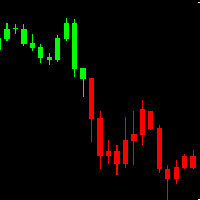
AH Candles MT4 AH Candles MT4 is a new product that allows identifying the current market phase (uptrend and downtrend ).
This indicator paints bars in different colors depending on the current state of the market trend ( Green and Red )
AH Candles MT4 is use for trading currencies
Advantages Suitable for intraday and swing trading. The indicator base on EMA method to calculate Period Parameters It can be used as a standalone tool or together with other indicators.
How to use
FREE
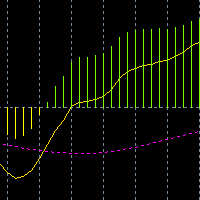
одель MACD, а также добавлены две линии, когда они пересекаются, чтобы получить сигнал покупки или продажи.
желтый сигнал линии в розовой линии сигнала, розовый сигнал вниз, желтый сигнал сверху, что означает больше.
желтый сигнал под линией бледного сигнала, желтый сигнал вниз, розовый сигнал сверху, обозначает пустоту.
линия с нулевыми или выше столбчатыми линиями переводится на светло - зелёные.
под нулевыми линиями столбчатая линия переводится на светло - желтый.
FREE

RaysFX EMA Crossover Scopri i potenziali punti di inversione del mercato con l’indicatore di Crossover EMA di RaysFX. Questo indicatore utilizza una combinazione di due medie mobili esponenziali (EMA) - una più veloce e una più lenta - per identificare i possibili punti di ingresso e uscita. Caratteristiche principali : Due EMA : Utilizza una EMA più veloce e una più lenta per catturare i movimenti di mercato a breve e lungo termine. Segnali di crossover : Genera un segnale quando l’EMA più v
FREE
Enhance your trading strategy with this indicator from tr1cky.com . When the indicator turns red - Hold off When the indicator turns green - Proceed with the trade in the direction indicated by the indicator This indicator provides insights into the market’s momentum and the optimal trading direction. Derived from its successful Expert Advisor counterpart, the RSIMFI100 go indicator is now available to all. Happy trading!
FREE
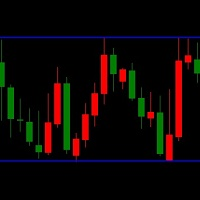
LT Triple Support Resistance Screen Method is a kind of levels indicator that consist of three SR lines. It is built by MQL4 programming language and can be used to MT4 platform. A free version indicator to determine the support and resistance levels easily This indicator works based on the screen method to calculate the most appropriate value for each buffer. A complex algorithm based on long research is applied to this free custom indicator. But this indicator has limited features and simpler
FREE

Indicador "Heikin Ashi Master" para MetaTrader: Transforma tu Análisis con Velas Japonesas Suavizadas El indicador "Heikin Ashi Master" es una herramienta innovadora diseñada para traders que buscan una perspectiva única del mercado a través de las Velas Japonesas. Compatible con MetaTrader, este indicador suaviza la acción del precio, ofreciendo una interpretación simplificada y visualmente atractiva de las tendencias y cambios en el mercado. Características Destacadas: Suavizado de la Acción
FREE
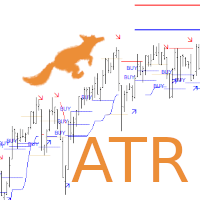
Are you looking for ATR Levels, ATR Trend, ATR Support and Resistance Indicators ? Now you have all in one !!! Info on your chart is showing you: where current price and levels are, what is current trend and signals. Search for an entry with low risk for trading by Lisek ATR Indicator. There are many ways to trade with Lisek ATR Indicator: Trade Support and Resistance Levels. Trade pullbacks (Range trading). Trade breakouts. Trade reversals. Take profit or set stop-loss based on ATR Levels.
FREE

Stochastic RSI производит расчет стохастика на индикаторе RSI. Индекс относительной силы (RSI), разработанный Дж. Уэллсом Уайлдером, является известным импульсным осциллятором, измеряющим скорость и изменение ценового движения.
Особенности Находит ситуации перекупленности и перепроданности. Звуковое оповещение при достижении уровня перекупленности/перепроданности. Получайте уведомления по электронной почте и/или на мобильное устройство при обнаружении сигнала. Индикатор не перерисовывается. Во
FREE
Тиковый индикатор
является очень мощным инструментом для скальпинга. Он показывает вам движение вверх и вниз на рынке.
Таким образом, вы можете определить направление намного быстрее.
Индикатор очень прост в установке и может использоваться на всех таймфреймах и всех парах форекс, биткоин .....
Просто установите файл в папку индикатора вашего терминала MT4, обновите или перезапустите терминал и перетащите его на график, на котором вы хотите торговать.
Лучший способ - следить за кроссо

Introducing the “Symbol Cost Info MT4” indicator – your ultimate tool for staying ahead in the forex market! This innovative indicator is designed to empower traders with real-time cost information, directly on their charts. Here’s why every trader needs the “Symbol Cost Info MT4” in their arsenal: Real-Time Spread Monitoring : Keep a close eye on the spread for any currency pair, ensuring you enter the market at the most cost-effective times. Pip Value at Your Fingertips : Instantly know t
FREE
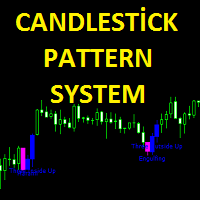
Candlestick pattern system finds 40 candle formations. Features Has the feature to send the notification. It has candlestick patterns feature. Bullish patterns feature. Bearish patterns feature. Trend filter and reliability features.
Parameters Show alert - Send alert Send email - Send alerts to mail address. Look back - Retrospective calculation === PATTERN SETUP === Show bullish patterns - Open close feature Show bearish patterns - Open close feature Trend filter - Open close feature
Highly configurable RSI indicator. Features: Highly customizable alert functions (at levels, crosses, direction changes via email, push, sound, popup) Multi timeframe ability Color customization (at levels, crosses, direction changes) Linear interpolation and histogram mode options Works on strategy tester in multi timeframe mode (at weekend without ticks also) Adjustable Levels Parameters:
RSI Timeframe: You can set the current or a higher timeframes for RSI. RSI Bar Shift: you can set
FREE

The Elder Impulse System was designed by Alexander Elder and featured in his book. According to Elder, “the system identifies inflection points where a trend speeds up or slows down”. The Impulse System is based on two indicators, a exponential moving average and the MACD-Histogram. The moving average identifies the trend, while the MACD-Histogram measures momentum. As a result, the Impulse System combines trend following and momentum to identify tradable impulses. This unique indicator combina

This indicator draws regular bullish and bearish divergences in real-time onto the charts. The algorithm to detect those divergences is based on my 10+ years experience of detecting divergences visually. The divergences are drawn as green and red rectangles on the charts. You can even do forward testing in the visual mode of the strategy tester.
Parameters Fast EMA Period: The period of the fast EMA of the MACD. Default value is 12.
Slow EMA Period: The period of the slow EMA of the MACD. Def

Уникальная мультивалютная авторская стратегия, разработана для торговли на временном периоде Н1, что позволяет определять глобальные точки входа в рынок и получать максимальную прибыль по каждой сделке. Точка входа в рынок рассчитывается с помощью множества авторских формул и алгоритмов. Рекомендуем использовать индикатор одновременно на нескольких торговых инструментах. Огромным плюсом Big Deals System является наличие информационной панели, в которой пользователь может увидеть актуальную инфор

English : A GF_support+MA.mq4 indikátor átfogó eszközként szolgál a kereskedési döntések támogatására a MetaTrader 4 platformon. Fő funkciója, a LookBackPeriod beállítás lehetővé teszi a kereskedők számára, hogy beállítsák a támogatási és ellenállási szintek kiszámításához használt időszak hosszát. Ez a paraméter határozza meg az elemzési periódus hosszát a gyertyákban, ami döntő fontosságú a piaci csúcsok és mélypontok azonosításához, ezáltal pontosan megrajzolja a támasz- és ellenállásvonala
FREE

Exclusive Limited Time Offer! Grab this useful indicator for a lifetime at just $49. Volatility indicator dashboard designed to revolutionize how traders perceive and navigate market volatility. Track volatile for multiple currency pairs one at time for multiple timeframes. Works best with Forex Market, Gold, Silver, Oil. Available in MT4, MT5. Indicator Features: Multi-Symbol, Multi-Timeframe Dashboard: Gain a strategic advantage by simultaneously monitoring volatility across various currenc

WaveTrend Momentum Oscillator - это модификация популярного и удобного осциллятора WaveTrend. WaveTrend Momentum Oscillator добавляет компоненту темпа в расчеты WaveTrend, чтобы более быстро предоставлять более точные точки входа в условиях трендового рынка. Вы предпочитаете оригинальный осциллятор WaveTrend? WaveTrend Momentum Oscillator позволяет переключаться между темповой и оригинальной версиями WT. Они оба предоставляют ценную информацию в зависимости от рыночных условий. Когда линии WT на
Привет дорогой друг! Вот моя история. После долгих попыток торговать вручную решил использовать робота. Начал писать своего робота. Но тестирование занимало огромное время! Параллельно пробовал чужих роботов. И опять тратил много времени на тестирование. Ночные скальперы, новостные, интрадей и многие другие классы... Требовалось точно знать, когда робот торгует, когда в прибыль, а когда в убытке. У некоторых роботов есть не описанные особенности торговли по времени. В результате для себя напис

The Fisher Transform is a technical indicator created by John F. Ehlers that converts prices into a Gaussian normal distribution. The indicator highlights when prices have moved to an extreme, based on recent prices. This may help in spotting turning points in the price of an asset. It also helps show the trend and isolate the price waves within a trend. The Fisher Transform is a technical indicator that normalizes asset prices, thus making turning points in price clearer. Takeaways Turning poi
FREE
Индикатор Stretch – ценовая модель Тоби Крэйбела (Toby Crabel), которая находит минимальное среднее значение ценового движения/отклонения от цены открытия в определенный период времени и рассчитывает два уровня прорыва для каждого торгового дня. Расчет производится с помощью 10-периодной простой скользящей средней (SMA), представляющей собой абсолютную разницу между ценой открытия и ценовым максимумом или минимумом (в зависимости от такого, какое из значений меньше). Полученный результат использ
FREE

Индикатор MultiCurrencyWPR (MCWPR) рассчитывает привычный показатель WPR для отдельных валют Форекс (т.е. их "чистых" относительных стоимостей, выделенных из валютных пар), индексов, CFD и прочих групп символов. Внутри он использует встроенный индикатор CCFpExtraValue для получения относительной "силы" выбранных инструментов. В отличие от стандартного WPR на конкретном символе, этот индикатор обеспечивает глобальную картину на выбранную часть рынка и выделяет инструменты с наибольшим потенциалом

Limited time offer! For the launch of NextBot , which has been working on a real account for about a year doubling the initial capital, the price of this indicator will drop to FREE ! Introducing a pragmatic and innovative tool for MetaTrader 4 (MT4) traders: the Linear Regression Next channel indicator, enhanced with the determination coefficient R 2 . This indicator serves as a foundational tool for traders seeking to understand market trends through the lens of statistical analysis, spe
FREE
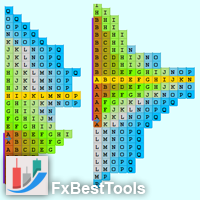
Definition : A Market Profile is an intra-day charting technique (price vertical, time/activity horizontal). Market Profile is best understood as a way to see order in the markets. Market Profile was a way for traders to get a better understanding of what was going on, without having to be on the trading floor. The current indicator is developed based on Easy-to-Use architecture including a wide range of visual settings.
Major Features of Indicator : Various Views of Market Profile The indica

Currency Power Meter показывает силу основных валют относительно друг друга. Индикатор показывает относительную силу валюты/пары в текущий момент на определенном промежутке времени (H4, день, неделя, месяца). Он будет полезен для внутридневых трейдеров, свинг-трейдеров и долгосрочников, так как предоставляет возможность настройки периода. Сила валюты - это реальная причина возникновения тренда на рынке: на паре из наиболее сильной и наиболее слабой валюты будет самый сильный тренд. Как известно,
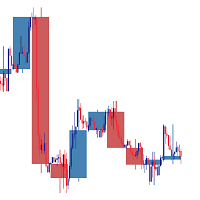
This is a Free Trial work on EURUSD. Discover the incredible potential of "Higher Timeframe Bars," your go-to MetaTrader 4 indicator for enriched trading insights. Revolutionize your trading strategy with a deeper understanding of the markets, all while staying on your current chart.
Key Features: - Seamlessly compatible with MetaTrader 4. - Choose from an array of higher timeframes, including M3, M5, M10, H1, H4, D1, and more. - Customize bar colors and enable optional borders for enhanced v
FREE

Данный индикатор является интерпретацией Индекса Среднего Направления Движения (Average Directional Movement Index, ADX), который помогает определить наличие ценовой тенденции. Его разработал и подробно описал в книге «Новые концепции технических торговых систем» Уэллс Уайлдер. Данный индикатор отображает на графике цены сигналы при пересечении +DI и -DI и сигналы при падении или росте значения ADX в соотношении к взаимному расположению +DI и -DI. Сигналы индикатора на покупку работают также как
FREE

Th3Eng Panda trend is a powerful indicator that works perfectly for scalping trades as well as swing trades. Th3Eng Panda trend is not just an indicator, but a very good trend filter. You can setup it on H4/H1 to Find the main trend and start scalping on M5/m15/m30 Time Frames. Works with all pairs and all Time Frames.
Inputs:
Section #1 History : Maximum number or bars to draw the last signals. (Default 5000) Draw Candles : Draw red candle when sell signal and green when buy signal. (tr
FREE
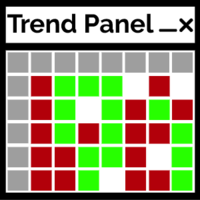
Панель трендов - это простой удобный инструмент, который будет отображать подтвержденное направление тренда таймфреймов M1 - D1 по десяти выбранным пользователем парам. Индикатор предназначен для добавления подтверждения направления в любую стратегию/шаблон, а затем также работает как чистый интерактивный интерфейс для быстрого переключения графика на другую пару или таймфрейм. Групповой чат: https://www.mql5.com/en/users/conorstephenson Пожалуйста, свяжитесь со мной после покупки, чтобы получ
FREE

Индикатор BinaryWizardMT4 - мощный инструмент для торговли краткосрочными бинарными опционами. По сути, это готовая торговая система для краткосрочных бинарных опционов. Индикатор вычисляет опорную точку и краткосрочные уровни поддержи и сопротивления. Как только текущая цена пересекает уровень сопротивления, формируется сигнал на продажу (SIGNAL: SELL), а если цена пересекает уровень поддержки, формируется сигнал на покупку (SIGNAL: BUY).
Параметры x1, y1 - координаты привязки окна индикатора
FREE

TPSpro Screenshot это и ндикатор который скринит рабочее пространство графика и сохраняет его в заданную вами папку на компьютере с заданным разрешением и с заданным интервалом времени. Имеются следующие настраиваемые параметры: Screenshot Width - Ширина скриншота Screenshot Height -Высота скриншота The name of the folder for screenshots (by pressing "]") - Имя папки для скриншотов Rewritable File Name - Имя перезаписываемого файла Step in seconds for a photo - Шаг в секундах для фото Creat
FREE

Panda Oscillator - новый авторский индикатор предназначенный для скальпинга . Индикатор дающий сигналы на основе показаний целого комплекса стандартных и авторских инструментов.
Основные характеристики Panda Oscillator : Аналитические функции Может использоваться на любых валютных парах и тайм-фреймах; Индикатор не перерисовывается; Отлично подходит дополнением к другим индикаторам; Графические возможности Занимает минимальное кол-во места на графике; Гибкие настойки; Легкий в усвоении;
FREE

As the name implies, TIL Daily OHLC is a simple, straightforward yet effective tool to keep track of yesterday’s last Open, High, Low and Close prices. Any experienced trader knows the importance of these price levels – they are often used to navigate and predict the current day’s trend and price action as strong support and resistance. When applied to a chart, the indicator shows 4 plots that projects the 4 price levels from the previous day to the next one. Each price level is color coded and
FREE
«Trend reversal ml4» – это уникальный индикатор, разработанный для определения моментов разворота цены в первое время. Это уже готовая торговая система для Metatrader4. Индикатор не перерисовывает свои значения! На основе продвинутых алгоритмов и технического анализа этот индикатор дает вам сигналы о возможных точках входа и выхода на рынок, помогая вам принимать обоснованные решения.
Преимущества индикатора: высокая точность сигналов. Индикатор сам показывает трейдеру, правильно ли он настро

A. Этот сводный индикатор показывает дневную сводную цену.
B. Он также показывает сопротивление R0,5, R1, R1,5, R2, R2,5 и R3
C. Это также показывает поддержку S0.5, S1, S1.5, S2, S2.5 и S3
ВХОД:
Под входом вы увидите 3 переменных
1.ExtFomula. Здесь вы можете установить предпочтительный выход для сопротивления или поддержки в окне графика на значение не более 1, 2 или 3. 1 представляет выход на сопротивление или поддержку 1. 2 представляет выход на сопротивление или поддержку 2. 3 пред
FREE

Note : New in 1.6: the indicator now exports the trade signal (but not displayed). Go long with light blue. Go short with red. Exit otherwise. Signal to be imported to your EA using iCustom. This indicator provides Best of the Best linear filter momentum oscillators that I am aware of (Low Pass Differentiators, LPD's) . All of them are recent developments by this developer, or other researchers. The oscillator line is the first buffer of the indicator, and can be called in other indicators or
FREE

This indicator will show yesterday and today high low, very useful to understand the market sentiment. To trade within the range/ break out. Previous day low- can act as support- can used for pull back or break out Previous day high- can act as resistance- can used for pull back or break out The previous day high low breakout strategy refers to the day trading technique that provides traders with multiple opportunities to go either long or short . The main idea is to identify the trend in its m
FREE

Real Trade торгует на таймфреймах до 1 часа. Торговля в восходящем и нисходящем направлениях. Торгуйте с более высокими временными направлениями тренда и торгуйте на первой свече. Используйте противоположное для выхода или используйте соотношение для выхода 1:1 или выше вместе с трейлинг-стопом. Торгуйте по реальным трендам в часы активности и с более высоким направлением тренда для достижения наилучших результатов. Загрузите индикатор в тестер для изучения результатов и потенциала. Используйте

Привет!
Я Татсурон, японский индивидуальный инвестор. Я работал на Форексе на сумму более 1 миллиарда иен. Итак, позвольте мне представить очень полезный индикатор, который я использую.
Индикатор типа экологического подтверждения. Мы сузили точки разворота, известные мировому рынку, до двух, дневных и ежемесячных. Daily - это руководство для ежедневной торговли, а ежемесячное - это материал для разрывов или разворотов на рынках с быстрым разрывом.
Это полезно в качестве основы для сбора
FREE

This indicator is an addition to "Trend Edges."
The "Trend Edges histogram" indicator determines whether the trend is rising or falling. It is suitable for any time frame (tested on DAX).
Find a trending pair, index or CFD. Additionally :
-Sound alert on trend change.
-Alert Notification
-Alert Notification on your mobile phone Check my other indicators.
FREE

Описание Продукт основан на применении скользящей средней к индикатору RSI. Подтвержденные пересечения скользящей средней с линией RSI отмечаются стрелками на графике. При пересечении снизу вверх отображается стрелка на покупку и наоборот. Стрелки не перерисовываются, так как индикатор использует лишь подтвержденные значения и ожидает закрытия свечи перед тем, как вывести стрелку на график. Индикатор также может выдавать алерты при появлении стрелок. Предусмотрены 3 типа алертов - всплывающие, о
FREE

Keltner Trend Pro - Unleash the Power of Price Action! Are you ready to transform your trading approach? Meet Keltner Trend Pro, an Expert Advisor meticulously crafted to harness the dynamic movements of the market using the renowned Keltner Channel and Average True Range (ATR) indicators. Limited-time Special Opportunity: Seize the moment! Be among the first 10 (Purchasing 0/10) to seize this unique opportunity, and not only will you acquire a top-tier trading algorithm but also enjoy an exclu
FREE
Это бесплатная версия индикатора Double Top Tracker . В отличие от полной версии некоторые функции отключены, а параметры не могут быть изменены. Индикатор параллельно анализирует ценовые графики нескольких валютных пар на всех таймфреймах и отправляет уведомление, как только обнаруживаются паттерны "Двойная вершина" и "Двойное дно". Когда цена достигает второй вершины, индикатор формирует сигнал. "Двойная вершина" (Double Top) — паттерн разворота тренда, который состоит из двух последовательны
FREE

Индикатор True Points PRO анализирует динамику изменения цен и определяет истинные точки разворота. Индикатор рассчитывает и отображает общую прибыль и вероятность ее достижения. Индикатор имеет встроенные уровни тейк-профита: TP1 фиксирует прибыль на заданном уровне; TP2 учитывается автоматически (регулируется параметром Низкого уровня). Информация о прибыли и текущем сигнале отображается на панели информации о движении. Параметр Результат вычисляет все прибыли и убытки.
Основные пар
FREE

A pin bar pattern consists of one price bar, typically a candlestick price bar, which represents a sharp reversal and rejection of price. The pin bar reversal as it is sometimes called, is defined by a long tail, the tail is also referred to as a “shadow” or “wick”. The area between the open and close of the pin bar is called its “real body”, and pin bars generally have small real bodies in comparison to their long tails.
The tail of the pin bar shows the area of price that was rejected, and
FREE

Il nostro Indicatore Combinato RaysFX CCI-RSI è uno strumento unico che combina due dei più popolari indicatori di analisi tecnica: l’Indice di Forza Relativa (RSI) e l’Indice del Canale delle Materie Prime (CCI). Caratteristiche : Combinazione di CCI e RSI : L’indicatore calcola la differenza tra i valori di CCI e RSI per ogni barra del grafico. Media Mobile Semplice (SMA) : L’indicatore calcola una SMA su queste differenze e traccia due linee sul grafico. Segnali di trading : Ogni volta che qu
FREE

BolingCustom is a Trend indicator designed for all Time frames and all currency pairs. For a better experience, it is recommended to use in time frames above 15 minutes.
Due to its understandable and simple presentation on the chart, even beginners can easily learn how to use it.
If you have any problems or questions, let us know. We will be happy to contact you: Direct massage
How this indicator works is that it shows the trend using a combination of several indicators such as the Bo
FREE

VR Ticks - это специальный индикатор для стратегий на основе скальпинга. Благодаря этому индикатору, трейдер может видеть тиковый график напрямую на основном графике финансового инструмента. Тиковый график позволяет максимально точно войти позицией в рынок или закрыть позицию в рынке. VR Ticks строит тиковые данные в виде линий меняющих цвет в зависимости от направления - это позволяет визуально понимать и оценивать ситуацию на тиках. Преимущество тиковых графиков заключается в том что они не уч
FREE

Advanced Currency Strength Indicator
The Advanced Divergence Currency Strength Indicator. Not only it breaks down all 28 forex currency pairs and calculates the strength of individual currencies across all timeframes , but, You'll be analyzing the WHOLE forex market in 1 window (In just 1 minute) . This indicator is very powerful because it reveals the true movements of the market. It is highly recommended to analyze charts knowing the performance of individual currencies or

Представляем Auto Trendline, инновационный индикатор MT4, который автоматизирует процесс
рисования линий тренда на ваших графиках. Попрощайтесь с утомительной и трудоемкой задачей ручного рисования линий тренда,
и пусть Auto Trendline сделает всю работу за вас!
*Свяжитесь со мной после покупки, чтобы отправить вам инструкции и пошаговое руководство.
Благодаря усовершенствованному алгоритму Auto Trendline автоматически определяет и рисует линии тренда,
экономя ваше время и усилия. П
IntradaySignals Intraday Signals is a visual and effective semi-automatic trading system, that: generates possible entry points to open BUY and SELL trades; displays recommended Take Profit and Stop Loss; displays current profit on open trade; displays current spread. The profitability of the indicator is shown in the screenshot on the example of the GBPUSD pair Does not redraw and works on opening bar. Time frames - M1-H1. Recommended TimeFrame-M5-M15. Signals are produced based on the used
FREE
Highly configurable OBV indicator.
Features: Highly customizable alert functions (at levels, crosses, direction changes via email, push, sound, popup) Multi timeframe ability Color customization (at levels, crosses, direction changes) Linear interpolation and histogram mode options Works on strategy tester in multi timeframe mode (at weekend without ticks also) Adjustable Levels Parameters:
OBV Timeframe: You can set the lower/higher timeframes for OBV. OBV Bar Shift: Y ou can set the offs
FREE

H I G H - P R O B A B I L I T Y - B R E A K O U T T R E N D L I N E I N D I C A T O R This is no ordinary trendline indicator. It has a highly-probability algorithms incorporated in the script to display only trendlines that may give a very high chance of price breakout. The indicator is not a stand alone indicator. Trader should interpret it together with their very own analysis technique to come up with a more efficient trading strategy. You can use with it other trend indic
FREE

Indicator draws Round Number lines by distance of pips. 1. You can enable / disable indicator to show / hide the lines. 2. You can set distance of pips between the lines. 3. You can edit the number of lines. 4. You can edit properties of lines by inputs (style (DASH, DOT, SOLID, ...) , width (1 for DASH, DOT, 2 is not for DASH, DOT, it only SOLID), color). When indicator is deleted from the chart, the lines will be removed.
FREE

Индикатор создан чтобы отобразить на графике данные ценовые уровни: Максимум и минимум прошлого дня. Максимум и минимум прошлой недели. Максимум и минимум прошлого месяца. В настройках индикатора, для каждого типа уровней, можно менять стиль линий, цвет линий, включить и отключить нужные уровни. Верcия точно такого же индикатора но только со звуковыми оповещениями тут - Time Levels with Alerts .
Настройки ----Day------------------------------------------------- DayLevels - включение / отключен
FREE

The Stochastic RSI indicator (StochRSI) is essentially an indicator of an indicator. It is used in technical analysis to provide a stochastic calculation to the RSI indicator. This means that it is a measure of RSI relative to its own high/low range over a user defined period of time. The Stochastic RSI is an oscillator that calculates a value between 0 and 1 which is then plotted as a line. This indicator is primarily used for identifying overbought and oversold conditions.
FREE

Hypothetical trend line display
Distance from the trend line
Can be used in all symbols
Can be used in all time frames
An interesting indicator for predicting small waves
The greater the distance from the trend line, the more likely it is to return to the trend line
Settings:
The first three(osic 1,2,3):
are the same as the settings of the zigzag indicator
The bigger these numbers are, the bigger the trend lines and the longer the trend
Back Show:
The number of candles displayed
FREE

За основу идеи алгоритма и отображения взят индикатор Currency Power Meter, отличия данной версии в снятии ограничений на количество отображаемых валют, код более компактный и быстрый, есть возможность получения значений для текущего бара через буферы индикатора. Что показывает индикатор : тонкая полоса и верхнее число напротив валюты показывает индекс относительной силы за последние N часов (N задаётся переменной Hours в параметрах), более широкая полоса показывает дневной индекс. Чем больше ва
FREE
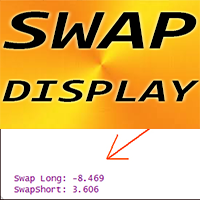
This is Free product you are welcome to use for your needs! Also, I very appreciate your positive feedbacks! Thanks a lot! // More great Expert Advisors and Indicators are available here: https://www.mql5.com/en/users/def1380/seller // Also you are welcome to join to profitable , stable and reliable signal https://www.mql5.com/en/signals/1887493 Forex Indicator SWAP Display for MT4 , Trading Support . SWAP Display indicator shows current swaps for long and short trades of forex pair
FREE

Индикатор для определения направления тренда. Используется популярный индикатор Аллигатор Билла Вильямса. Показывает на одном графике состояние рынка всех таймфреймов. Как известно, основную прибыль на рынке Форекс трейдеры получают именно от торговли по тренду, а убытки чаще всего получают на флетовых участках рынка. Поэтому, чтобы получать прибыль на рынке Форекс, трейдер должен научиться легко и безошибочно определять трендовые участки рынка, а так же направление текущего тренда. Для этих цел
FREE

The YK-LOT-SIZE is an indicator that displays the total Lot Size and profit/loss of all trade orders for the current symbol on the price chart. It has the following features: Shows the total Lot Size of buy orders (BUY) and sell orders (SELL) on separate lines. Displays the profit/loss of buy orders (BUY) and sell orders (SELL) by calculating the sum of profit, commission, and swap. Users can customize the color of the displayed text through the input parameter. The information is displayed at t
FREE

Торговать с помощью индикатора MACD стало еще удобнее. Гибкие настройки помогут тебе подобрать то, что действительно тебе нужно в твоей торговле. Используй ту стратегию, которая тебе нужна - в индикаторе используются 3 стратегии. Скачивай демо прямо сейчас! Рекомендую посмотреть моего советника - Night Zen EA Подпишись на мой telegram канал, ссылка в контактах моего профиля - мой профиль Смотри также другие мои продукты на mql5.com - мои продукты Преимущества индикатора: В данном индикаторе инте
FREE
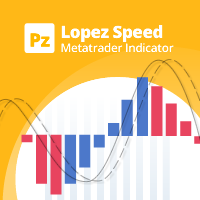
Осциллятор рассчитывает различные векторы цены/времени для отображения итогового направления рынка на основе суммы всех векторов цены/времени и двух скользящих средних, чтобы рассчитать, ускоряется рынок или замедляется. Прост в освоении и использовании
Эффективный фильтр сделок Уникальный алгоритм вычисления скорости Не перерисовывается
Снабжен различными алертами
Может использоваться в качестве эффективного фильтра сделок по тренду. Основные принципы использования: если синяя скользящая сре
FREE

Сигнальный индикатор, состоящий из нескольких широко известных индикаторов, обрабатывающих данные последовательно. 2 варианта - для графика и подвальный. В настройках возможно включить оповещения о смене тренда (алерты) звуковые, на e-mail и push. Есть возможность менять цвета и толщину линий, цвета и коды стрелок, количество расчетных баров и отдельно настраивать параметры входящих в состав индикаторов.
FREE

Индикатор рисует уровни Фибоначчи с выделенными Ценовыми метками.При установке индикатора на график необходимо создать трендовую линию с именем указанным в поле" Unique name of trend line to place fib on ". По умолчанию имя=" Unique name of trend line to place fib on" = "+" .В индикаторе можно заменить уровни фибоначчи по своему усмотрению.Также меняются цвет,стиль,толщина линий и т. д.
FREE
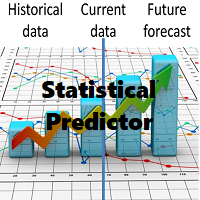
Waddah Attar Statistical Predictor
This indicator show you the Statistical Forecast for any symbol. it depends on a history data . the result show on a new day and still with no change until end of the day . with this indicator you can : know the main direction . know the range of the movement . know high and low in the current day . use indicator levels in any expert you made to auto trade .
Preferably used with main symbols like EURUSD, GBPUSD, AUDUSD, NZDUSD, USDJPY, USDCHF, USDCAD, Gold,
FREE
MetaTrader Маркет - торговые роботы и технические индикаторы для трейдеров, доступные прямо в терминале.
Платежная система MQL5.community разработана для сервисов платформы MetaTrader и автоматически доступна всем зарегистрированным пользователям сайта MQL5.com. Ввод и вывод денежных средств возможен с помощью WebMoney, PayPal и банковских карт.
Вы упускаете торговые возможности:
- Бесплатные приложения для трейдинга
- 8 000+ сигналов для копирования
- Экономические новости для анализа финансовых рынков
Регистрация
Вход
Если у вас нет учетной записи, зарегистрируйтесь
Для авторизации и пользования сайтом MQL5.com необходимо разрешить использование файлов Сookie.
Пожалуйста, включите в вашем браузере данную настройку, иначе вы не сможете авторизоваться.