Смотри обучающее видео по маркету на YouTube
Как купить торгового робота или индикатор
Запусти робота на
виртуальном хостинге
виртуальном хостинге
Протестируй индикатор/робота перед покупкой
Хочешь зарабатывать в Маркете?
Как подать продукт, чтобы его покупали
Технические индикаторы для MetaTrader 4 - 27
Description:
This indicator (with its Fibonacci algorithm) marks Buy and Sell zones, which indicate where a trend has a higher probability of continuing either upward, or downward.
Additionally, there are horizontal lines drawn for each day, which show a high probability level of where price is likely to break out, and continue either higher, or lower. This indicator will never repaint.
Features: The main strength of this indicator is that the user is able to visually assess what the

Индикатор Point - Percent Price Channel ( PPPC или PP Price Channel ) предназначен для отображения на графике канала, ширина которого задаётся как в процентах от текущей цены так и в пунктах. Его внешний вид представлен на слайде 1. При движении рынка вверх верхняя граница канала строится по ценам High свечей. При этом нижняя граница движется вслед за верхней на строго указанном расстоянии. При касании ценой нижней границы канала индикатор переключается на построение тепе
FREE
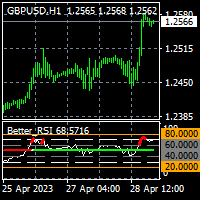
To get access to MT5 version please contact via private message. This is the exact conversion from TradingView: " Better RSI with bullish / bearish market cycle indicator" by TradeCalmly.
This is a light-load processing and non-repaint indicator. All input options are available. Buffers are available for processing in EAs. You can message in private chat for further changes you need.
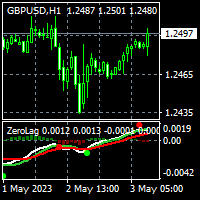
To get access to MT5 version please click here . This is the exact conversion from TradingView: "Zero Lag MACD Enhanced - Version 1.2" by " Albert.Callisto ". This is a light-load processing and non-repaint indicator. All input options are available. Buffers are available for processing in EAs. You can message in private chat for further changes you need. Thanks
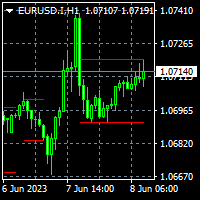
To get access to MT5 version please contact via private message. This indicator is not a standard indicator and you may get into trouble installing it. Please contact via private chat if you face trouble. This is exact conversion from TradingView: "Consolidation Zones - Live" by "LonesomeTheBlue". This is a light-load processing indicator. Updates are available only upon candle closure. Buffers are available for processing in EAs. It is a repaint indicator. So previous buffer values do not repre
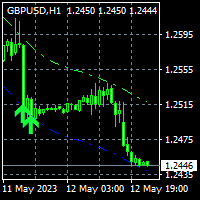
To get access to MT5 version please contact via private message. This is the exact conversion from TradingView:Nadaraya-Watson Envelope" by " LuxAlgo ". This is not a light-load processing indicator. It is a REPAINT indicator. All input options are available. Buffers are available for processing in EAs. You can message in private chat for further changes you need. Thanks.
To get access to MT5 version please click here . This is the exact conversion from TradingView:"HIGH AND LOW Optimized Trend TrackerHL OTT" by "kivancozbilgic" This is a light-load processing indicator. It is a non-repaint indicator. Colored Candle and Highlighting options are not available. Buffers are available for processing in EAs. You can message in private chat for further changes you need. Thanks.

To get access to MT5 version please click here . This is the exact conversion from TradingView: "[SHK] Schaff Trend Cycle (STC)" by "shayankm". This is a light-load processing indicator. This is a non-repaint indicator. Buffers are available for processing in EAs. All input fields are available. You can message in private chat for further changes you need. Thanks for downloading
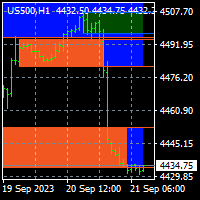
To get access to MT5 version please create personal order. This is the exact conversion from TradingView: Order Blocks & Breaker Blocks [LuxAlgo] This is a light-load processing and repaint indicator. All input options are available. This is not a multi time frame indicator. Buffers are available for processing in EAs. You can message in private chat for further changes you need.

To get access to MT5 version please click here . Also you can check this link . This is the exact conversion from TradingView: "UT Bot" by "Yo_adriiiiaan". This is a light-load processing indicator. This is a non-repaint indicator. Buffers are available for processing in EAs. All input fields are available. You can message in private chat for further changes you need. Thanks for downloading
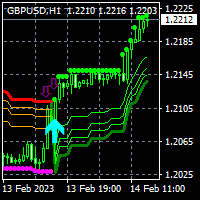
To get access to MT5 version please click here . This is the exact conversion from TradingView: "SwingArm ATR Trend Indicator" by " vsnfnd ". Also known as : "Blackflag FTS" by "Jose Azcarate" This is a light-load processing and non-repaint indicator. All input options are available except multi time frame Buffers are available for processing in EAs. Extra option to show buy and sell signal alerts. You can message in private chat for further changes you need.

Renko Trade Alarm is designed to work on chart with Renko and Mean Renko candles. It generate B uy and S ell signals on the chart and send notifications. Visualization of signals: Swing - Formations 123. Pattern - Double Bottom, Double Top, Triple Bottom, Triple Top, Formations 123 Reverse. Scalp - Periodic change in the price direction, plus additional filters in the form of oscillators Stochastic and MACD. Ichi - Signals filtered by the Ichimoku indicator. For correct operation an offl

OB Breakout is alert indicator that identifies when a trend or price move is approaching exhaustion(Supply and Demand) and ready to reverse. It alerts you to changes in market movement which typically occur when a reversal or major pullbacks are about to or have happened. The indicator identifies breakouts and price momentum initially, every time a new high or low is formed near a possible Supply or Demand level point. The indicator draws in a rectangle on Supply or Demand Zones. Once price we

The principle of this indicator is very simple: detecting the trend with Moving Average, then monitoring the return point of graph by using the crossing of Stochastic Oscillator and finally predicting BUY and SELL signal with arrows, alerts and notifications. The parameters are fixed and automatically calculated on each time frame. Example: If you install indicator on EURUSD, timeframe M5: the indicator will detect the main trend with the Moving Average on this timeframe (for example the Moving

Индикатор представляет собой всем известный ZigZag, но отличается тем, что его построение основывается на показаниях средней линии, значение которой задается пользователем. Имеется возможность выводить вилы Эндрюса и фибо-уровни (стандартные или Бобокус). НЕ ПЕРЕРИСОВЫВАЕТСЯ.
Параметры Period МА — период средней линии. По умолчанию — 34. Минимальное значение — 4. Максимальное — по Вашему усмотрению. Used to calculate price - указание нужной ценовой базы расчетов средней линии. The averaging me

(Перевод с Google)
смысл Панель инструментов должна помочь получить быстрый обзор корреляций различных базовых факторов друг с другом. Для этого серии значений сравниваются по методу Пирсона. Результатом является значение корреляции (в процентах).
использование Существуют разные методы корреляции. В так называемой керри-торговле базовый актив покупается. Пара с сильной отрицательной корреляцией продается. Соответствующие свопы играют важную роль в этом методе. Другой метод заключается в хедж

После 7 лет я решил выпустить некоторые свои индикаторы и советники бесплатно.
Если вы находите их полезными, пожалуйста, поддержите меня пятизвёздочным рейтингом! Ваш отзыв помогает продолжать выпуск бесплатных инструментов! Также смотрите мои другие бесплатные инструменты здесь
_________________________________ Индикатор Среднего Объёма Движения (Volume MA) для Продвинутого Анализа Рынка Форекс Представляем индикатор Среднего Объёма Движения (Volume MA), разработанный с особы
FREE

Indicator : Forex Reversal Trend The indicator helps investors to identify the earliest and perfect reversal point. Easy to make decision to trade with the trend Price action trading. support resistance and market trends. By technical analysis, the robot creates a short-term strategy to determine the most optimal entry position. Version PRO: https://www.mql5.com/en/market/product/70867 Telegram: https://t.me/tForexSniper
FREE

Индикатор работает как расширение, перекрашивает свечи и фон в терминале по одному нажатию кнопки (Ночная тема /дневная тема). Пользователь может также задать отображение водяного знака символа, и указать его размер. Интерактивное меню позволяет переключать отображение значение Ask. И переключать масштабирование графика с адаптивного на фиксированный одним нажатием. Можно добавить в настройки вашу любимую цветовую схему для переключения.
FREE

This is Fibo Expansion. You can use it, as profit target at any level... It use price Highs and Lows and price between... It is simple and easy to use... No Input menu, just drag it on your chart and it ready to use... The blue and red dot color indicate it direction... It also use as the same as fractal high and low price as the points to construct the levels... No more analysis to choose the points..
FREE

Check out other great products from https://www.mql5.com/en/users/augustinekamatu/seller
This indicator is the best so far at determining the currency strength of each pair. It provides stable values and is highly adaptive to market changes. It is a great tool to add to your arsenal to make sure you are on the right side of the trend at all times. No inputs required, it is simple plug and play. A Winning Trading Strategy This article describes the components and logic needed to develop a tr
FREE

Целью этой новой версии стандартного MT4 индикатора, входящего в поставку платформы, является отображение в подокне нескольких таймфреймах одного и того же индикатора. См. пример, приведенный на рисунке ниже. Однако индикатор отражается не как простой индикатор MTF. Это реальное отображение индикатора на его таймфрейме. Доступные настройки в индикаторе FFx: Выбор таймфрейма для отображения (от M1 до MN) Установка ширины (количество баров) для каждого окна таймфрейма Всплывающее оповещение/звуков
FREE
This Dashboard is free to download but is dependent on you owning the Flag Trend Pro MT4 indicator. Down load the indicator: Flag Trend Pro
The Dashboard will show you on a single chart all the timeframes (M1 to Monthly) with their own status for the indicator: Gold Pro MT4
all time frame and all symbol: smart algorithm detects the trend, filters out market noise and gives entry signals!!!
How to understand the status: symbol - Fill All the Pair what you want. M1, M5, M1
FREE

Скользящая средняя Алана Хала, более чувствительная к текущей ценовой активности, чем обычная MA. Быстрее реагирует на изменение тренда, четче показывает движение цены. При смене цвета индикатора присылает push-уведомления на мобильный телефон, по электронной почте и выводит сообщение на экран.
Параметры Period - период сглаживания, рекомендуемые значения от 9 до 64. Чем больше период, тем мягче индикатор. Method - метод сглаживания, может принимать значения от 0 до 3. Label - текстовая метка,

SF TREND SIGNAL - уникальный индикатор использующий несколько входных данных для определения тенденции, и сигнала для входа в сделку, в ее направлении. Подходит для любой валютной пары, любого таймфрейма, и не меняет свои показания. Индикатор очень прост в настройке, что является хорошим преимуществом для исследований.
Параметры индикатора Основные настройки ( Main Settings ): SlowPeriod - период для расчета тенденции. FastPeriod - период для расчета сигнала. SlowSmooth - сглаживание значен

Небольшой бесплатный индикатор для определения определенных графических паттернов, плечо/голова плечо/разворот, тройная вершина/дно, чашка, флаги и другие... Я разработал его некоторое время назад, он обнаруживает числа в m1, m5, m15, m30 и h1.
Я надеюсь, что это будет полезно для вас, потому что я мало торгую с этим индикатором, у меня есть несколько других, которые я постараюсь быстро разместить в сети, возможно, вы найдете их полезными, хорошие друзья по торговле.
FREE

Harami is a two candle pattern with recent candle formed inside the previous candle's high and low . It represents indecision in the market and is used for breakout price action trading strategy. This indi fires all signals to a dashboard on the chart including pop_up alert, push to phone notification and email. Harami has two types, bullish and bearish pattern. Enter long for bullish Harami and enter short for bearish Harami. Inputs : Currency Symbols: EURUSD,GBPJPY,USDJPY,USDCAD (default) , u
FREE

(Перевод с Google)
смысл Индикатор SuPrEs указывает расстояние до следующей горизонтальной линии, имя которой начинается с настроенного префикса (см. Параметры).
использование Нарисуйте сопротивления и опоры на графике и позвольте индикатору предупредить вас, как только настроенное расстояние окажется ниже. Используйте префикс для предоставления линий сигнализации для других линий, а также для стандартных линий (см. Скриншот с индикатором поворота).
Отображение индикатора Индикатор отображ
FREE

Ska ZigZag Line indicator determines the overbought and oversold regions within a trend. The indicator determines the overbought region by the candlestick high and the oversold region by the candlestick low in a form of a line. To utilize the full strategy i recommend using "Ska ZigZag Line" together with "Ska ZigZag BuySell". NOTE: This indicator is a line based indicator. HOW TO USE: Sell Signal; Place a sell trade when the Ska ZigZag BuySell indicator arrow appear on top of the Ska ZigZag Lin
FREE
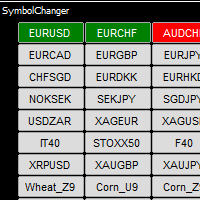
Symbol Chart Changer is an indicator/utility that offers you the option to switch between symbols and timeframes. You can choose any symbol and timeframe on the same chart with just a few clicks. In addition, this indicator also shows the profit of the symbol through the color of the buttons. For MT5: Symbol Chart Changer for MT5 Features
All symbols selected in MarketWatch, that allow you to monitor your favorite instruments on the same chart. Works smoothly on any symbol/instrument, accou
FREE

Вы уже устали от постоянных взлетов и падений? Не стоит становится жертвой неустойчивых движений рынка … Пора уже как-то от этого избавиться! Уже сейчас вы можете воспользоваться умными решениями Impulse Pro, чтобы сбалансировать фильтры и получить точную статистику.
В трейдинге время решает все
Если вы хотите узнать больше, посетите www.mql5.com/en/blogs/post/718212 Выполните три простых шага, и вы сможете прогнозировать неожиданные движения на рынке!
Преимущества
Быстрый алгоритм опред
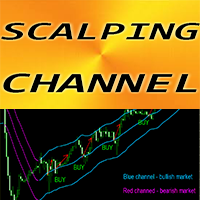
Forex Indicator "Scalping Channel" for MT4 Scalping Channel has ATR-based volatility borders Great to use for scalping trading: Enter in trades via arrangement pending limit order on middle line Consider Bullish entries when green steady upward channel takes place and at least 1 candle was closed above top border (see pictures) C onsider Bearish entries when red steady downward channel takes place and at least 1 candle was closed below bottom border (see pictures) // More great Expert Advisors

This indicator is based on Mr. Mark Fisher's ACD strategy, based on the book "The Logical Trader."
- OR lines - A lines - C lines - Daily pivot range - N days pivot range - Customizable trading session - Drawing OR with the desired time Drawing levels A and C based on daily ATR or constant number - Possibility to display daily and last day pivots in color zone - Displaying the status of daily PMAs (layer 4) in the corner of the chart - Show the order of daily pivot placement with multi-day
FREE

Having trouble marking where the various forex sessions start and end? Or perhaps your strategy requires you trade only in a specific session, then this is for you.
The session indicator shades the session you require in a certain color so that you can identify it easily. The sessions shown include: London session, New York session, Asian Session, Asian - London overlap and London - New York Overlap.
Difference source give varying time ranges for the various session, mostly differing by not
FREE

MTF Heiken Ashi MA - мультитаймфреймовый индикатор Heiken Ashi и скользящей средней. Полностью настраиваемый индикатор для продвинутых и уникальных расчетов Heiken AshiHeiken Ashi и скользящей средней (HA-Bodies).
Основные возможности Три значения баров на истории - закрытия, максимума и минимума. Мультитаймфреймовый характер; особенно полезно для свинговых стратегий. Не перерисовывается; хороший инструмент для скальперских стратегий.
Входные параметры Timeframe = PERIOD_CURRENT - таймфрейм
FREE

Индикатор Practitioner основан на уникальном алгоритме анализа поведения цены и представляет результат этой сложной работы в виде линий. Один из преимуществ этого индикатора заключается в том, что он автоматически изменяет цвет линии в соответствии с текущим направлением движения цены.
Важно отметить, что в индикаторе есть параметр для включения алертов при изменении цвета линии. Это дает трейдеру возможность оперативно реагировать на изменения и определять новые тренды на рынке.
Используя
This is a Indicator that Alert if price closed above/below/touched the line.
Features/Settings: Timeframe supported: 1m, 5m 15m, 30m, 1H, 4H, 1D, 1WK, 1Mo Works on all currency pairs.
Candle Size in Pips: Alert based on Candle Full length or Candle Body Select Line style/width/color Alert type: Popup, Send to Mobile MT4, Email Input notes on alert Add multiple line alerts in a single chart Refer to screenshot:
1 - Time Frame 2 - Long/Short Position 3 - Get the highest open/closed price
---> Check all the other products <---
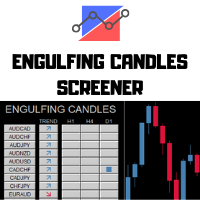
The Engulfing Candles Screener is a deeply customizable dashboard.
You can chose a trend filter, using 2 EMAs, with custom periods applied on a custom TimeFrames Then you can choose 3 timeframes to search, any TimeFrame is suitable and the screener will find the engulfing candles in the selected timeframe. 3 Timeframes to scan All the major forex pairs and crosses - up to 28 symbols Deeply Customizable
How to setup the screener:
Let the crosses v

Channel Vertex is a price action pattern formed by price Chanel and a triangle pattern . Price channels basically indicates possible support and resistance zones around a price movement and retracement or breakout at these levels can indicate possible trend continuation or reversal .
Majority of the times price fluctuations forms triangle patterns defined by 3 vertexes , these triangle patterns most times defines a trend continuation. A triangle pattern is a trend continuation pattern tha

Contact us for any custom order, CodeYourTrade.com .
The MACD Histogram measures the distance between the MACD line and the MACD signal line. Two important terms are derived from the MACD histogram are: · Convergence : The MACD histogram is shrinking in height. This occurs because there is a change in direction or a slowdown in the trend. When that occurs, the MACD line is getting closer to the MACD signal line. · Divergence : The MACD histogram is increasing in height (eit
Индикатор Average Daily Range показывает динамические уровни среднего диапазона пипсов для пары, рассчитанные на основе дневных максимумов и минимумов за определенный период. ADR можно использовать для визуализации потенциального ценового действия за пределами среднего дневного движения. Значение ADR выше среднего указывает на дневную волатильность выше обычной. ADR можно использовать при установке целевых уровней позиций. Если индикатор ADR показывает, что средний дневной диапазон пары 80 пипс

Преимущества Индикатор отображает продолжительность текущих активных сделок (включая отложенные ордера) в минутах, секундах и часах . Продолжительность означает то, как долго ордер активен на рынке, как долго работает ордер. Индикатор показывает размер торгового лота, символ инструмента, порядковый номер сделки в хронологическом порядке . Индикатор обновляет свои данные на графике в зависимости от активности ордера.
Входные параметры Indicator Chart Corner = расположение индикатора на график
FREE

Forex Indicator "MACD with Trend ZigZag" for MT4 MACD indicator itself is one of the most popular tool for trend trading "MACD with Trend ZigZag" is excellent for using with Price Action entries or in combination with other indicators Use this indicator to select most accurate entry signals: - If MACD is above 0 (green color) and ZigZag line is upward - search only for Buy Price Action patterns - If MACD is below 0 (pink color) and ZigZag line is downward - search only for Sell Price Action
Идет подготовка EA версии. Можете отправить личное сообщение "оповестите о EA версии". EA будет универсален с множеством настроек для торговли по различным индикаторам.
Новый EA позволит так же торговать по данному индикатору.
К примеру разрешая сигналы после Х сигналов/баров до Х сигналов/баров в одном направлении, до смены направления.
Если Break Out произошёл до/после сигнала другого индикатора.
Набирать прибыль на каждом следующем сигнале выше/ниже предыдущего. Отправьте личное
FREE
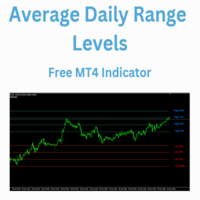
The Average Daily Range Levels indicator shows the ADR levels on the chart as if they were supports and resistances and is updated daily.
By default the indicator uses the 5-day average of the daily range. There are several strategies that suggest that these levels can be used to determine where the price can bounce and it is often said that the price can typically move 75% of the ADR.
In future versions I may add alerts at each level
Can you suggest any changes?
Greetings!
FREE

Данный индикатор является интерпретацией показаний классического индикатора - RSI. Для сглаживания резких колебаний значений индикатора применяется фильтр отсекающий слабые изменения и акцентирующий внимание трейдера на сильных колебаниях значений. Индикатор не перерисовывается на сформированных барах. Для большей эффективности данного индикатора его следует использовать совместно с индикаторами, идентифицирующим направление тренда, а также уровни поддержки/сопротивления. Сигналы: Пересечение ги
FREE

Cross Trend Lines indicator trend indicator of find. This indicator, an array of works by using a series of indicator and algorithm. Uses two lines to find trends. The intersection of this line means that the start of the trend. These lines are green, tend to rise. Red lines indicate the downward trend. Use of this indicator is easy to understand. This indicator on its own or you can use other indicators that are appropriate for the strategy.
Suggestions and Features Starts a new trend at th
FREE

Intraday Setup Indicator uses Bollinger Bands as a main indicator to find a good setup filtered with candle stick pattern such as engulfing and pin bar. This is great tool for those who trade with Bollinger bands for entry or use it as a filter for trend. It is suggested to use a higher time frame when using this tool. There are many input setting for user to conveniently find a good probability setup.
FREE

Индикатор, обладающий повышенной информативностью, благодаря уровням перекупленности и перепроданности для более точного отображения ситуации на рынке. Полностью доступны все настройки скользящих средних, такие как тип средней и цены, по которым она строится. Также имеется возможность изменить вид отображения индикатора - линия или гистограмма. Благодаря дополнительным параметрам появилась возможность более тонкой настройки, а торговля может вестись как внутри канала, так и по тренду.
Отличите

Этот индикатор изучает ценовое действие как совокупность ценовых и временных векторов, и использует средний вектор для определения направления и силы рынка. Этот индикатор выделяет краткосрочную направленность и силу рынка, он может быть использован для получения выгоды от краткосрочных колебаний цен при помощи торговли по пробоям или бинарных опционов.
С легкостью находит направление рынка Подтверждается пробоями или другими индикаторами Красный осциллятор означает медвежье движение Синий осц
FREE
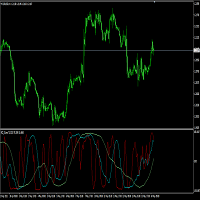
RCI is one of the technical charts and is an abbreviation that stands for "Rank Correlation Index". It is an index to judge overbought or oversold based on how much the latest stock price has risen or fallen. RCI ranks dates and prices over a period of time and indexes the correlation between -100% and + 100%. For example, if the calculation period is 9, it will be + 100% if the price continues to rise for 9, and -100% if the price continues to fall for 9. Generally, it is judged that it is over
FREE

Индикатор WindFlow HTF хорошо использовать в сочетании с другим моим индикатором WindFlow. Индикатор дает общее представление о тренде на более крупном таймфрейме. В сочетании с индикатором WindFlow представляет собой почти полное торговое решение. Необходим лишь анализ уровней поддержки/сопротивления и немного внимания.
"Танец ветра" Крупные и мелкие таймфреймы взаимосвязаны. Мы знаем, что сигналы на крупных таймфреймах обычно запаздывают по сравнению с сигналами на более мелких. Однако если
FREE

Информационная панель, которая выставляет уровни покупки продажи и цели для профита на текущий день. Уровни рисуются согласно движению валюты за вчерашний день. Панель вмещает в себя информацию о валютной паре, тенденции на рынке, время до закрытия бара, управление капиталом, рекомендуемый лот, профит в пунктах, а также уровни для покупки и продажи инструмента. Для заключения сделок использовать только отложенные ордера на пробой. Входные параметры Lots - установить текущий лот Risk - риск в про
FREE
Индикатор Daily Average Retracement Dashboard позволяет одновременно отслеживать несколько валютных пар. Этот индикатор предназначен в основном для стратегий, торгующих по ценовым коррекциям на основе уровней сопротивления 3/4 и уровней поддержки 3/4. После установки индикатора на график, он скроет график и отобразит валютные пары в виде таблицы. В таблице показано несколько полей с данными, которые помогут трейдеру узнать, когда анализировать валюту и торговать на откатах. Индикатор показывает
FREE

The "MACD Trend Follower" is an indicator based on the MACD oscillator. It serves to spot the trend direction by giving it a fixed color until the trend changes (the trend direction colors are customizable). The default MACD settings for the indicator has been changed to adapt to the fast moving Forex market, but they can be changed to suit the trader.
Recommended settings for the indicator : - MACD Fast EMA : 8 Periods. - MACD Slow EMA : 13 Periods. - MACD SMA : 5 Periods.
Indicator inputs
FREE
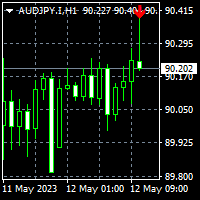
To get access to MT5 version please click here . This is the exact conversion from TradingView: "Hammer & ShootingStar Candle Detector" by "MoriFX". This is a light-load processing and non-repaint indicator. All input options are available. Buffers are available for processing in EAs. You can message in private chat for further changes you need. Thanks.
FREE

RaysFX StochRSI Presentiamo un indicatore MQL4 sviluppato da RaysFX, un rinomato sviluppatore nel campo del trading algoritmico. Questo indicatore è una combinazione semplice ma potente di due indicatori popolari: RSI e Stocastico. Caratteristiche principali: RSI : Un indicatore di momentum che misura la velocità e il cambiamento dei movimenti dei prezzi. Stocastico : Un indicatore di momentum che confronta il prezzo di chiusura di un titolo con la gamma dei suoi prezzi durante un certo periodo
FREE

A visual multitimeframe indicator designed for both beginners and professionals. Developed using MACD, CCI and Laguerre and the principle of three screen. This original indicator will help you: accurately enter the market; reduce the number of errors when opeinng orders; visually see market movement; predict price movement(in absent of significant news); do not rush to close profitable trades prematurely and increase profit; do not rush to enter the market and wait for "easy prey". The
FREE

The Buyside & Sellside Liquidity indicator aims to detect & highlight the first and arguably most important concept within the ICT trading methodology, Liquidity levels. SETTINGS
Liquidity Levels
Detection Length: Lookback period
Margin: Sets margin/sensitivity for a liquidity level detection
Liquidity Zones
Buyside Liquidity Zones: Enables display of the buyside liquidity zones.
Margin: Sets margin/sensitivity for the liquidity zone boundaries.
Color: Color option

Этот код был первоначально опубликован на LuxAlgo с другого языка программирования.
Он обладает приемлемыми возможностями прогнозирования тренда, которые могут быть использованы для многих торговых целей. вот некоторое описание от генератора кода:
Этот индикатор основан на ранее опубликованных сглаживателях Надарая-Уотсона. Здесь мы создали индикатор конвертов на основе Kernel Smoothing с интегрированными предупреждениями от пересечений между экстремумами цены и конверта. В отличие от оцен

Whether you are a scalper or daily trader, you will always look for bullish / bearish engulfing candles. This can be a bit tricky and stressful when you try to visually identify the engulfing candles on the chart. Not only that, you might be trading on the M15 time frame but the engulfing candle is forming or has already formed in the H4 time frame. This indicator is made to do that on your behalf. You can trade on any time frame and see Engulfing candles of another time frame, this means that y
FREE

The MT4 Channel Standard Deviation Indicator automatically plots support and resistance channels on the price chart using price standard deviation. It indicates BULLISH and BEARISH market conditions and is suitable for both new and advanced forex traders.
This indicator offers support, resistance, entry, and exit levels, along with stop-loss and take-profit points. It accurately identifies BULLISH and BEARISH market trends, making it effective for both intraday and long-term trading across va

Product detailed post: https://www.mql5.com/en/blogs/post/756962
Get free demo from the link in above post.
Features: - Multi Heiken Parameters
- Alerts & Highlights for Heiken Switch
- Heiken Alignment Alerts
- Multi-timeframe Alignment Alerts
- Multi Currency
Heiken Explained: Heiken Settings: All comma separated lists will be used for different heiken ashi's. Example: 5,40,188 will mean that MAPeriod1 in 1st heiken will be 5; In 2nd heiken will be 40 and in 3rd heiken ashi will be 1

Multi Divergence Indicator for MT4 - User Guide Introduction Overview of the Multi Divergence Indicator and its capabilities in identifying divergences across multiple indicators. Importance of divergence detection in enhancing trading strategies and decision-making. List of Indicators RSI CCI MACD STOCHASTIC AWSOME MFI ACCELERATOR OSMA MOMENTUM WPR( Williams %R) RVI Indicator Features Indicator Selection: How to enable/disable specific indicators (RSI, CCI, MACD, etc.) for divergence detection.
FREE

Индикатор для визуализации временных диапазонов ключевых торговых сессий: Азиатской, Европейской и Американской. Индикатор обладает функционалом настройки времени начала и окончания каждой торговой сессии, а также устанавливаемой временной зоны торгового сервера. Основные преимущества индикатора включают возможность работы с минимальной загрузкой процессора и экономии оперативной памяти. Кроме того, предоставляется опция указания количества отображаемых исторических дней, обеспечивая пользоват
FREE
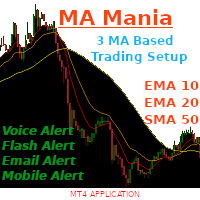
The Indicator includes three of the most prominent moving averages indicators. These are : Ten Period Exponential Moving Average Twenty Period Exponential Moving Average Fifty Period Simple Moving Average This is one of my favourite trend follow setup that is solely based on these three moving averages. The indicator has the following abilities: It can notify you through voice alerts when price touches any of the moving averages . For example if price touches Fifty Period Simple Moving Average t

Indicator SR levels true in small time frames is very useful for scalping while in bigger ones it is good for day or position trading.
SR levels true can draw 4 support/resistance levels based on defined maximum rebouds from price level. Indicator scans defined number of bars in time axis and defined number of pips in price axis (both sides - up and down) and calculates how much times price was rejected from scanned price levels. At the price levels where maximum rebounds are counted, support
FREE

TREND MATE is an useful indicator that will support your decision to trade according to the current trend. It is possible to configure alert and push notification to receive when entering to first candle for bull / bear trend. If you want to use this indicator for a EA, use the function iCustom as follows:
DOWNTREND : iCustom(NULL,0,"Trend_Mate",0,0) . If downtrend result is "1", otherwise is "0".
UPTREND : iCustom(NULL,0,"Trend_Mate",1,0) . If uptrend result is "1", otherwise is "0".
Fo
FREE

Trend Power Indicator - это индикатор, который помогает определить направление тренда и его силу, используя модель зигзага, скользящих средних и корреляции торгуемых инструментов. Он предоставляет данные о силе трендов в удобным интерфейсе, который можно легко и быстро прочитать. Этот индикатор по умолчанию настроен для торговли стратегий от Adam Khoo ( Piranhaprofit ). Индикатор экономит массу времени на поиск торгуемых пар по его стратегиям. Индикатор указывает, когда все необходимые скольз

Индикатор "Buy Sell zones x2" основан на принципе "остановка/разворот после сильного движения". Поэтому, как только обнаруживается сильное безоткатное движение, сразу после остановки - рисуется зона покупок/продаж. Зоны отрабатывают красиво. Или цена ретестит зону и улетает в космос, или пробивает зону насквозь и зона отрабатывается с другой стороны так же красиво. Работает на всех таймфреймах.
Лучше всего выглядит и отрабатывает на Н1.
Может использоваться как: индикатор зон, где лучше
FREE
А знаете ли вы, почему MetaTrader Market - лучшее место для продажи торговых стратегий и технических индикаторов? Разработчику у нас не нужно тратить время и силы на рекламу, защиту программ и расчеты с покупателями. Всё это уже сделано.
Вы упускаете торговые возможности:
- Бесплатные приложения для трейдинга
- 8 000+ сигналов для копирования
- Экономические новости для анализа финансовых рынков
Регистрация
Вход
Если у вас нет учетной записи, зарегистрируйтесь
Для авторизации и пользования сайтом MQL5.com необходимо разрешить использование файлов Сookie.
Пожалуйста, включите в вашем браузере данную настройку, иначе вы не сможете авторизоваться.