Смотри обучающее видео по маркету на YouTube
Как купить торгового робота или индикатор
Запусти робота на
виртуальном хостинге
виртуальном хостинге
Протестируй индикатор/робота перед покупкой
Хочешь зарабатывать в Маркете?
Как подать продукт, чтобы его покупали
Технические индикаторы для MetaTrader 4 - 20

Volatility Limit Trend Indicator (VLT), an original indicator by this developer, is a trend indicator based on setting a fixed volatility limit as a percentage of price. Volatile price is allowed to wander between two channel lines defining the fixed volatility about a central line. The price crossing one of the channel lines defines an exceeding of the allowed volatility, and ushering in one of two situation : either a continuation or a reversal of trend. The first buffer of the indicator (not
FREE

The "Dagangduit Spread Indicator" is a versatile tool designed to provide traders with essential information about the current spread in the chart window. This indicator offers customizable features, including font parameters, display location on the chart, spread normalization, and alerts to enhance your trading experience. Key Features: Real-time Spread Display : The indicator displays the current spread in real-time on your trading chart, allowing you to stay informed about the cost of execut
FREE

MT5 версия | Индикатор Valable ZigZag | FAQ Волновая теория Эллиотта – это интерпретация процессов на финансовых рынках, которая опирается на визуальную модель волн на графиках цены. Согласно этой теории, мы точно можем знать какая тенденция преобладает сейчас на рынке, восходящая или нисходящая. Индикатор Valable ZigZag отображает волновую структуру рынка , а также говорит о направлении основного тренда в данный момент на текущем таймфрейме. Индикатор Trend Monitor VZ для в

The indicator is a 15-minute signal indicator for all types of traders. Meaning, you could make lots of profits trading two different signals in one indicator.
NOTE: Both indicators are channels for achieving the same result. RED ARROW -- Sell Signal BLUE ARROW -- Buy Signal
Purchase now to be part of our community. We offer standard chart setups for both novice and intermediate traders. Trade with ease!
FREE
Thomas DeMark Relative Retracement uses an objective and consistent approach to Fibonacci Trading by establishing a minimum of three reference points which may provide support or resistance in the market. A great tool for anticipating continued price trends and/or price exhaustions!
Bullish levels are calculated once a potential price low has occurred. This low is compared to previous price action to locate an earlier price low which is equal or lower than the current low. The intervening high
FREE

Features: Find these engulfing patterns: Simple Engulf Stick Sandwich Engulf Three Line Strike Rising Three Morning Star Doji Scanner is useful to make your strategy better. Don't always go by Win/Loss percentage. Because this tool is not based on past results. Basic Settings: For All Patterns You can set: First:Last Candle Ratio This will make sure that the earlier opposite candle is at least this given ratio in height as compared to the engulfing candle. This is not checked for Three Line Stri
FREE

Целью этой новой версии стандартного MT4 индикатора, входящего в поставку платформы, является отображение в подокне нескольких таймфреймах одного и того же индикатора. См. пример, приведенный на рисунке ниже. Однако индикатор отражается не как простой индикатор MTF. Это реальное отображение индикатора на его таймфрейме. Доступные настройки в индикаторе FFx: Выбор таймфрейма для отображения (от M1 до MN) Установка ширины (количество баров) для каждого окна таймфрейма Всплывающее оповещение/звуков
FREE
Easily track and trade with the trend using this indicator. Uses a circle and line to indicate the trend direction. Excellent for channels. Features alert function.
Parameter TrendPeriod can be changed to your preference. How to use: Simply attach to any chart. Blue circle plus blue line cross below price = Buy. Red circle plus red line cross above price = Sell. Best results when taking higher time frames into consideration before entering a trade. (Hint: Wait for the radar/circle to appear on
FREE

1000% non-repaint high accuracy signal technical indicator. Solar wind Predator work on all pairs with high and low volatility Solar wind Predator work from the 1 minute timeframe to the Monthly timeframe Swing trading H1 to W1 Scalping M1 to M30 Blue arrows above the zero line look for buying(bullish) opportunities. Orange arrows below zero line look for selling(bearish) opportunities.

MACD (short for Moving Average Convergence/Divergence) is one of the most famous and oldest indicators ever created and is widely used among beginners . However, there is a newer version of the MACD that is named Impulse MACD which have less false signals than the standard MACD. Classic MACD helps us to identify potential trends by displaying crossovers between two lines. If MACD line crosses above the Signal line it shows us that the market is potentially up trending and that it would be a go

*This is tradingview indicator converted to mql4*
The Chandelier Exit Indicator is a popular technical analysis tool developed by Chuck LeBeau. It is designed to help traders identify potential exit points for their trades based on market volatility and the concept of trailing stops. The Chandelier Exit Indicator consists of three main components: Average True Range (ATR): The indicator utilizes the Average True Range, which measures market volatility. The ATR calculates the average range bet
FREE

Broken Trends - индикатор для скальперов и интрадейщиков. В режиме реального времени он подбирает и показывает на графике трендовые линии. Индикатор реагирует на импульсы цены: поиски трендов начинаются как только амплитуда импульса превысит порог, задаваемый специальным параметром. Также индикатор может подавать звуковые сигналы при пересечении ценой актуальной трендовой линии. В обычном режиме индикатор показывает только по одному (последнему найденному) восходящему и нисходящему тренду, но им
FREE

Индикатор относится к средствам вероятностного анализа. Прогнозирование выполняется методом Монте Карло совместно с математической моделью нейрона. Но, моделирование образцов для метода производится не искусственно, а поставляется из оригинальной "натуры", то есть из истории. Количество образцов и детальность их моделирования достигается использованием младшего (относительного текущего) таймфрейма.
Алгоритм работы индикатора :
В общих чертах алгоритм сводится к тому, что индикатор обучает

Данный сканер показывает значения тренда известного индикатора SuperTrend для множества инструментов (до 30) и 8 таймфреймов. Уведомляет о смене направления тренда в терминале MetaTrader 4, по email и push-уведомлением. Это бесплатная версия индикатора SuperTrend Scanner Бесплатная версия работает только на EURUSD и GBPUSD!
Важная информация Для максимального использования потенциала сканера прочитайте полное описание (на английском языке): www.mql5.com/en/blogs/post/718074
Бесплатная версия
FREE

Check my p a id tools they work perfect please r ate Adjustable PIN BAR indicator is usefull tool alowing to search for pin bars you wish to find on the price chart, it has 2 parameters to filter out what type of pin bars you wish to search for: 1) MinTailProc 75% (default) which means to show pin bars that has minimum size of the Nose (Tail) as 75% of full candle size. If Upper Nose (Tail) size of the candle is minimum 75% of the candle size fully than candle is painted in RED. If Lower Nose
FREE

Super Channels indicator is a channel indicator created by calculating support and resistance levels. It calculates by taking the average of support and resistance levels. After determining the number of candles, it takes the levels of the number of candles and creates an autonomous channel according to these levels. If you want to calculate how many candles, you must enter the number in the parameter section. Also, there are two types of modes in the indicator. The first is to calculate based o
FREE
Анализатор волатильности — это индикатор импульса, который извлекает выгоду из тенденции к сильному прорыву цены после консолидации в узком торговом диапазоне. Индикатор также использует осциллятор импульса, чтобы показать ожидаемое направление движения, когда происходит сжатие. Эта гистограмма колеблется вокруг нулевой линии, увеличение импульса выше нулевой линии указывает на возможность покупки длинной позиции, а падение импульса ниже нулевой линии может указывать на возможность продажи.

Introduction and Description
The indicator displays an arrow whenever a " Bearish Engulfing " is detected. The latter usually indicates the beginning of a downward trend. A bearish engulfing pattern is a technical chart pattern that signals lower prices to come. The pattern consists of an up candlestick followed by a large down candlestick that eclipses or "engulfs" the smaller up candle. The pattern can be important because it shows sellers have overtaken the buyers and are pushing the price m
FREE
Индикатор параллельно анализирует ценовые графики нескольких валютных пар на всех таймфреймах и отправляет уведомление, как только обнаруживаются паттерны "Двойная вершина" и "Двойное дно". "Двойная вершина" (Double Top) — паттерн разворота тренда, который состоит из двух последовательных пиков, примерно равных друг другу, и впадины между ними. Этот паттерн — яркая иллюстрация борьбы покупателей с продавцами. Покупатели пытаются усилить свои позиции, но встречаются с сопротивлением, что препятст

BeST_Gann Swing Oscillator is an MT4 indicator that is based on the corresponding work of Robert Krausz who introduced it in the book “ A.W.D Gann Treasure Discovered ” .
The Gann Swing Oscillator is a range-bounding technical indicator that oscillates between +1 and -1 and thus it describes the market swings.
Generally when the market is in an upswing, the Gann Swing Oscillator describes it as 2 higher highs with the value of +1 while after an upswing, the downswing is expected.
Also the do
Индикатор показывает время формирования текущего бара в процентом соотношении.
Настройки индикатора color_back1 - цвет фона 1 color_flat1 - цвет границы для фона 1 color_back2 - цвет фона 2 Alert_Percent - значение процента для подачи звукового сигнала Sound_file - наименование звукового файла, пользовательский звуковой файл должен находиться в терминальной папке в под папке Sound и иметь расширение - .wav
FREE

You've probably heard about the Dow trend Theory, where higher highs and lows indicate an uptrend, and lower highs and lows indicate a downtrend. This indicator determines this trend based on the Dow Theory. You just need to enter a number representing the number of candles between extremes. The optimal solution is the number 3, unless you want to have the trend from M5 but you're on M1, then you need to multiply this number by 5. Check various combinations to trade with the trend. In the scree
FREE
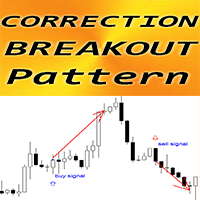
Forex Indicator " Correction Breakout pattern" for MT4 Indicator " Correction Breakout pattern " is very powerful indicator for Price Action trading : No repaint, No delays; Indicator detects bullish and bearish Breakout bars after the price correction : Bullish Correction Breakout pattern - Blue arrow signal on chart (see pictures) Bearish Correction Breakout pattern - Red arrow signal on chart (see pictures) with P C, Mobile & Email alerts Indicator " Correction Breakout patter

MASi Three Screens основан на торговой стратегии Доктора Александра Элдера. Данный индикатор является сборником алгоритмов. Алгоритмы основаны на анализе графиков нескольких таймфреймов. Вы можете применить любой из предоставленных.
Список версий алгоритмов ThreeScreens v1.0 - Простая реализация, с анализом MACD линии; ThreeScreens v1.1 - Простая реализация, с анализом MACD гистограммы; ThreeScreens v1.2 - Совмещение двух первых алгоритмов в одной версии; ThreeScreens v1.2.1 - В алгоритм внедр
FREE

Индикатор показывает последние нетронутые уровни поддержки и сопротивления в виде горизонтальных линий. Индикатор может показывать уровни поддержки/сопротивления с более высоких таймфреймов. С помощью данного индикатора вы легко можете увидеть уровни поддержки/сопротивления с таймфреймов H4, D1 и W1 на графике H1, что может быть большим преимуществом при поиске возможностей входа на H1. Это полная версия индикатора: Support Resistance Multi Time Frame FREE
Параметры referenceTF: таймфрейм для

Big summer sale. Save up to 40% on my products. Supply & Demand dashboard - save 10$! The Netsrac Supply&Demand Dashboard shows you at a glance where relevant zones are located on your favorite assets. Open your chart directly from the dashboard and trade zones that really matter. Features
Finds the next relevant supply and demand zone and displays the distance to this zone (in pips) Finds and displays the zones in three different timeframes Calculates a trend indicator for the current and past

Scalper Zoom - новая торговая система которая создана для того, чтобы упростить процесс торговли на рынке форекс как новичкам, так и профессионалам. Индикатор Scalper Zoom использует адаптационный метод работы и анализирует рынок с помощью нескольких торговых алгоритмов, выбирая при этом максимально эффективный для данной валютной пары и данного таймфрейма. Работать с данный индикатором очень просто. При появлении красной вертикальной линии, открываем ордер на продажу. Закрываем его при появлени

Leo Trend - это сигнальный индикатор, который показывает на графике в виде стрелок и линий моменты входа в рынок, а так же направление тренда и флета. Leo Trend будет полезен как новичкам создающим торговую стратегию, так и профессионалам для интеграции в уже готовые торговые системы. Leo Trend работает без перерисовок и без существенных опозданий. Как работает индикатор мы продемонстрировали на видео. Кроме того, Вы можете протестировать данный индикатор в тестере стратегий абсолютно бесплатно.

A trend indicator showing the strength of bulls and bears in a trading range.
Consists of two lines:
The green line is a balanced overbought/oversold condition. The red line is the direction of trading activity. Does not redraw calculations.
Can be used on all Symbols/Instruments/Time Frames.
Easy to use and set up.
How to use the indicator and what it determines.
The basic rule is to follow the direction of the red line:
if it crosses the green line from the bottom up, the market i
FREE

14 Indicators and auxiliary tools for convenient trading This utility contains 14 additional tools that can be useful for certain actions of the trader, thereby simplifying and speeding up the trading process. My #1 Utility : includes 65+ functions | Contact me if you have any questions Due to the different monitor resolutions, some users may encounter the fact that the labels will be displayed with an overlay or be too small. If you encounter such a problem, you can adjust the font size
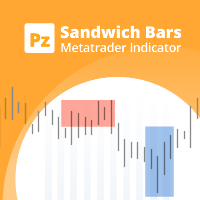
Данный индикатор определяет паттерны Sandwich Bars по нескольким диапазонам, весьма надежные паттерны пробоя. Просто и эффективен в использовании Настраиваемые диапазоны баров Настраиваемый выбор цвета В индикаторе предусмотрены визуальные/почтовые/push/звуковые уведомления. Индикатор не перерисовывается и не рисует на истории Паттерн Sandwich состоит из одного бара, поглощающего несколько прошедших баров, пробивая и отклоняя весь ценовой диапазон. Синяя рамка - бычий пробой Красная рамка - медв
FREE
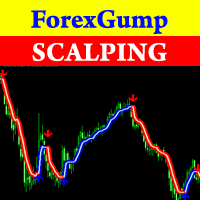
Внимание! Друзья, так как в интернете последнее время появилось много мошенников которые продают индикаторы под названием ForexGump, мы решили Вас предупредить, что только у нас на странице продается ЛИЦЕНЗИОННАЯ АВТОРСКАЯ ВЕРСИЯ ИНДИКАТОРА! Мы не продаем данный индикатор на других сайтах по цене ниже этой! Все индикаторы которые продаются дешевле - подделки! А еще чаще продаются демо версии которые через неделю прекращают работать! По этому, чтобы не рисковать своими деньгами, покупайте данный

Индикатор отображает гармонические модели на графике, основанном на Динамическом ЗигЗаге ( https://www.mql5.com/ru/market/product/5356 ), и представляет собой практически полный аналог одной из версий известного многим korHarmonics. Индикатор распознает следующие фигуры и их разновидности: ABCD, Gartley (Butterfly, Crab, Bat), 3Drives, 5-0, Batman, SHS, One2One, Camel, Triangles, WXY, Fibo, Vibrations. По умолчанию в настройках включено отображение только фигур ABCD и Gartley. Линия реверса помо

Future prediction is something any trader would love to know, through this simple prediction algorithm can give a picture of the future. This algorithm is based on past data and the average prices of the data to simulate future candles. This is an indicator that will be redrawn. This indicator is completely free, can be used as a trend reference but absolutely do not use for trading.
FREE

Introduction To Time Box Indicator Time Box Indicator is a must have indicator for any trader. It will display daily, weekly and Monthly box according to your preferences. Yet, you can extend any important price levels in your chart automatically. You can use them as the significant support and resistance levels. It is very simple but effective tool for your trading.
Graphic Setting Use White Chart Line Style for Current Open price
Daily Setting Update Timeframe for daily box Number of days
FREE

Индикатор Sonar Mechanic. Свяжитесь со мной после покупки для получения индикатора баланса сил SonarHistogram бесплатно! Индикатор Sonar Mechanic - действительно рабочий индикатор, потому что работает одновременно по трем авторским алгоритмам, которые правильно определяют трендовые и контртрендовые сигналы для входа в рынок. Индикатор работает на всех активах и таймфреймах. Руководство по индикатору здесь: https://www.mql5.com/en/blogs/post/750128
На золоте и на валютных парах хорошие си
Я являюсь поклонником индикаторов скользящих средних. Если вы тоже поклонник скользящих средних, то обнаружите, что XPMA (XP MOVING AVERAGE) собирает самые распространенные скользящие средние в одном индикаторе. Простая скользящая средняя, экспоненциальная скользящая средняя, сглаженная скользящая средняя, линейно-взвешенная скользящая средняя, двойная экспоненциальная скользящая средняя, тройная экспоненциальная скользящая средняя, Т3 скользящая средняя и другие. К тому же он окрашивает/преду

If you trade or wish to trade the popular HLHB Trend-Catcher System, then this indicator is for you! It detects when the HLHB system entry rules are met and sends out an alert in the form of notifications to your mobile phone and to your pc. By automatically sending you notifications, this indicator lessens your trading work load as you don't have to sit in from of your pc all day checking all the chats for when the entry rules are met. This indicator does all the dirty work for you. When the si
FREE

The Investment Castle Chances indicator will show signals on the chart for entering a buy or sell trade. There are 2 types of signals for each direction as follows: Buy / Sell (Orange colored candlesticks) Strong Buy (Green colored candlesticks) / Strong Sell (Red colored candlesticks) You may place a buy trade once you see the Buy arrow or vise versa, or you might prefer to wait for a further confirmation “Strong Buy” / “Strong Sell”. This indicator works best with the high time frames H1, H
FREE
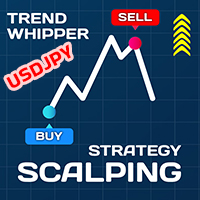
Download the free version here.
A Full Concept of BUY/SELL Scalping Strategy Trend detection is one of the basic challenges of every trader. Finding a way to tell when to enter a trade is very important, timing is a game changer, not too early and not too late. Sometimes, due to not knowing the market conditions, the trader closes his positions with a small profit or allows the losses to grow, these are the mistakes that novice traders make. Indicator Trend Whipper is a complete trading st
FREE

Индикатор из семейства зигзагов з уровнями. В первую очередь отмечу аргументы в пользу целесообразности применения индикатора уровней. Они дают трейдеру следующие преимущества:
Альтернативные точки зрения — индикатор уровней помогает взглянуть на уровни со стороны, сравнить их с несколькими автоматическими системами, выявить ошибки;
Экономия времени — снижение затрат сил на самостоятельное построение линий;
Точный математический расчёт — возможен быстрый подсчёт уровней, соотношения показ

Этот индикатор является основой для эксперта, который можно отнести к категории "почти Грааль". См. подробности ниже. Этот индикатор отображает проекцию графика ренко на ценовой график. Эта проекция отображается в виде ступенчатой линии, а не в виде "кирпичей" (прямоугольников). См. слайды 1 и 2. Сокращённое название индикатора: LRC – L ine of R enko on the price C hart . Принцип его построения очень прост. Сначала строится сетка горизонтальных линий (уровн
FREE
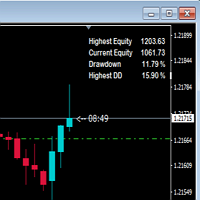
This indicator shows drawdown based on highest equity. Usually drawdown is used to show performance of a trading account especially when someone participate in a trading contest. If drawdown exceed a determined number, the contest account will be disqualified. So, I hope, this indicator will warn us in maintaining the drawdown and the account still be saved.
FREE

Индикатор Profit/Loss Meter позволяет измерить Прибыль/Убыток будущей, прошлой или текущей сделки в валюте депозита и оценить уровень маржи на момент окончания сделки. Индикатор работает на базе встроенного МТ4 инструмента "Перекрестие" и имеет следующие параметры: Trade Direction = Buy/Sell Направление позиции Lot size = 0.1 Размер лота Font size = 8 Размер шрифта Font color = DeepSkyBlue Цвет шрифта Offset horizontal Сдвиг текста по вертикали Offset vertical Сдвиг текста по горизонтали
FREE

This is Free product you are welcome to use for your needs! Also I very appreciate your positive feedbacks! Thanks a lot! // More great Expert Advisors and Indicators are available here: https://www.mql5.com/en/users/def1380/seller // Also you are welcome to join to profitable , stable and reliable signal https://www.mql5.com/en/signals/1887493 Forex Indicator Spread Display for MT4 , Trading Support . Spread Display indicator shows current spread of forex pair where it is attached. I
FREE

ATR Volatility строит на графике волатильность на основе индикатора ATR и уведомляет пользователя в случае пересечения установленного пользователем верхнего или нижнего порога (фиолетовые и коричневые линии на скриншотах). На графике отображаются круги когда волатильность по ATR пересекает верхний порог снизу вверх или нижний порог сверху вниз. Этот инструмент был разработан специально по запросу одного из наших клиентов. Надеемся, он вам понравится. Вам нужен специально разработанный индикатор?
FREE

The Multi-Timeframe High Low Points (MTF High Low Points) indicator is a powerful tool for traders using MetaTrader 4 (MT4) to analyze price movements across different timeframes. This versatile indicator helps traders identify significant support and resistance levels by displaying the highest and lowest price points within a specified number of bars on multiple timeframes simultaneously. Key Features: Multi-Timeframe Analysis: MTF High Low Points allows traders to monitor high and low price le
FREE

Для данного индикатора разработан новый алгоритм определения тренда. Алгоритм с приемлимой точностью генерирует входные сигналы и уровни выхода. Стратегия для торговли по тренду, фильтрация и все необходимые функции, встроенные в один инструмент! Принцип работы индикатора заключается в том, чтобы при размещении на график автоматически определять текущее состояние рынка, анализировать исторические данные, на основании исторических данных и выводить на экран трейдеру указания к дальнейшим действия

This indicator mostly inspired from BW-ZoneTrade custom indicator from MT5. How To Use:
BUY when both dots colored Green. SELL when both dots colored Red. In addition to original one, MACD-OsMA-generated signal also can be drawn. Input Description:
MA_period_short: Faster EMA period for MACD. Applied when drawMACD is true. MA_period_long: Slower EMA period for MACD. Applied when drawMACD is true. MACDperiod: MA period for MACD. Applied when drawMACD is true. drawMACD: When true, draw an addi
FREE

This trial scanner works with the other "Smart Market Structure Opportunity Scanner", and is basically an extension of that scanner with added features to find more accurate entry opportunities for day trading or refined swing trading. The most important added features are: 1) The ADRs ( Average Daily Range ) for the last 5 days would have color and +/- sign that shows the direction of each days ADR move. 2) I added RSI values for each of the trading timeframes ( 1min, 5min, 15min, 30min
FREE
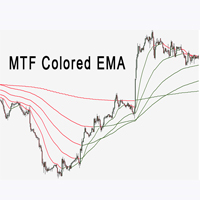
Индикатор Multi Time Frame EMA очень помогает в определении направления тренда. Это может быть отличным дополнением к вашей существующей стратегии или новой основой. Мы, люди, можем принимать лучшие решения, когда лучше видим визуально. Поэтому мы разработали его, чтобы показать разные цвета для восходящих и нисходящих трендов. Каждый может настроить его так, как ему удобно. Мы можем установить индикатор Ema для всех таймфреймов на графике.
Indikator Multi Time Frame EMA ochenʹ pomogayet v op
FREE

Pivot levels is indicator showing 7 pivot levels. It is adjusted for major use, including: all standard time frames
choice of periods to show three popular calculation formulas (typical, median, weighted) 9 level Camarilla pivot
pivot day shift choice of properties for lines and labels choice of showing alerts when crossing pivot lines Parameters: ----------Main parameters----------- Timeframe - time frame for pivot levels
Number of periods to show - displays pivot levels for number of period
FREE

The Rayol Code Hour Interval Lines indicator was designed to assist your trading experience. It draws the range of hours chosen by the user directly on the chart, so that it enables traders to visualize price movements during their preferred trading hours, providing traders a more comprehensive view of price movements and market dynamics. This indicator allows the user to choose not only the Broker's time, but also the Local time. This way, the user no longer needs to calculate local ti
FREE
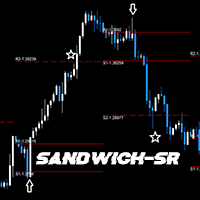
GENERAL DESCRIPTION
Simple SR Projection based on selected instrument's historical data. Best used in conjunction with current market sentiment, and fundamental analysis. Currently limited to selected pairs due to of historical data to project accurate levels.
Generally, for support and resistance, 2 levels are drawn, respectively. The inner levels (R1,S1) project the highs and lows during the opening stages of selected time frame. The outer levels, represent the targets to reach during the c
FREE
if you want more information please pm me
HI guys this my developing indicator 1st version alert logic work well.. this indicator using can you stronger currency and top weaker currency find well,this;s indicator multy MTF time frame strength work.very good for SL trend screener intraday trader and long time trader, very easily can you watch stronger and weaker index.I hope to more improve this future further,thank you

As traders, we know that identifying price contractions and consolidations is crucial for profitable trading. Fortunately, we have a powerful tool at our disposal. The indicator to trade price consolidation is designed to identify price contraction and alerts us on formation. It does this by analyzing historical price data and identifying price action patterns. The algorithm then uses this information to mark the zone , potential targets and liquidity lines, giving us valuable insights into mark

Индикатор фрактал - один из основных в различных стратегиях. Индикатор Volume Fractals расширил функциональность стандартной версии, получил настройки фильтрации фракталов и отображение объемных фракталов, где объемный фрактал - это экстремум не только по цене, но и максимум по объему.
Применение Установка стоп-лоссов Сигнал на разворот Установка отложенных ордеров на пробой фрактала
Настройки Bars of history - количество баров графика, для которых рисуется индикатор Left side minimum bars -
FREE

Модифицированный осциллятор MACD. Классический индикатор, соединяющий в себе трендовый индикатор с осциллятором для обнаружения точек входа. Имеет мультитаймфреймовую панель, а также 3 типа уведомлений
Преимущества:
Работает на всех инструментах и таймсериях Трендовый индикатор с осциллятором для входов Мультипериодная панель на всех таймфреймах Подключаемые стрелки при появлении сигналов Три типа уведомлений: push, email, alert
MT5 версия -> ЗДЕСЬ / Наши новости -> ЗДЕСЬ
Как рабо
FREE

RaysFX Stochastic L'indicatore RaysFX Stochastic è un indicatore personalizzato per la piattaforma MetaTrader 4.
Caratteristiche principali:
-Indicatori separati: L'indicatore viene visualizzato in una finestra separata sotto il grafico principale. -Livelli dell'indicatore: L'indicatore ha due livelli predefiniti, 20 e 80, che possono essere utilizzati come livelli di ipervenduto e ipercomprato. -Buffer dell'indicatore: L'indicatore utilizza quattro buffer per calcolare e memorizzare i suo
FREE
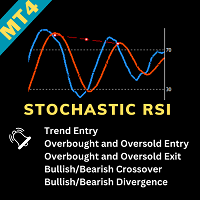
Stochastic RSI Indicator - Master the Art of Timing Elevate your trading game with the "Stochastic RSI Indicator." This powerful tool marries the Stochastic oscillator with the Relative Strength Index (RSI), offering precise insights into market dynamics. It's your key to mastering the art of timing in trading. About the Indicator : The Stochastic RSI Indicator combines two robust indicators - Stochastic and RSI - to provide traders with an exceptional tool for identifying entry and exit points
FREE

Apollo Striker - это эффективный BUY/SELL стрелочный индикатор, который предсказывает направление движения цены. Данный индикатор подойдет абсолютно всем трейдерам вне зависимости от предпочитаемой стратегии или же валютной пары, тайм фрейма. Это стрелочный индикатор может быть использован абсолютно с любым торговым инструментом, будь это валюты, металлы, индексы, акции или даже криптовалюта. Более того трейдер самостоятельно может легко адаптировать сигналы индикатора для любой торговой пары и

Индикатор Blahtech Fisher Transform представляет собой осциллятор, который отображает графике области перекупленности и перепроданности. Алгоритм преобразования Фурье (Fisher Transform) преобразует цены с любой формой распределения в нормальное распределение. Конечным результатом является кривая с резкими точками разворота, которые могут помочь определить бычьи или медвежьи тренды. Значения Fisher Transform выше 1.6 на дневном графике считаются хорошими областями для сделок на разворот.
Основн
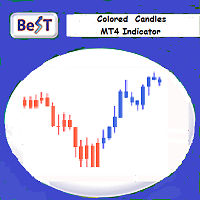
BeST_Colored Candles is an MT4 FREE indicator that can change the color of the Candlesticks based on the MACD, SAR or RSI values and levels. It is a Composite indicator that by selection uses the values each one of these 3 indicators and their critical levels in order to create numerical relationships that when satisfied cause their corresponding candlesticks coloration.
Input parameters
== Basic Settings
-- Please Select Indicator - for selecting which one of the above 3 indicator
FREE

This Scanner Dashboard uses the Extreme TMA System Arrows Indicator to show good BUY/SELL signals. This Product contains dashboard only. It does not contain the Abiroid_Arrow_Extreme_TMA.ex4 indicator. Arrows indicator is not necessary for dashboard to work. To see arrows, you can buy the arrows indicator separately if you like: https://www.mql5.com/en/market/product/44822
Dash shows Slopes for current and Higher Timeframes. - 1st diamond is current TF. Next diamonds are higher TFs
(Please N
Magic Moving это профессиональный индикатор для торговой платформы MetaTrader 4. В отличие от Moving Average , Magic Moving дает более качественные сигналы и способен выявлять длительные тренды. В индикаторе есть возможность настроить уведомления (алерт, почта, телефон), что поможет вам не пропустить торговый сигнал. Версия Magic Moving для терминала MetaTrader5 : https://www.mql5.com/ru/market/product/35363 Преимущества индикатора Индикатор прекрасно подходит для скальпинга. Дает минимум

Индикатор отображает на графике важные технические уровни. Эти уровни выступают поддержкой или сопротивлением для движения цены. Наиболее важные уровни кратные 100 и 50 пунктам. Также можно вывести уровни кратные 25 пунктам. При достижении ценой уровня выводится алерт или пуш-уведомление. Версия для MT5 https://www.mql5.com/ru/market/product/69740 Настройки
Show Levels 100 pips - показать уровни кратные 100 пунктам Show Levels 50 pips - показать уровни кратные 50 пунктам Show Levels 25 pips
FREE

For some trader's charts analysis use, specially for multi timeframe trading strategies . When you need to check something of the time within different timeframe at the same symbol chart, even different symbol charts, this indicator will show the crosshair at sync moving. You just need to load this indicator into some charts, then the crosshair will shown automatic.
FREE

"Drivers Road Bands" indicator that is designed to be used in the 1H, 4H and 1D timeframes in the most ideal way. If we compare timeframes to roads and streets; main streets and highways with high traffic volume are similar to high-time timeframes in technical analysis. If you can interpret the curvilinear and linear lines drawn by this indicator on the graphic screen with your geometric perspective and develop your own buy and sell strategies; you may have the key to being a successful trader.
FREE

Moving Average Dashboard Bars ago - это уникальная мультивалютная, мультитаймфреймовая панель. Эта панель очень проста. Выбираете две скользящие средние, инструменты и таймфреймы После этого, панель Moving Average Dashboard Bars показывает сколько баров назад скользящие средние совершили бычье или медвежье пересечение. Он также в реальном времени показывает наличие бычьего или медвежьего пересечения. Индикатор рисуется в подокне. Панель Moving Average Dashboard Bars ago может быть полезна при то
FREE

Identification of support and resistance areas
A useful indicator for traders
completely free
Can be used in all symbols
Can be used in all time frames
It has three different trends: short term, medium term, long term
Settings:
Clr1,2: You can change the color of the lines
Type Trend: You can determine the trend
Message me for questions, criticism and suggestions
FREE
Узнайте, как легко и просто купить торгового робота в MetaTrader AppStore - магазине приложений для платформы MetaTrader.
Платежная система MQL5.community позволяет проводить оплату с помощью PayPal, банковских карт и популярных платежных систем. Кроме того, настоятельно рекомендуем протестировать торгового робота перед покупкой, чтобы получить более полное представление о нем.
Вы упускаете торговые возможности:
- Бесплатные приложения для трейдинга
- 8 000+ сигналов для копирования
- Экономические новости для анализа финансовых рынков
Регистрация
Вход
Если у вас нет учетной записи, зарегистрируйтесь
Для авторизации и пользования сайтом MQL5.com необходимо разрешить использование файлов Сookie.
Пожалуйста, включите в вашем браузере данную настройку, иначе вы не сможете авторизоваться.