|
12+ 年
经验
|
36
产品
|
210
演示版
|
|
0
工作
|
0
信号
|
0
订阅者
|
MT5文章整理: https://www.mql5.com/zh/blogs/post/713550
MT5 Articles List: https://www.mql5.com/en/blogs/post/90
Ranking of servers for MT5 signals: https://www.mql5.com/en/blogs/post/716917
Ranking of top 100 servers for MT4 signals: https://www.mql5.com/en/blogs/post/716958
Trading Account: https://www.icmarkets.com/?camp=18135
MT5 Articles List: https://www.mql5.com/en/blogs/post/90
Ranking of servers for MT5 signals: https://www.mql5.com/en/blogs/post/716917
Ranking of top 100 servers for MT4 signals: https://www.mql5.com/en/blogs/post/716958
Trading Account: https://www.icmarkets.com/?camp=18135
Jinsong Zhang

· 1
445
Jinsong Zhang
2013.08.12
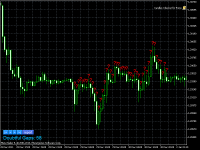
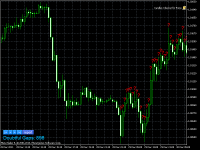
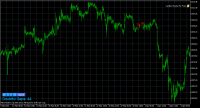
用EA做测试前,要检查历史数据正确否。pls check history datas before backtest your EA.