Suvashish Halder / 个人资料
- 信息
|
4 年
经验
|
103
产品
|
51
演示版
|
|
0
工作
|
0
信号
|
0
订阅者
|
💧 PRO TIP - Don't Open Orders Where You See, Open Them Where Others Can't!
📈 Decoding Market Phases Like Never Before – The SuvashishFx Revolution!
🛑 Join To Learn Market Depth - https://www.mql5.com/en/channels/suvashishfx
🗄️ VPS I Use - https://bit.ly/3TyCwTK
👋 Hello, I'm Suvashish Halder – a Chart Analyst, Trader, and Data Expert 📊, dedicated to transforming market insights into profitable strategies.
Trading is a journey of continuous learning, where every day brings new discoveries. Patience, discipline, and risk management are the key pillars of success in this ever-evolving landscape.
Beyond trading, I develop innovative tools designed to enhance traders' experiences. While some tools may be game-changers, others may not fit every strategy—but the goal is to explore, learn, and grow together.
Wishing you all the best on your trading journey. Happy trading, and thank you! 🙏
Suvashish Halder
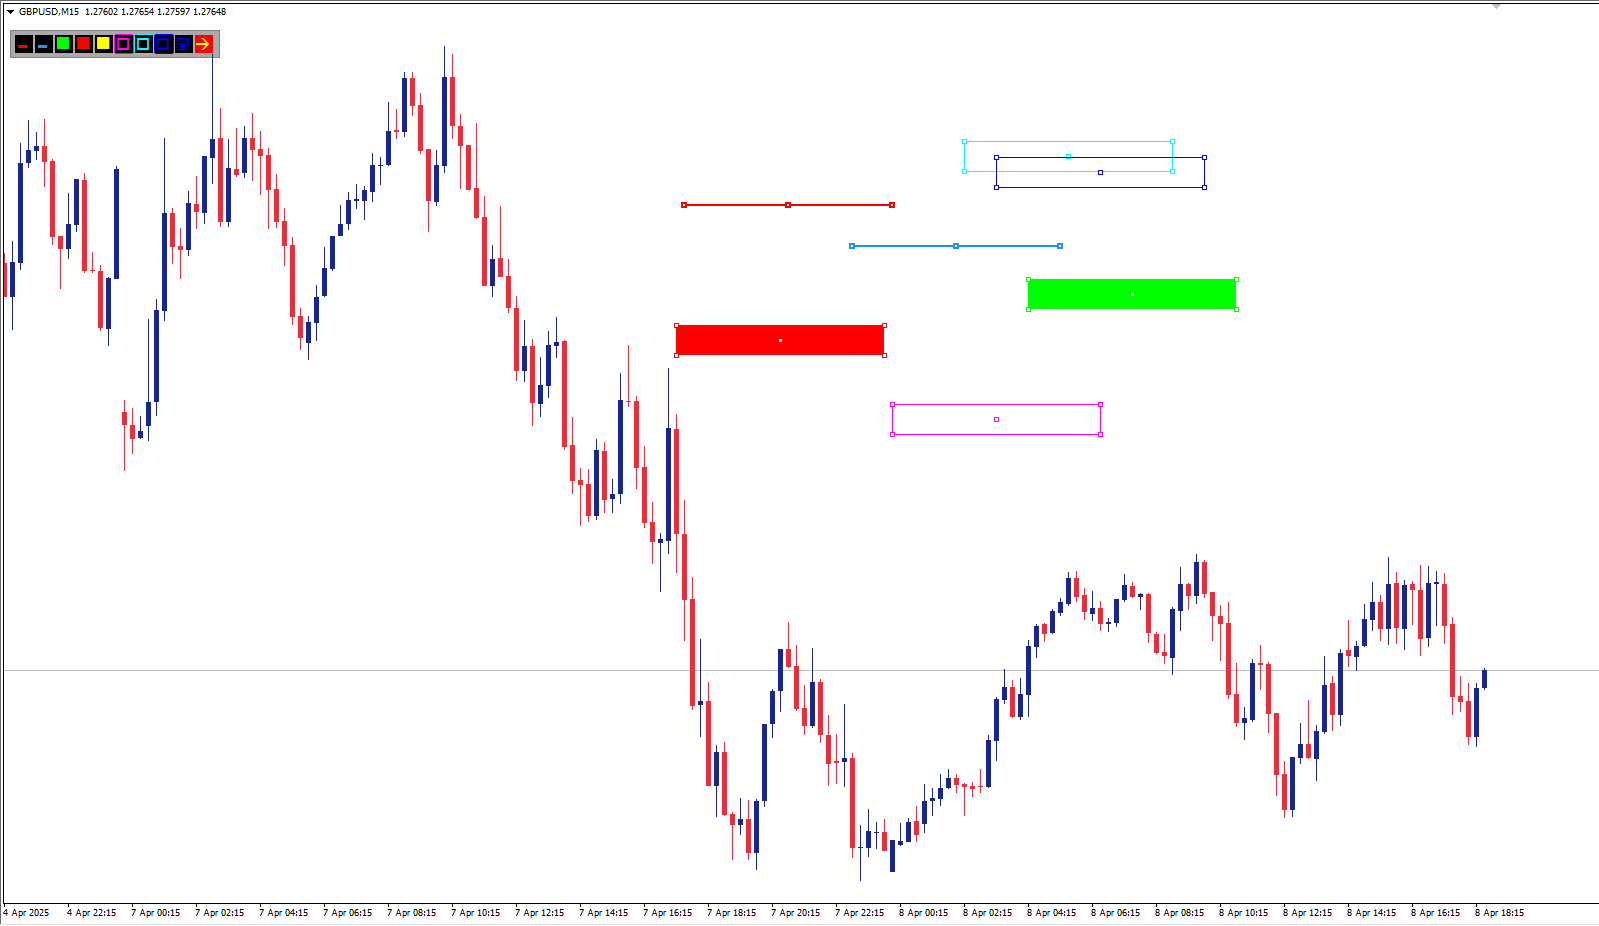
🚀 NEW RELEASE: Level Box Tool - Completely FREE!!!
✅ I’ve just published the Level Box Tool — a clean, powerful utility for technical traders who use rectangles, levels, and trendlines in their strategy.
✅ MT4 Version - https://www.mql5.com/en/market/product/136009/
✅ MT5 Version - https://www.mql5.com/en/market/product/136010/
✅ I’ve just published the Level Box Tool — a clean, powerful utility for technical traders who use rectangles, levels, and trendlines in their strategy.
✅ MT4 Version - https://www.mql5.com/en/market/product/136009/
✅ MT5 Version - https://www.mql5.com/en/market/product/136010/

分享社交网络 · 1
Suvashish Halder
🌟 Supply Demand Analyzer 🌟
✅ MT4 Version - https://www.mql5.com/en/market/product/129287/
✅ MT5 Version - https://www.mql5.com/en/market/product/129288/
✅ MT4 Version - https://www.mql5.com/en/market/product/129287/
✅ MT5 Version - https://www.mql5.com/en/market/product/129288/

分享社交网络 · 1
Suvashish Halder

🚨 Gold rejected perfectly from the 8/8 "Maximum Resistance" level at 3125.00!
Before you hit buy, think twice — this level is no joke. It often acts as a strong reversal zone. Watch for signs of weakness or confirmation before jumping in.
📉 Buy smart, not blindly.
👉 Available for MT4 and MT5
✅ MT4 - https://www.mql5.com/en/market/product/132809/
✅ MT5 - https://www.mql5.com/en/market/product/132810/

分享社交网络 · 1
Suvashish Halder

🛑 Join To Learn Market Depth - https://www.mql5.com/en/channels/suvashishfx

分享社交网络 · 2
Suvashish Halder

📈 Details Posted on Channel
🛑 Join To Learn Market Depth - https://www.mql5.com/en/channels/suvashishfx
🛑 Join To Learn Market Depth - https://www.mql5.com/en/channels/suvashishfx

分享社交网络 · 1
Suvashish Halder

🛑 Join To Learn Market Depth - https://www.mql5.com/en/channels/suvashishfx
Let's Learn Today! 📚
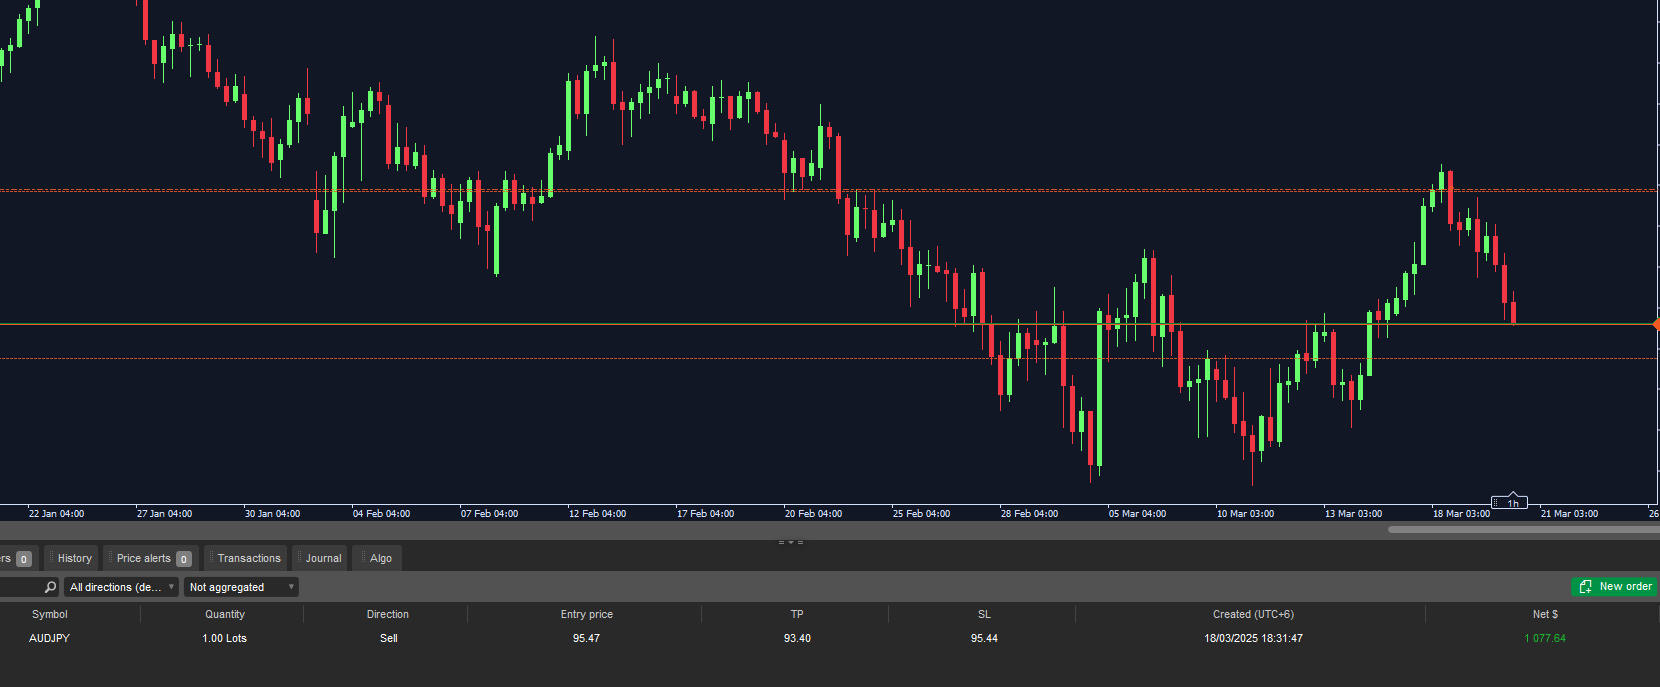
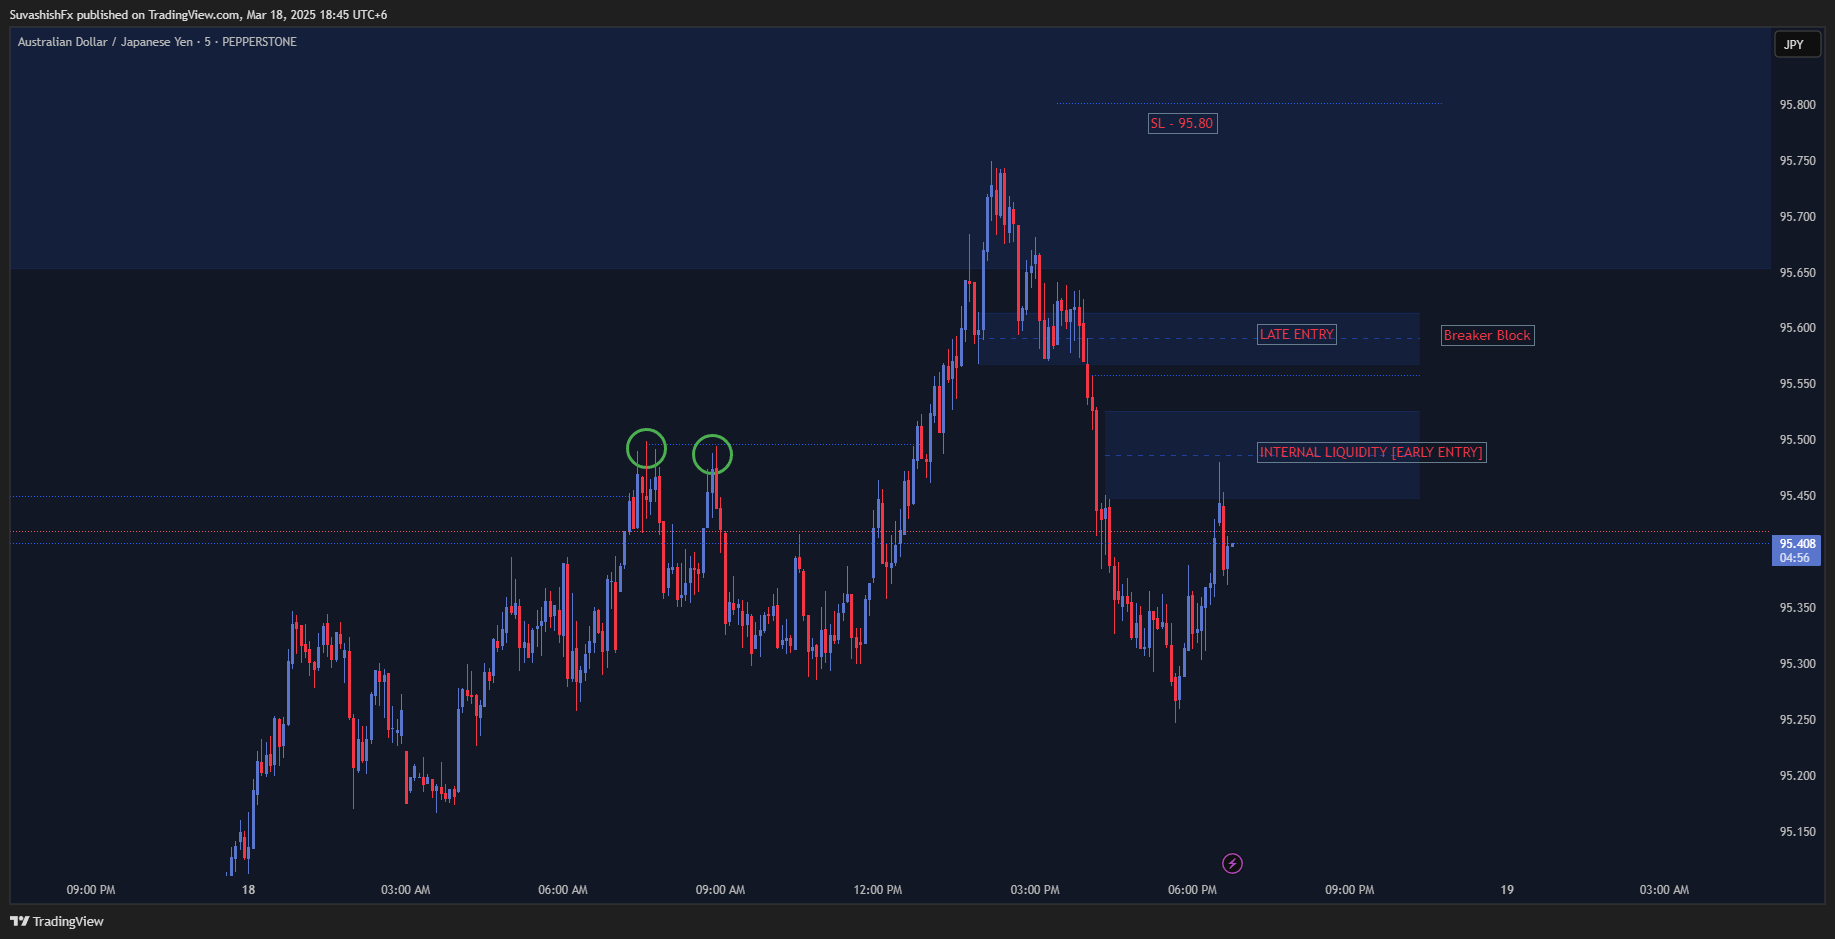
I've opened a new position 📈, and you might be wondering why 🤔. Let me break it down simply:
First, I checked the Higher Timeframe. I noticed the price performed a Liquidity Sweep 💦—basically, it cleared out previous liquidity—and then entered a Supply Zone. This gave me an important hint that sellers 🐻 might step in here.
Next, I switched to a Lower Timeframe [5M] to hunt for my entry confirmation. What did I find? Price broke through an early Demand Zone, but then struggled to retest that same zone. Instead, it created a Fair Value Gap (FVG) 🔥—another strong confirmation signal.
And guess what else I noticed on the left side of the chart? A clear Head and Shoulders pattern 👤 was forming. Seeing all these confirmations together—Liquidity Sweep, Supply Zone entry, FVG formation, and a Head and Shoulders pattern—gave me confidence 💪 to take this trade.
That's why I jumped in 🚀. Easy, right? 😄

分享社交网络 · 2
Suvashish Halder
2025.03.20
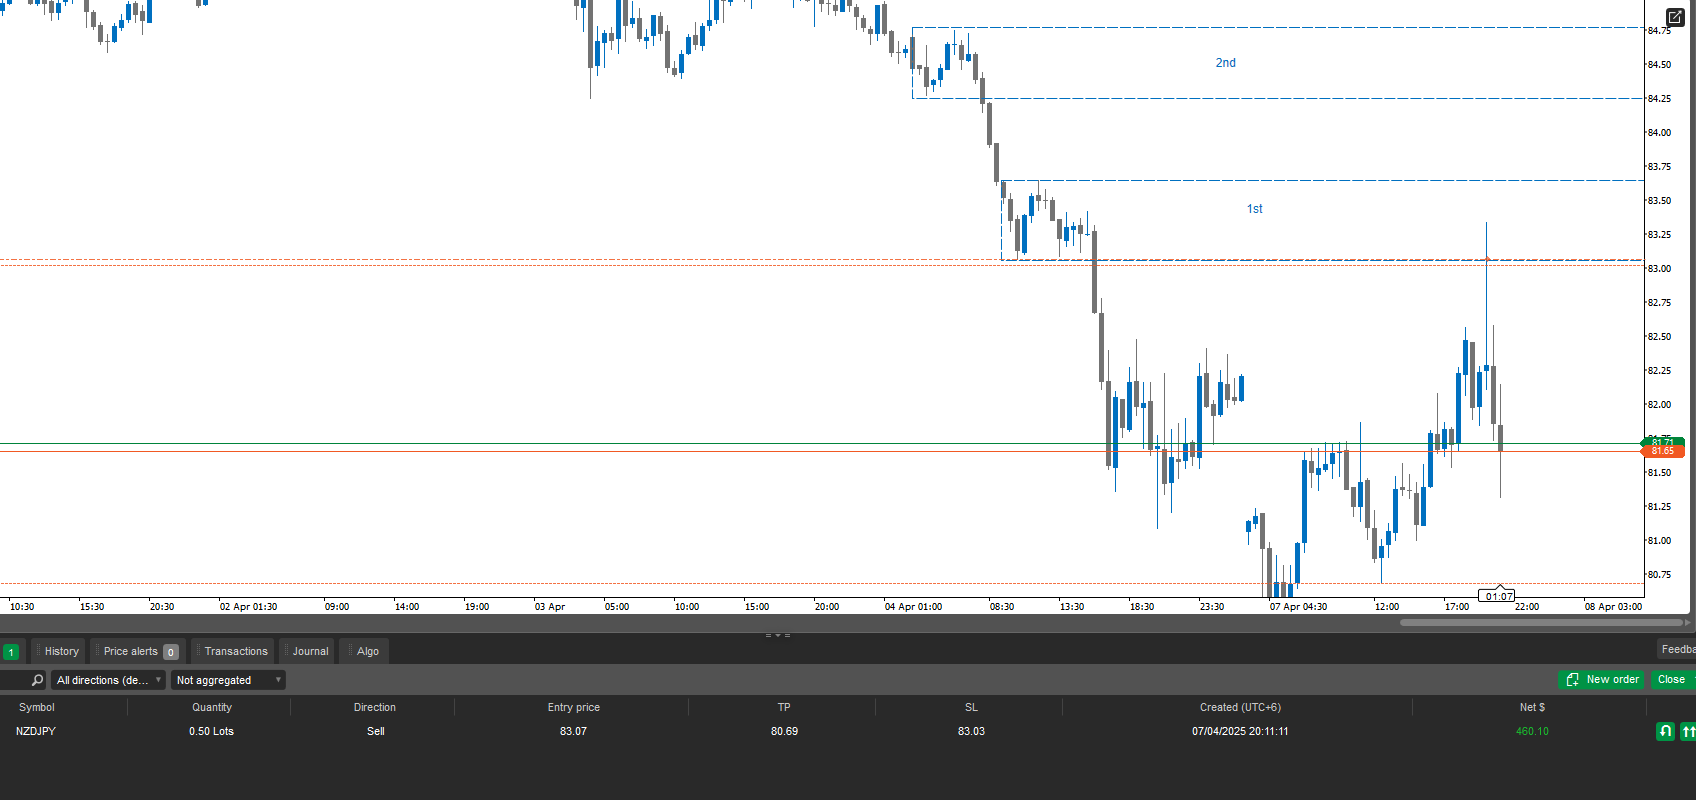
The risk-reward ratio was 1:5, meaning I aimed for 200 pips. Right now, it's up 170 pips in profit. Check my recent post for details!
Suvashish Halder
🛑 Completely Free Access
✅ MT4 - https://www.mql5.com/en/market/product/134266/
✅ MT5 - https://www.mql5.com/en/market/product/134478/
✅ MT4 - https://www.mql5.com/en/market/product/134266/
✅ MT5 - https://www.mql5.com/en/market/product/134478/

分享社交网络 · 1
Suvashish Halder

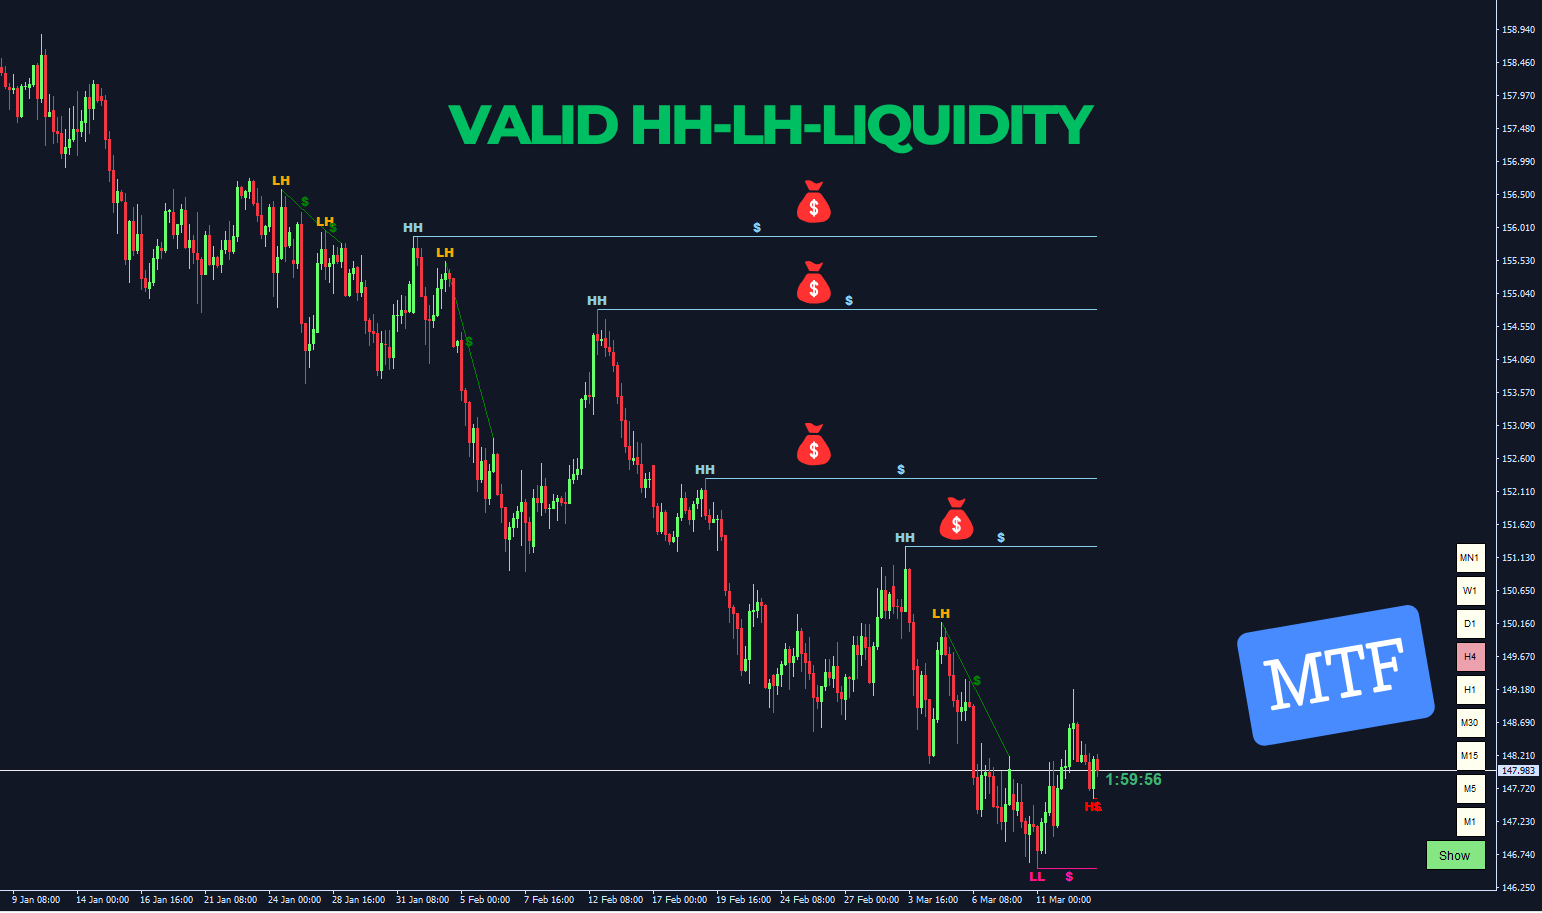
🚀 Let's go short! The price has already touched the previous supply zone and dropped 📉. On the next touch, it aggressively rejected downward again 🔻. This confirms our short setup, targeting the next liquidity level 🎯. We'll look to buy at the demand area after a liquidity sweep 💰. As always, manage risk and protect your account 🛡️. Good luck! 🍀

分享社交网络 · 2
Suvashish Halder
📌 Price Action Map
✅ MT4 - https://www.mql5.com/en/market/product/133698/
✅ MT5 - https://www.mql5.com/en/market/product/133944/
✅ MT4 - https://www.mql5.com/en/market/product/133698/
✅ MT5 - https://www.mql5.com/en/market/product/133944/

分享社交网络 · 1
Suvashish Halder
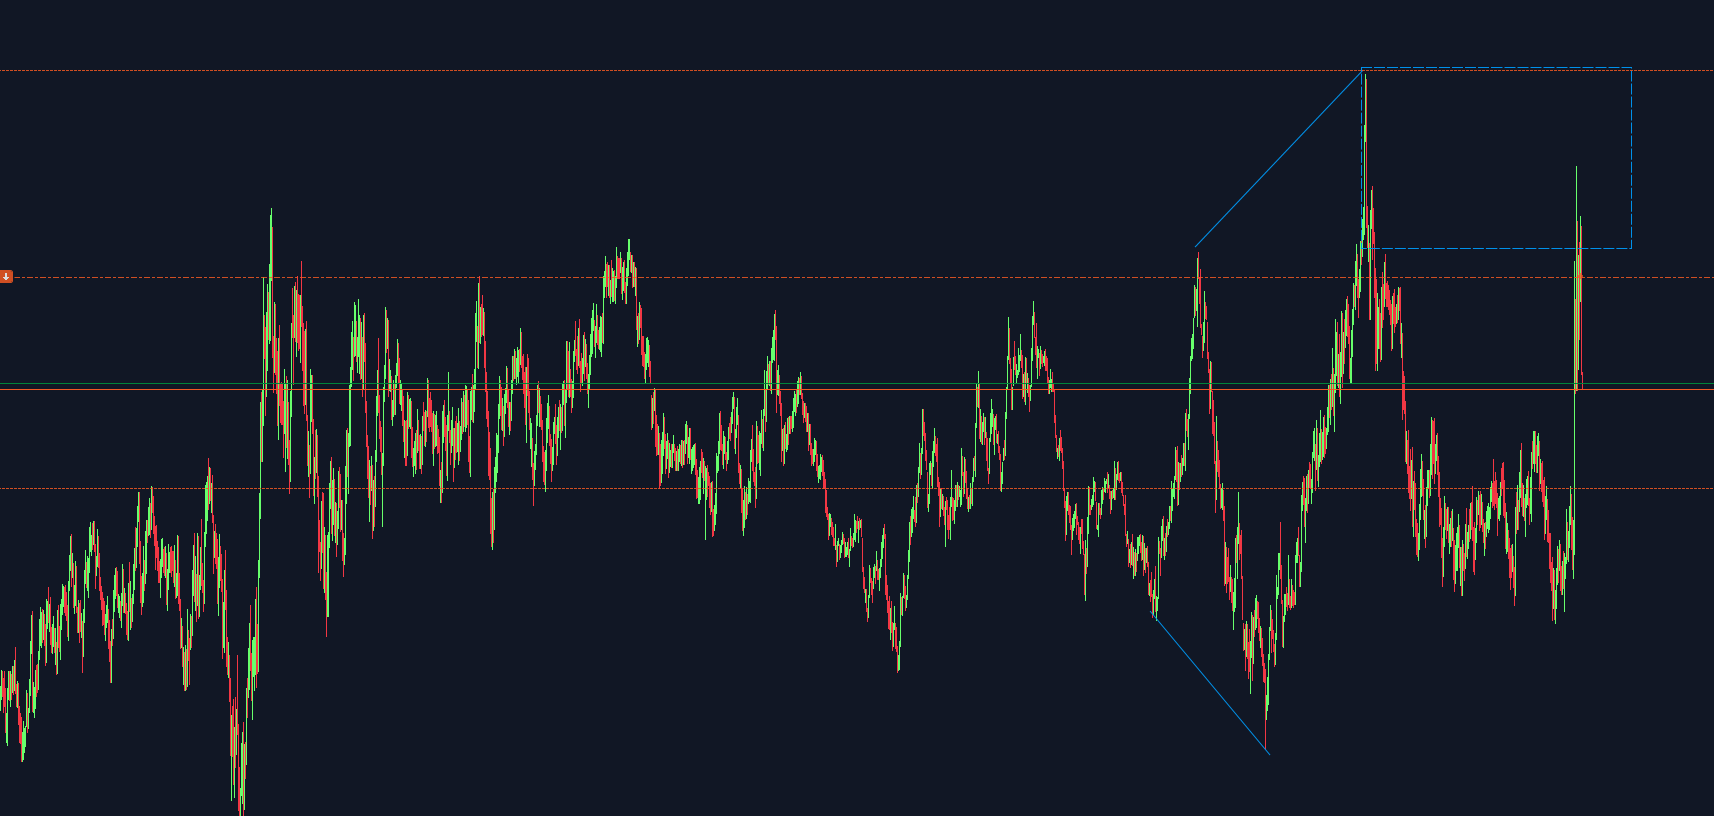
🛑 Gold Trade After News - USD Strong But How It Moves?
👉 The strong upside movement you're seeing could be due to liquidity grabs and stop hunts rather than genuine USD weakness.
Big players (institutions & market makers) pushed price up to take out stop-losses & trigger breakout traders—then they'll likely reverse it back down if USD strength holds.
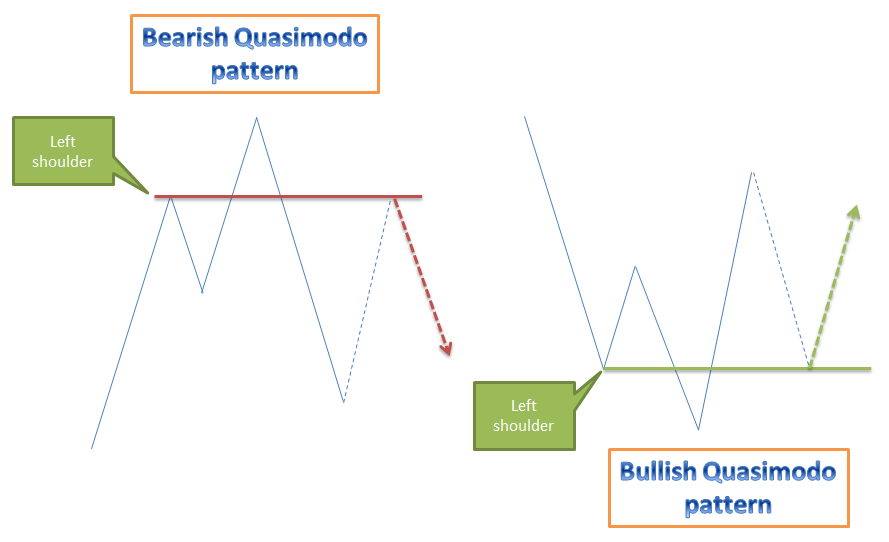
📌 QM Pattern Alert ⚠️
A Quasimodo (QM) pattern is forming, with a Higher High (HH) & Lower Low (LL) structure. Price is likely coming to this key zone before dropping.
What’s Next? 🔍
✅ Watch for rejection wicks & bearish confirmation
✅ If price closes back below resistance → High chance of reversal
✅ If USD stays strong → Expect a move down after liquidity is taken
🛑 Trap Alert!
Many retail traders buy breakouts, but smart money grabs liquidity before dumping price.
If this is a fake move, we’ll see a strong rejection & drop soon.

分享社交网络 · 1
Suvashish Halder

Today's setup is taken from the 4H timeframe. I've spotted a clear Quasimodo (QM) or Head-and-Shoulders (HS) pattern on both the H4 and 1H charts. 🔍⏳ After closely monitoring market movements, I noticed liquidity left behind alongside a fresh demand zone. 💧📊
Now, patiently waiting for a liquidity sweep and retest of the demand zone before anticipating a bullish move upwards. 🚀📈
Remember, always stick to your risk management rules! ⚠️🛡️
Now, patiently waiting for a liquidity sweep and retest of the demand zone before anticipating a bullish move upwards. 🚀📈
Remember, always stick to your risk management rules! ⚠️🛡️

分享社交网络 · 1
Suvashish Halder
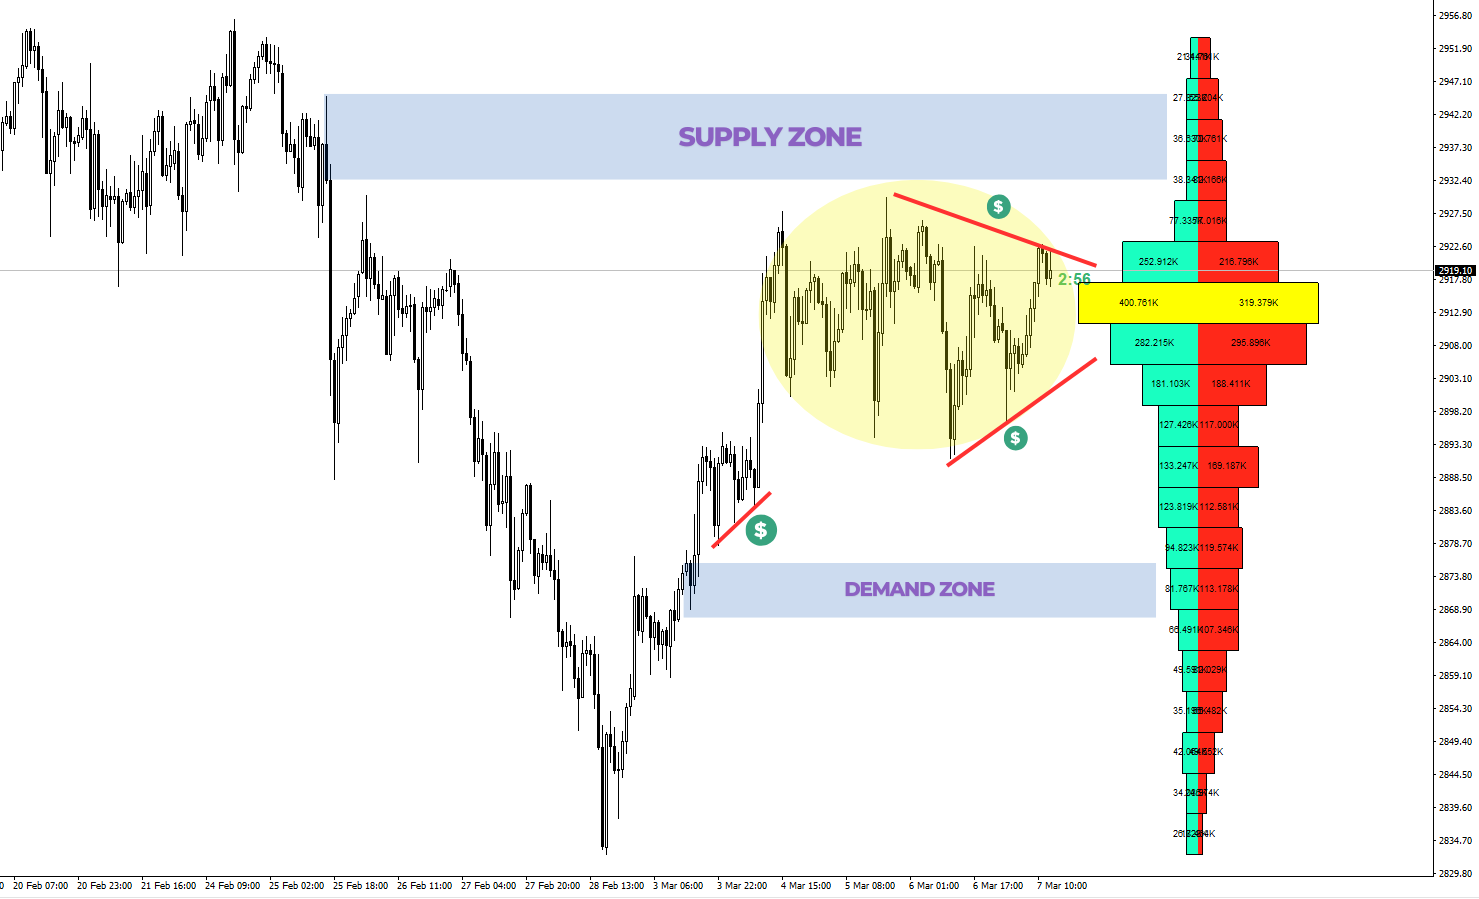
Hello traders! 👋
I wanted to share a detailed analysis based on the recent market order flow and liquidity zones, focusing on a potential bearish move from the supply zone.
🧠 Order Flow Insights:
In the attached chart, you can see a clear order flow imbalance:
Buy Orders: 400k
Sell Orders: 319k
This discrepancy highlights a potential liquidity trap, where market makers may be setting a trap for late buyers while accumulating sell orders.
💧 Liquidity Zones:
I've marked liquidity zones with the green dollar signs ($). These areas often attract market makers aiming to sweep liquidity before initiating a substantial market move:
Above the consolidation zone: Many stop-loss orders from early short sellers are likely present.
Below the consolidation zone: This is where stop-losses of long positions might reside, providing liquidity.
🛑 Supply & Demand Zones:
Supply Zone (Top Blue Area): A critical resistance zone where price is likely to absorb liquidity before a potential drop.
Demand Zone (Bottom Blue Area): Strong support where buying interest previously surged.
📐 Chart Pattern Analysis:
The yellow-highlighted area showcases an ascending wedge pattern, which traditionally signals a bearish reversal. Combined with the liquidity sitting above, this increases the chances of a fake breakout followed by a significant drop.
🔍 Market Expectation:
Liquidity Sweep: Price may initially push up into the supply zone, triggering buy orders and collecting stop losses above.
Reversal Signal: Look for a rejection in the supply zone, ideally with a wick rejection or a bearish engulfing candle.
Bearish Move: After the liquidity is swept, a strong downward move is expected, potentially targeting the demand zone below.
📈 Proposed Trading Strategy:
Entry: Short position upon confirmation of rejection in the supply zone.
Stop Loss: Just above the recent high to avoid premature stops.
Take Profit: Around the demand zone or at the next volume profile high.
⚖️ Risk Management Tips:
Wait for Confirmation: Avoid entering before a clear bearish signal.
Monitor Volume: Look for declining buy volume as price approaches the supply zone, indicating buyer exhaustion.

分享社交网络 · 2
:
