Hiroyuki Kadowaki / 个人资料
- 信息
|
不
经验
|
0
产品
|
0
演示版
|
|
0
工作
|
0
信号
|
0
订阅者
|
Independent trader focused on multi-timeframe market structure, price behavior, and evidence-based decision making.
I develop trading tools and explore AI-assisted market analysis to better understand uncertainty rather than predict markets.
好友
请求
通过他们的个人资料或用户搜索添加好友,您将能够看到他们是否在线
传出请求
Hiroyuki Kadowaki
Experimental Video Brief A short AI-assisted market brief based on structured multi-timeframe analysis from Aviation Landing...
分享社交网络
5
Hiroyuki Kadowaki
Experimental Video BriefI also tested a short AI-avatar briefing based on the same market analysis shown below.
This is an experimental demonstration of how structured market-state information can be transformed into a short visual market brief.
https://youtu.be/8HSAM7bSWFg
This is an experimental demonstration of how structured market-state information can be transformed into a short visual market brief.
https://youtu.be/8HSAM7bSWFg
Hiroyuki Kadowaki
An experiment in AI-assisted market observation.
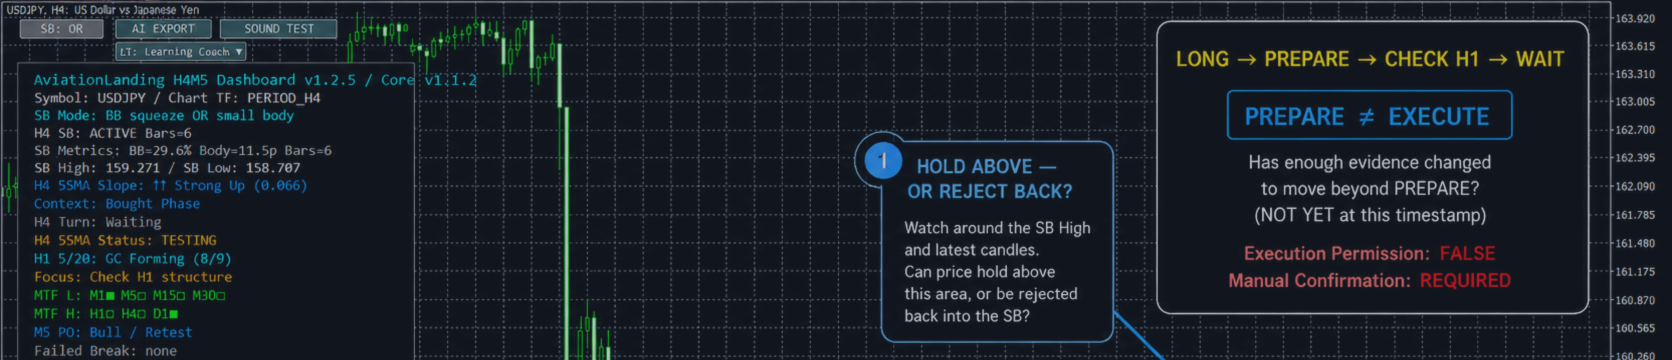
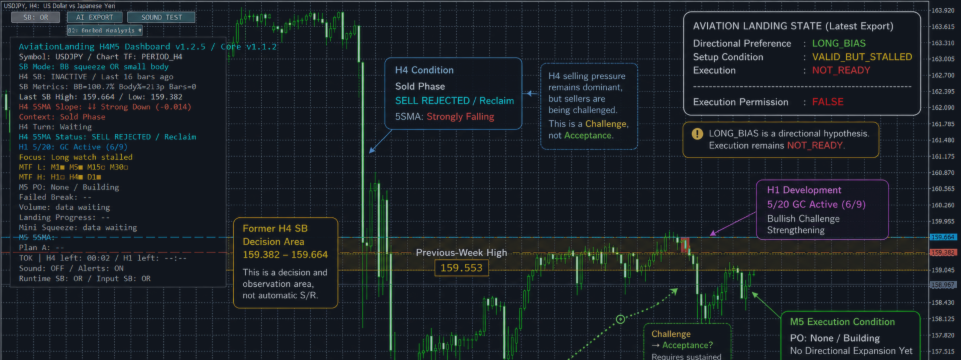
I used an Aviation Landing market-state export to provide structured multi-timeframe information to AI, then returned the resulting analysis to the original chart as a visual overlay.
The objective is not to generate a buy/sell signal, but to make the reasoning process visible: higher-timeframe context, structural conflict, lower-timeframe confirmation, and what still remains unresolved.
In this example, the AI identified a long-side directional hypothesis while keeping execution at NOT_READY — illustrating the distinction between directional bias and actual trade readiness.
Market state → AI interpretation → visual feedback to the chart.
Experimental workflow / analysis example only. Not investment advice.
I used an Aviation Landing market-state export to provide structured multi-timeframe information to AI, then returned the resulting analysis to the original chart as a visual overlay.
The objective is not to generate a buy/sell signal, but to make the reasoning process visible: higher-timeframe context, structural conflict, lower-timeframe confirmation, and what still remains unresolved.
In this example, the AI identified a long-side directional hypothesis while keeping execution at NOT_READY — illustrating the distinction between directional bias and actual trade readiness.
Market state → AI interpretation → visual feedback to the chart.
Experimental workflow / analysis example only. Not investment advice.
: