Vladimir Pastushak / 프로필
- 정보
|
13+ 년도
경험
|
50
제품
|
850
데모 버전
|
|
0
작업
|
0
거래 신호
|
0
구독자
|
💻 그동안 MetaTrader 4 및 MetaTrader 5를 위한 다양한 트레이딩 알고리즘, Expert Advisor(EA) 및 도구를 개발했으며, 제가 구상한 아이디어를 지속적으로 실제 환경에서 테스트해 왔습니다.
📊 저는 과장된 약속보다 알고리즘의 논리, 코드의 품질, 트레이딩 시스템을 세부적으로 설정할 수 있는 기능, 그리고 다양한 시장 상황에서 시스템의 동작을 객관적으로 평가할 수 있는 것을 중요하게 생각합니다.
🔍 제가 개발하는 모든 제품은 저의 실제 경험을 바탕으로 만들어지며, 공개 전에 테스트를 진행합니다.
⚙️ 트레이더가 작동 원리를 이해하고, 사용 가능한 설정을 확인하며, 특정 솔루션이 자신의 거래에 적합한지 직접 판단할 수 있는 도구를 개발하는 것을 목표로 합니다.
Set 파일 및 30일 동안 사용할 수 있는 제품 데모 버전을 제공합니다.
VR Proton - https://trading-go.net/mqp_proton_zip
VR Smart Grid - https://trading-go.net/mqp_smart_grid_zip
VR Lollipop - https://trading-go.net/mqp_lollipop_zip
VR Locker - https://trading-go.net/mqp_locker_zip
VR Black Box - https://trading-go.net/mqp_black_box_zip
VR Watch list and Linker – https://trading-go.net/mqp_watch_list_and_linker_zip
VR Trade Panel - https://trading-go.net/mqp_trade_panel_zip
내가 함께 일하는 브로커:
RoboForex https://trading-go.net/mqrb
🔥 트레이딩에 관한 모든 것 + Telegram 교육: https://t.me/tgforexen
💥 공식 채널을 통해 제품을 구매하시면 다음 혜택을 받으실 수 있습니다:
1️⃣ 선물, 보너스 및 기타 프로그램.
2️⃣ 프로그램을 무료로 사용할 수 있는 기회.
3️⃣ 설정 및 Set 파일 무료 제공.
4️⃣ 무료 기술 지원.
5️⃣ 모든 업데이트 무료 제공.
💥 제 공식 웹사이트를 방문해 주세요: https://trading-go.net/
VR Proton is based on modern automatic position management technologies, including multi-level protection, breakeven and several trailing stop algorithms. Of particular interest is Dynamic Extra, an adaptive tracking technology that changes the nature of trailing as the movement develops, allowing you to manage your position differently at an early and advanced stage of the trend. To work with the series, an intelligent average exit model is used, which calculates the closing level of selected positions, taking into account their prices, volumes and a given margin of profit.
VR Proton is not a classic indicator Advisor or a simple trading grid. It is a technological position management system in which the algorithms of opening, protection, averaging and tracking are combined into a single dynamic model. The robot works on hedging accounts and provides extensive customization options for different instruments and trading conditions. Before using it on a live account, it is recommended to test it on a demo account and select the parameters taking into account the characteristics of the selected instrument and broker.
VR Proton — торговая система нового поколения для MetaTrader 4 и MetaTrader 5, созданная вокруг современной концепции управления торговой серией. Подробнее о продукте: https://www.mql5.com/ru/market/product/199157. Робот не ограничивается поиском точки входа: он анализирует фактическое развитие движения цены и на каждом этапе применяет соответствующую логику — от трендового открытия и последовательного наращивания до работы с откатами, изменения средней цены серии и выхода с контролируемым результатом. BUY и SELL управляются независимо, позволяя алгоритму адаптироваться к различным сценариям движения рынка.
В основе VR Proton используются современные технологии автоматического управления позициями, включая многоуровневую защиту, безубыток и несколько алгоритмов трейлинг-стопа. Особый интерес представляет **Dynamic Extra** — адаптивная технология сопровождения, которая изменяет характер трейлинга по мере развития движения, позволяя по-разному управлять позицией на ранней и развитой стадии тренда. Для работы с сериями применяется интеллектуальная модель усреднённого выхода, рассчитывающая уровень закрытия выбранных позиций с учётом их цен, объёмов и заданного запаса прибыли.
VR Proton — это не классический индикаторный советник и не простая торговая сетка. Это технологическая система управления позициями, в которой алгоритмы открытия, защиты, усреднения и сопровождения объединены в единую динамическую модель. Робот работает на хеджирующих счетах и предоставляет широкие возможности настройки для разных инструментов и торговых условий. Перед использованием на реальном счёте рекомендуется провести тестирование на демо-счёте и подобрать параметры с учётом особенностей выбранного инструмента и брокера.
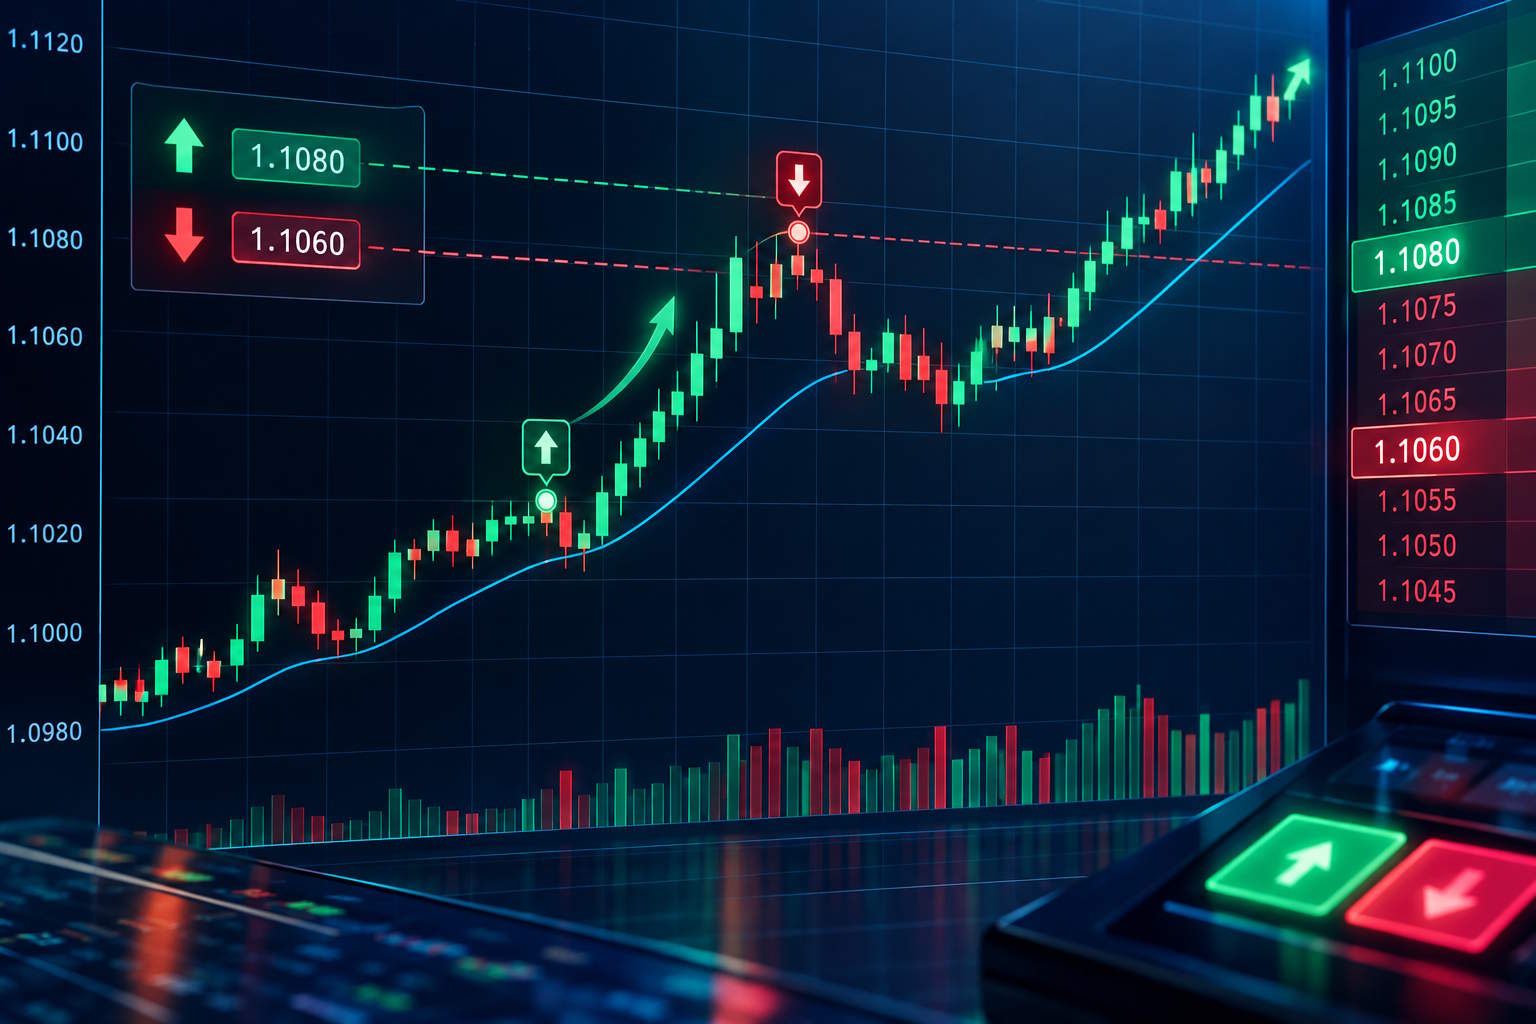
A Japanese candlestick is a way of displaying an asset's price on a chart, originating in 18th-century Japan where it was used for trading rice. Each candlestick shows four key prices for a chosen period: the open, the close, the highest and the lowest price. The body of the candle is the distance between the open and the close, while the thin lines (the wicks, or shadows) mark the high and the low. When the close is above the open, the body is usually white or green (a bullish candle); when the close is below the open, it is black or red (a bearish candle).
Candlesticks pack more information into a single unit than a plain closing-price line chart. By reading the shape of the body and the shadows, traders judge the balance of power between buyers and sellers within the period. A long body signals a decisive move by one side, a short body signals hesitation and struggle, and long shadows show that the price was pushed back from its extremes. This is why candlestick analysis has become one of the core tools of technical analysis worldwide.
Once you learn to read candlesticks, you gain a universal language of the market that works on any timeframe and any instrument, from currency pairs to stocks and cryptocurrencies. Confident chart reading requires understanding not only individual candles but also their combinations — patterns. In my profile you will find a lot of useful educational information (don't forget to add me as a friend). Profile: https://www.mql5.com/ru/users/voldemar
Что такое японская свеча?
Японская свеча — это способ отображения цены актива на графике, пришедший к нам из Японии XVIII века, где его использовали для торговли рисом. Каждая свеча показывает четыре ключевые цены за выбранный период: цену открытия, цену закрытия, максимальную и минимальную цену. Тело свечи — это расстояние между ценой открытия и ценой закрытия, а тонкие линии (тени, или фитили) показывают максимум и минимум периода. Если закрытие выше открытия — тело обычно белое или зелёное (бычья свеча), если ниже — чёрное или красное (медвежья свеча).
Свечи объединяют в себе информацию, которую графики из одних только линий закрытия не передают. По форме тела и теней трейдеры судят о балансе сил между покупателями и продавцами внутри периода. Длинное тело говорит о решительном движении одной из сторон, короткое — о нерешительности и борьбе, а длинные тени указывают на то, что цену отталкивали от крайних значений. Именно поэтому свечной анализ стал одним из базовых инструментов технического анализа во всём мире.
Освоив чтение свечей, трейдер получает универсальный язык рынка, понятный на любом таймфрейме и на любом инструменте — от валютных пар до акций и криптовалют. Чтобы уверенно читать графики, важно понимать не только отдельные свечи, но и их сочетания — паттерны. Данная тема подробно раскрыта в https://t.me/tgforexru — там больше учебных материалов для начинающих трейдеров.
A price chart is a visual representation of how an asset's price changes over time. It is the trader's most important tool: the chart shows where the market is headed and whether it is rising, falling or moving sideways. A chart turns thousands of trades made by market participants into a clear picture that can be analyzed. No type of analysis is possible without a price chart — not even news-based trading — because price has always been and remains the top priority in decision-making.
There are three main types of charts: line, bar and candlestick. A line chart connects closing prices and gives a general idea of the trend. A bar chart shows the open, high, low and close for each period. The candlestick chart is the most popular one: a single candle compactly reflects all four key prices and helps you quickly assess market sentiment. In addition to the chart type, it is important to choose the right timeframe — the time scale you use to analyze price movement, from one-minute to monthly candles.
Proper chart reading is the ability to see trends, support and resistance levels, reversal and continuation patterns, and to estimate the strength of a move by volume. Chart analysis is the foundation of most trading strategies, so it is the best place for a beginner to start. Once you master the basics — chart types, timeframes and core patterns — you will make a confident first step toward systematic and conscious trading.
In my profile, you will find a lot of useful educational information — don't forget to add me as a friend. Profile: https://www.mql5.com/ru/users/voldemar
Что такое график цены?
График цены — это визуальное представление движения котировок актива во времени. Это самый главный инструмент трейдера: именно по графику он оценивает, куда движется рынок и в каком состоянии он находится — растёт, падает или торгуется в диапазоне. График превращает тысячи сделок участников рынка в наглядную картину, которую можно анализировать. Без графика невозможно представить ни один вид анализа — ни технический, ни даже торговлю по новостям, ведь цена всегда была и остаётся высшим приоритетом для принятия решений.
Существует три основных вида графиков: линейный, баровый и японские свечи. Линейный график соединяет точки закрытия и даёт общее представление о тренде. Баровый график показывает цену открытия, максимум, минимум и закрытие за период. Самым популярным считается график японских свечей: одна свеча компактно отражает все четыре ключевые цены и позволяет быстро оценить настроение рынка. Помимо вида графика, важно уметь выбирать таймфрейм — временной масштаб, на котором вы анализируете движение цены, от минутных до месячных свечей.
Грамотное чтение графика — это умение видеть тренды, уровни поддержки и сопротивления, разворотные и продолженческие фигуры, а также оценивать силу движения по объёмам. Именно графический анализ лежит в основе большинства торговых стратегий, поэтому начинающему трейдеру стоит начать обучение именно с него. Освоив базу — виды графиков, таймфреймы и базовые паттерны — вы сделаете первый уверенный шаг к системной и осознанной торговле.
В моём профиле Вы найдете много полезной обучающей информации, (не забудь добавить в друзья) Профиль: https://www.mql5.com/ru/users/voldemar
MetaTrader 용 트레이딩 로봇(Expert Advisor) 으로, 추세에 따른 포지션 진입, 되돌림 구간에서의 평균가 조정, 자동 손익분기점 전환, 트레일링 스톱 및 통제된 최소 수익을 확보하는 포지션 시리즈 청산 기능을 결합한 제품입니다. VR Proton은 단순한 «시그널 기반 Expert Advisor»가 아닙니다. 포지션 시리즈 전체를 관리하는 완전한 시스템으로, 언제 거래를 추가할지, 언제 손익분기점 Stop Loss로 수익을 보호할지, 언제 가격을 따라 보호 수준을 이동할지, 그리고 언제 사전에 설정된 수익 여유를 포함한 평균 가격 수준에서 포지션을 청산할지를 자동으로 결정합니다. 설정 파일, set 파일, 보너스 및 제품 데모 버전은 개발자 프로필 에서 확인할 수 있습니다. 이 로봇이 관심을 받을 수 있는 이유 하나의 금융상품에서 여러 거래를 수동으로 관리하는 것은 트레이딩에서 가장 어려운 작업 중 하나입니다. 트레이더가 하나의 포지션을 관리하는 동안 다른
Learning trading starts not with buying your first asset, but with theory fundamentals. First, understand how trading differs from investing, how the market works and who its participants are. Then study the basic concepts: quotes, spread, order types, charts and candlestick patterns. Without this foundation, money in the account will disappear quickly — trading requires knowledge like any profession. At this stage, the main thing is not speed but understanding, and the best way is structured educational materials.
The second step is practice on a demo account. A virtual account fully replicates real trading: the same quotes, orders and terminal, but with educational money instead of real ones. On a demo, you master the mechanics: open charts, set Stop Loss and Take Profit, try orders and gain first experience without risk. In parallel, master risk management — learn not to risk more than a certain percentage of the deposit in a single trade and calculate position size. These rules matter more than any strategy.
The third step is the transition to real trading and continuous learning. Keep a trading journal, record every trade and its result, analyze mistakes. Use a strategy tester to check ideas on history and gradually build your own trading system. Trading is a continuous process: the market changes, and you must change with it. Start small, move step by step — and the result will come.
In my profile you will find a lot of useful educational information (don't forget to add me as a friend) Profile: https://www.mql5.com/en/users/voldemar
С чего начать изучение трейдинга?
Изучение трейдинга начинается не с покупки первого актива, а с теории основ. Сначала стоит разобраться, чем торговля отличается от инвестирования, как устроен рынок и кто его участники. Затем изучить базовые понятия: котировки, спред, типы ордеров, графики и свечные модели. Без этого фундамента деньги на счёте быстро исчезнут — торговля требует знаний, как любая профессия. На этом этапе главное — не скорость, а понимание, и лучший способ — структурированные обучающие материалы.
Второй шаг — практика на демо-счёте. Виртуальный счёт полностью повторяет реальную торговлю: те же котировки, ордера и терминал, но вместо реальных денег — учебные. На демо вы осваиваете механику: открываете графики, ставите Stop Loss и Take Profit, пробуете ордера и получаете первый опыт без риска. Параллельно стоит освоить риск-менеджмент — научиться не рисковать больше определённого процента депозита в одной сделке и рассчитывать объём позиции. Эти правила важнее любой стратегии.
Третий шаг — переход к реальной торговле и постоянное обучение. Заведите торговый журнал, фиксируйте каждую сделку и её результат, анализируйте ошибки. Используйте тестер стратегий, чтобы проверить идеи на истории, и постепенно выстраивайте собственную торговую систему. Трейдинг — это непрерывный процесс: рынок меняется, а вместе с ним должны меняться и вы. Начните с малого, идите шаг за шагом — и результат придёт.
В моём профиле Вы найдете много полезной обучающей информации, (не забудь добавить в друзья) Профиль: https://www.mql5.com/ru/users/voldemar
A ticker is a short alphabetic code of a financial instrument used to find it on the exchange. For example, the largest US companies have simple and memorable tickers: AAPL — Apple, TSLA — Tesla, MSFT — Microsoft. For currency pairs, their designation acts as a ticker — EURUSD, XAUUSD, GBPJPY. A ticker allows you to identify an instrument unambiguously: you use it to find a price in the terminal and add the instrument to your watchlist.
Why are tickers needed? Thousands of instruments are traded on the exchange at the same time, and many of them have similar names. A short code eliminates confusion: instead of the full name "Apple Inc.", three or four letters are enough, and the rules for assigning tickers are uniform on each venue. A ticker is both the "name" and "address" of an instrument: it tells which asset you mean and helps you quickly get its quote.
How to work with tickers in practice? In a trading terminal, the ticker is used when searching for an instrument, opening a chart and adding it to Market Watch. Sometimes the same ticker exists on different exchanges — for example, for companies listed both in the US and Europe. In this case, specify the exchange or venue, otherwise it is easy to make a mistake and choose the wrong asset. Attention to tickers is a small but important part of trading discipline.
In my profile you will find a lot of useful educational information (don't forget to add me as a friend) Profile: https://www.mql5.com/en/users/voldemar
What is a ticker?
A ticker is a short alphabetic code of a financial instrument used to find it on the exchange. For example, the largest US companies have simple and memorable tickers: AAPL — Apple, TSLA — Tesla, MSFT — Microsoft. For currency pairs, their designation acts as a ticker — EURUSD, XAUUSD, GBPJPY. A ticker allows you to identify an instrument unambiguously: you use it to find a price in the terminal and add the instrument to your watchlist.
Why are tickers needed? Thousands of instruments are traded on the exchange at the same time, and many of them have similar names. A short code eliminates confusion: instead of the full name "Apple Inc.", three or four letters are enough, and the rules for assigning tickers are uniform on each venue. A ticker is both the "name" and "address" of an instrument: it tells which asset you mean and helps you quickly get its quote.
How to work with tickers in practice? In a trading terminal, the ticker is used when searching for an instrument, opening a chart and adding it to Market Watch. Sometimes the same ticker exists on different exchanges — for example, for companies listed both in the US and Europe. In this case, specify the exchange or venue, otherwise it is easy to make a mistake and choose the wrong asset. Attention to tickers is a small but important part of trading discipline.
In my profile you will find a lot of useful educational information (don't forget to add me as a friend) Profile: https://www.mql5.com/en/users/voldemar
A quote is the current price of a financial instrument at which it can be bought or sold at a given moment. In the market, a quote is always presented as two values: Bid — the price at which you can sell an asset, and Ask — the price at which you can buy it. The difference between them is called the spread and forms the broker's income. Quotes are exactly what you see in the terminal window: they update continuously, reflecting every change in supply and demand.
Quotes differ across markets. In the currency market, the quote of a currency pair is the price of one currency expressed in another: for example, EURUSD 1.0850 means that one euro costs 1.0850 dollars. Prices are shown with four or five decimal places, and a change in the last digit is called a point (pip). The same logic applies to stocks, metals and cryptocurrencies: a quote shows the current market price in real time.
Why does a trader need to understand quotes? Without knowing the exact Bid and Ask prices, it is impossible to open a position correctly, calculate spread costs or identify an entry point. A quote is the language of the market: the ability to read it and track its changes is the foundation of any analysis. A beginner should get used to seeing two prices in the terminal rather than one — this makes trading conscious and predictable.
In my profile you will find a lot of useful educational information (don't forget to add me as a friend) Profile: https://www.mql5.com/en/users/voldemar
Что такое котировка?
Котировка — это текущая цена финансового инструмента, по которой его можно купить или продать в данный момент. На рынке котировка всегда представлена двумя значениями: Bid — цена, по которой вы можете продать актив, и Ask — цена, по которой вы можете его купить. Разница между ними называется спредом и составляет доход брокера. Именно котировки вы видите в окне терминала: они непрерывно обновляются, отражая каждое изменение спроса и предложения.
Котировки бывают разными для разных рынков. На валютном рынке котировка валютной пары — это цена одной валюты, выраженная в другой: например, EURUSD 1.0850 означает, что за один евро дают 1.0850 доллара. Цены отображаются с точностью до четырёх или пяти знаков после запятой, а изменение последнего знака называют пунктом. Для акций, металлов и криптовалют действует та же логика: котировка показывает актуальную рыночную цену в реальном времени.
Зачем трейдеру понимать котировки? Без точного знания цены Bid и Ask невозможно корректно открыть позицию, рассчитать издержки на спред и определить точку входа. Котировка — это язык рынка: умение читать её и следить за её изменением лежит в основе любого анализа. Новичку стоит привыкнуть видеть в терминале именно две цены, а не одну, — и тогда торговля станет осознанной и предсказуемой.
В моём профиле Вы найдете много полезной обучающей информации, (не забудь добавить в друзья) Профиль: https://www.mql5.com/ru/users/voldemar
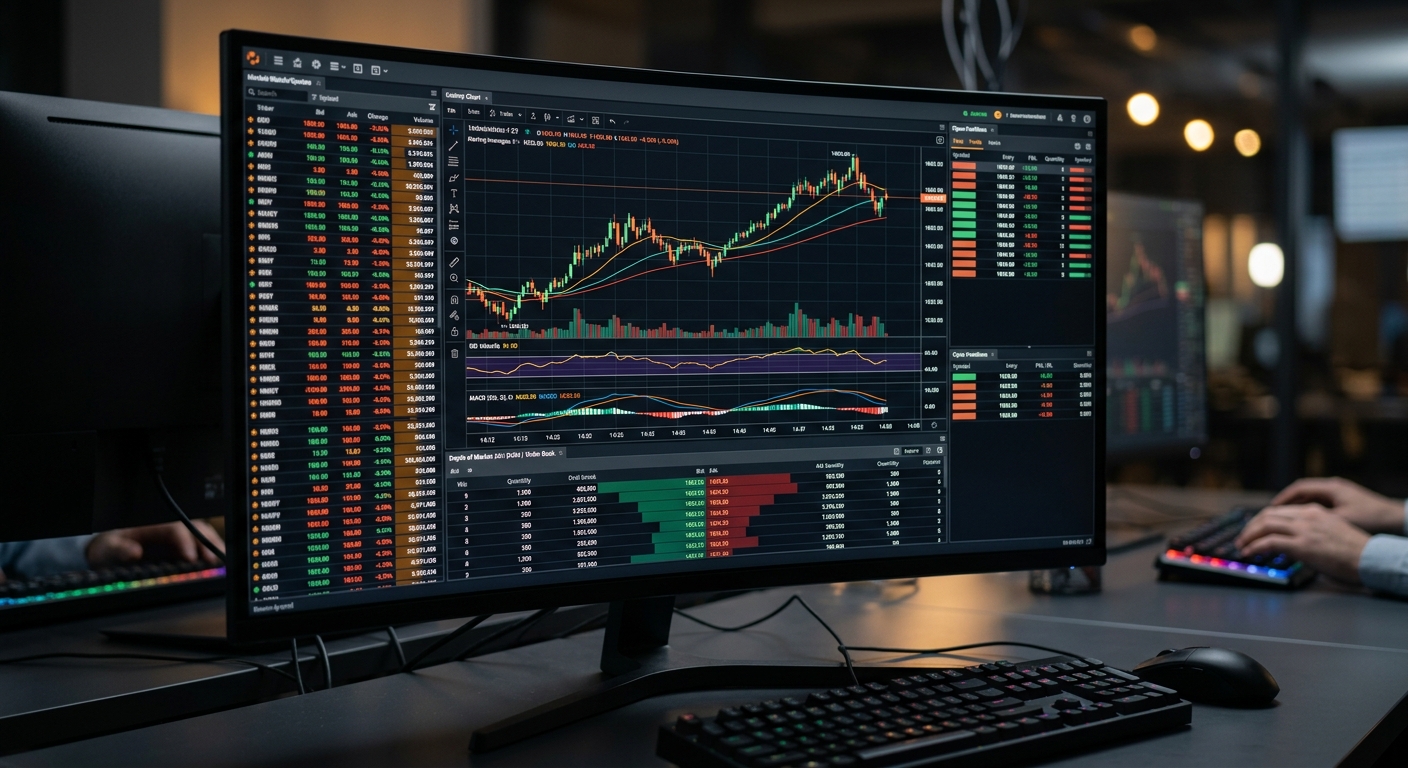
A trading terminal is the program through which a trader works with the financial market. It is in the terminal that charts, quotes, the order book and open positions are displayed, and all trading commands — buying, selling, modifying a deal — pass through it. A trading terminal can be called the trader's workplace: without it, you can neither see the market nor influence it. The best-known example is MetaTrader 5, which provides chart analysis, trading orders, quotes and the ability to automate trading.
What does a trading terminal consist of? The core of the system is the price chart, where candlesticks are built, indicators are applied and support and resistance levels are drawn. Around the chart there are the quote window with Bid and Ask prices, the open positions tab, the trade journal and the orders window. A modern terminal lets you place pending orders, open positions instantly with one click, manage Stop Loss and Take Profit, and launch trading robots — Expert Advisors that analyze the market and trade automatically.
A trading terminal is not just a "window with charts" but a full-fledged tool for managing capital and risk. It is important for a beginner to choose a terminal that is clear and convenient, and to master it on a demo account: this way you can learn the mechanics — from opening a chart to closing a position — without risking real money. A deep knowledge of your terminal saves time, reduces mistakes and makes trading truly conscious.
In my profile you will find a lot of useful educational information (don't forget to add me as a friend) Profile: https://www.mql5.com/en/users/voldemar
Что такое торговый терминал?
Торговый терминал — это программа, через которую трейдер работает с финансовым рынком. Именно в терминале отображаются графики, котировки, стакан заявок и открытые позиции, а все торговые команды — покупка, продажа, модификация сделки — проходят именно через него. Терминал можно назвать рабочим местом трейдера: без него невозможно ни увидеть рынок, ни повлиять на него. Самый известный пример — MetaTrader 5, который предоставляет графический анализ, торговые ордера, котировки и возможность автоматизации торговли.
Из чего состоит торговый терминал? Ядро системы — график цены, на котором строятся японские свечи, наносятся индикаторы и рисуются уровни поддержки и сопротивления. Вокруг графика располагаются окно котировок с ценами Bid и Ask, вкладка открытых позиций, журнал сделок и окно ордеров. Современный терминал позволяет выставлять отложенные заявки, мгновенно открывать позиции в один клик, управлять Stop Loss и Take Profit, а также запускать торговых роботов — советников Expert Advisor, которые анализируют рынок и торгуют автоматически.
Торговый терминал — это не просто «окно с графиками», а полноценный инструмент для управления капиталом и риском. Новичку важно выбирать терминал, который понятен и удобен, и осваивать его на демо-счёте: так получится изучить механику — от открытия графика до закрытия позиции — без риска для реальных денег. Глубокое знание своего терминала экономит время, уменьшает количество ошибок и делает торговлю по-настоящему осознанной.
В моём профиле Вы найдете много полезной обучающей информации, (не забудь добавить в друзья) Профиль: https://www.mql5.com/ru/users/voldemar
A broker is a professional intermediary between a trader and the exchange. As a licensed company or a private specialist, he provides a retail trader with access to trading: it is the broker who accepts the client's orders, checks them, and sends them to the exchange for execution. An ordinary person has no direct access to trading — this path is closed by venue rules, so without a broker you can neither open an account, nor buy a share, nor make a currency deal. The terminal in which you see charts is also part of the broker's services.
Why do you need a broker? He solves several tasks at once: gives access to the market, executes trades on your behalf, keeps funds and financial instruments on a separate account, handles settlements, and provides analytics and educational materials. For his work, the broker receives a commission — a fixed fee per trade or a part of the spread. This is the payment for infrastructure: servers, licenses, insurance, and security that make trading possible for millions of retail clients.
How do you choose a reliable broker? Pay attention to the license and reputation, the size of commissions, the quality of order execution and the speed of withdrawals, as well as the convenience of the platform and the quality of support. For a beginner it is important that the broker offers a demo account for practice. Remember: a broker is your trading partner, not an adviser on profit. Choosing a broker responsibly is one of the first steps toward systematic and safe trading.
In my profile you will find a lot of useful educational information, (don't forget to add me as a friend) Profile: https://www.mql5.com/en/users/voldemar
Кто такой брокер и зачем он нужен?
Брокер — это профессиональный посредник между трейдером и биржей. Лицензированная компания или частный специалист, он предоставляет частному трейдеру доступ к торговле: именно брокер принимает заявки клиента, проверяет их и передаёт на биржу для исполнения. Прямого доступа к торгам у обычного человека нет — этот путь закрыт правилами площадок, поэтому без брокера невозможно ни открыть счёт, ни купить акцию, ни заключить сделку с валютой. Терминал, в котором вы видите графики, — тоже часть услуг брокера.
Зачем нужен брокер? Он решает сразу несколько задач: даёт доступ к рынку, исполняет сделки от вашего имени, хранит средства и финансовые инструменты на отдельном счёте, ведёт расчёты и предоставляет аналитику и обучающие материалы. За свою работу брокер получает комиссию — фиксированную плату за сделку или часть спреда. Это плата за инфраструктуру: серверы, лицензии, страхование и безопасность, которые делают торговлю возможной для миллионов частных клиентов.
Как выбрать надежного брокера? Обращайте внимание на лицензию и репутацию, размер комиссий, качество исполнения заявок и скорость вывода средств, а также на удобство платформы и качество поддержки. Для новичка важно, чтобы у брокера был демо-счёт для практики. Помните: брокер — ваш партнёр в торговле, а не советник по прибыли. Ответственный выбор брокера — один из первых шагов к системной и безопасной торговле.
В моём профиле Вы найдете много полезной обучающей информации, (не забудь добавить в друзья) Профиль: https://www.mql5.com/ru/users/voldemar
A trader is a participant of the financial market who earns money on price changes of financial instruments: stocks, currencies, indices, commodities, and cryptocurrencies. Unlike an investor, who puts money in for years and waits for long-term growth, a trader makes deals much more often — from several times a day to several times a month — and tries to profit both from rising and falling prices. The main working tool of a trader is a trading terminal: through it he sees quotes, analyzes charts, and sends orders to the broker and then to the exchange.
What does the work of a trader consist of? He studies the market, looks for entry and exit points, opens and closes positions, and manages risks. Analysis can be technical — based on charts, candlesticks, and indicators — or fundamental, based on news and economic data. A professional acts not on emotions but according to a well-thought-out trading system: he knows when to enter a trade, when to exit it, and what part of the capital he is ready to risk. It is risk management that distinguishes a master from a beginner who bets the entire deposit on a single trade and hopes for luck.
Trading can be a hobby or can become a profession, but in any case the path starts the same way: education, a demo account, testing the trading strategy, and only then real money. Start small, learn to read charts and protect your capital with stop losses, and over time trading will become conscious — and therefore stable. Remember: anyone who is ready to learn and accept losses as a natural part of the process can become a trader.
In my profile you will find a lot of useful educational information, (don't forget to add me as a friend) Profile: https://www.mql5.com/en/users/voldemar
Кто такой трейдер?
Трейдер — это участник финансового рынка, который зарабатывает на изменении цен финансовых инструментов: акций, валют, индексов, сырья и криптовалют. В отличие от инвестора, который вкладывает деньги на годы и ждёт долгосрочного роста, трейдер совершает сделки значительно чаще — от нескольких раз в день до нескольких раз в месяц — и пытается получить прибыль как на росте, так и на падении цены. Главный рабочий инструмент трейдера — торговый терминал: через него он видит котировки, анализирует графики и отправляет заявки брокеру на биржу.
В чём заключается работа трейдера? Он изучает рынок, ищет моменты входа и выхода, открывает и закрывает позиции и управляет рисками. Анализ бывает техническим — на основе графиков, свечей и индикаторов, — и фундаментальным, на основе новостей и экономических данных. Профессионал действует не на эмоциях, а по заранее продуманной торговой системе: он знает, когда войти в сделку, когда из неё выйти и какой частью капитала готов рискнуть. Именно управление риском отличает мастера от новичка, который ставит весь депозит на одну сделку и надеется на удачу.
Трейдинг может быть хобби, а может стать профессией, но путь в любом случае начинается одинаково: обучение, демо-счёт, тестирование торговой стратегии и только потом реальные деньги. Начните с малого, научитесь читать графики и защищать капитал стоп-лоссами, и со временем торговля станет осознанной — а значит, стабильной. Помните: трейдером может стать каждый, кто готов учиться и принимать убытки как естественную часть процесса.
В моём профиле Вы найдете много полезной обучающей информации, (не забудь добавить в друзья) Профиль: https://www.mql5.com/ru/users/voldemar
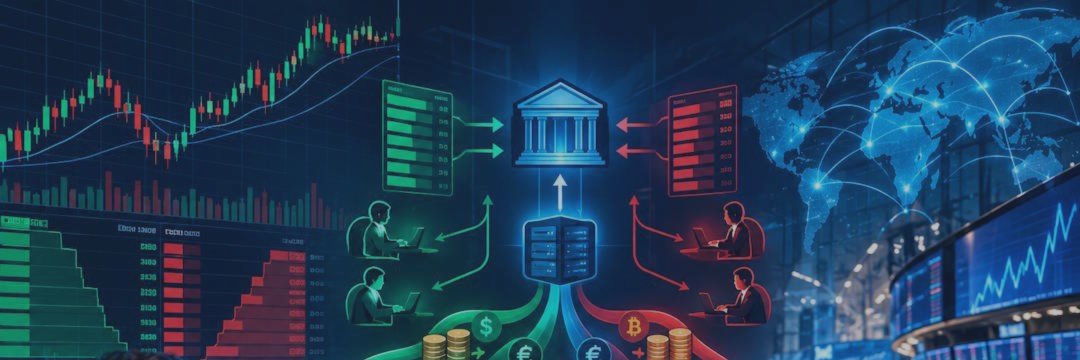
A stock exchange is an organized trading venue where buyers and sellers meet to make deals in financial instruments: stocks, bonds, currencies, futures, and other assets. Unlike an over-the-counter market, where the terms of every deal are negotiated from scratch, an exchange operates under uniform rules: all participants trade through transparent procedures, and prices form as a result of free competition between orders. That is why an exchange quote can be considered an objective valuation of an asset at a given moment.
How does an exchange work? All participant orders — to buy and to sell — are collected in a single electronic order book. Buy orders are sorted by descending price, sell orders by ascending price, and when the buyer's price matches or crosses the seller's price, the system automatically executes the trade. This process is called matching, and settlements for completed trades are handled by a special clearing house that assumes the risk of default. To keep order on the venue, the exchange sets listing rules — which instruments are admitted for trading — and also controls participant behavior through margin requirements and position limits.
For a trader, an exchange is a source of fair market prices and liquidity: instruments on an exchange venue can be bought or sold quickly and at a fair price thanks to the large number of participants. To access an exchange, you do not need to be its member: it is enough to open an account with a broker who has access to trading. The largest venues in the world are the New York Stock Exchange, the London Stock Exchange, and the Moscow Exchange, while the Forex currency market is a global interbank system operating almost around the clock. Understanding how an exchange works helps a beginner perceive quotes, spreads, and trade execution consciously — this is the first step toward systematic trading.
In my profile you will find a lot of useful educational information, (don't forget to add me as a friend) Profile: https://www.mql5.com/en/users/voldemar
Что такое биржа?
Биржа — это организованная торговая площадка, на которой покупатели и продавцы встречаются для заключения сделок с финансовыми инструментами: акциями, облигациями, валютами, фьючерсами и другими активами. В отличие от стихийного рынка, где условия каждой сделки договариваются заново, биржа работает по единым правилам: все участники торгуют по прозрачным процедурам, а цены формируются в результате свободной конкуренции заявок. Именно поэтому биржевую котировку можно считать объективной оценкой стоимости актива в конкретный момент времени.
Как устроена биржа? Все заявки участников — на покупку и на продажу — собираются в едином электронном стакане. Заявки на покупку сортируются по убыванию цены, заявки на продажу — по возрастанию, и когда цена покупателя совпадает или пересекается с ценой продавца, система автоматически заключает сделку. Сам процесс называют матчингом, а расчёты по совершённым сделкам ведёт специальная клиринговая структура, которая берёт на себя риск неисполнения обязательств. Чтобы на площадке был порядок, биржа устанавливает правила листинга — какие инструменты допускаются к торгам, — и контролирует поведение участников через механизмы маржинальных требований и лимитов.
Для трейдера биржа — это источник честных рыночных цен и ликвидности: инструменты на биржевой площадке можно купить или продать быстро и по справедливой цене благодаря множеству участников. Чтобы выйти на биржу, не нужно быть её членом: достаточно открыть счёт у брокера, который имеет доступ к торгам. Крупнейшие площадки мира — Нью-Йоркская фондовая биржа, Лондонская фондовая биржа и Московская биржа, а валютный рынок Forex представляет собой глобальную межбанковскую систему, работающую практически круглосуточно. Понимание того, как устроена биржа, помогает новичку осознанно воспринимать котировки, спред и исполнение сделок — это первый шаг к системной торговле.
В моём профиле Вы найдете много полезной обучающей информации, (не забудь добавить в друзья) Профиль: https://www.mql5.com/ru/users/voldemar