Ioannis Christopoulos
  • 정보
2 년도
경험
0
제품
0
데몬 버전
0
작업
0
거래 신호
0
구독자
Ioannis Christopoulos is a seasoned expert in the field of financial markets with many years of experience in observing chart patterns and developing automated trading strategies.His extensive knowledge and expertise in technical analysis have led him to identify specific patterns that consistently occur before significant economi ccrises. Having studied market charts and patterns for years, Ioannis recognized that certain formations precede major economic downturns or upturns. These patterns often carry valuable information about market sentiment and future pricemovements. Leveraging his expertise, he meticulously designed anautomated tradings trategy capable of detecting the critical patterns and executing trades in theright direction, aiming to capitalize on upcoming market shifts.

My steps over these years was these...

2013
( https://www.fxcm.com )
( https://www.mjtnet.com )
I started trading on FXCM Trading Station 2 platform.
I then used Macro Scheduler Desktop Automation, which has a function for Screen Recognition,
to automate my first ideas.I had to run 20 virtual windows using vmware on 6 PC so i can reduce the time for testing.

2017
( https://fxcodebase.com )
4 Years later, and after thousands of fails , i found this site which made the fxcm platform and they have sections with
hundreds of strategies.So i downloaded the some simple ones and i started experiment with the code , to understand how it works.
This way i learned the .lua programming language.

2018 and ESMA
( https://www.mql5.com/ )
After the decision of EU and ESMA, i had to open account to australia or something similar , so i could use the 1:400 leverage.
At the same time i had to learn .mql for MetaTrader 4, and recreate my .lua projects to .mql

2019
( https://forextester.com/ )
I had finally made 1 strategy that was working. So to make my strategy more efficient i should add more pairs.
But either FXCM or MT4 could backtest several pairs under the same account balance at once.
So i found this app ( ForexTester 4 ) that can do it.And that was my last language i learned.Delphi

2023
( https://www.mql5.com/ )
I found out that that my trades on live account did not much forextester's, so i decided to move to Metatrader5 and i learned MQL5.\

2023-2024
( https://forexbot.gr/ )
With a strategy tested for 10 years, a platform that allows multicurency and multitimeframe trading, i started creating my website to start renting my EA.
Ioannis Christopoulos
Περιγραφή Στρατηγικής
Οι τρεις λογαριασμοί που παρουσιάζονται στο προφίλ μου () δεν αποτελούν τρεις διαφορετικές στρατηγικές, αλλά μία ενιαία στρατηγική, η οποία έχει εξελιχθεί μέσα από τρία διαδοχικά στάδια επαλήθευσης (live validation).
Σε επίπεδο μεθοδολογίας, πρόκειται για ένα πλήρως συστηματικό (fully systematic) μοντέλο βασισμένο σε price action και μοτίβα αντίδρασης της αγοράς (reaction patterns / bar formation). Δεν χρησιμοποιεί technical indicators, martingale, grid ή averaging-down οποιασδήποτε μορφής. Λειτουργεί ως χαρτοφυλάκιο ανεξάρτητων υποσυστημάτων σε πολλαπλά timeframes.
Από την πρώτη ημέρα σχεδιασμού της, ο στόχος δεν ήταν να δημιουργηθεί ένα σύστημα που να λειτουργεί σε ένα συγκεκριμένο νόμισμα ή χρονικό πλαίσιο, αλλά να εντοπιστεί ένα επαναλαμβανόμενο στατιστικό μοτίβο (statistical edge) το οποίο να παραμένει λειτουργικό: σε όλα τα Major και Minor FX pairs, σε όλα τα διαθέσιμα timeframes, και σε ολόκληρο το διαθέσιμο ιστορικό δείγμα.
Η φιλοσοφία ανάπτυξης δεν βασίστηκε στη βελτιστοποίηση (optimization) για συγκεκριμένες αγορές ή περιόδους, αλλά στην αναζήτηση ενός όσο το δυνατόν πιο γενικευμένου και ανθεκτικού στατιστικού πλεονεκτήματος, ικανού να διατηρεί τη συμπεριφορά του σε διαφορετικές συνθήκες αγοράς.
Για τον λόγο αυτό, η βασική λογική της στρατηγικής δεν άλλαξε ποτέ κατά τη διάρκεια της εξέλιξής της. Και στους τρεις λογαριασμούς χρησιμοποιούνται ακριβώς τα ίδια κριτήρια εισόδου, τα ίδια stop-loss και τα ίδια take-profit. Το μοναδικό στοιχείο που διαφοροποιείται είναι το περιβάλλον εκτέλεσης (broker specifications), η μόχλευση, το contract size και κατά συνέπεια το position sizing.
Στάδιο 1 – Live Proof of Concept (Funded InstaTrader)
Ο πρώτος λογαριασμός τέθηκε σε λειτουργία τον Δεκέμβριο του 2023 μέσω funded contest account, με στόχο την απάντηση στο πρώτο και σημαντικότερο ερευνητικό ερώτημα: μπορεί το στατιστικό πλεονέκτημα που παρατηρήθηκε στα ιστορικά δεδομένα να επιβιώσει και σε πραγματικές συνθήκες αγοράς;
Ο λογαριασμός λειτουργεί με contract size 10.000 units και μόχλευση 1:500. Το στάδιο αυτό αποτελεί την πρώτη ζωντανή επιβεβαίωση ότι το θεωρητικό μοντέλο λειτουργεί στην πραγματική αγορά.
Στάδιο 2 – Personal Capital Validation (Key To Markets)
Ο δεύτερος λογαριασμός δημιουργήθηκε τον Σεπτέμβριο του 2024, μόνο αφού είχαν ολοκληρωθεί περισσότερες από 100 πραγματικές συναλλαγές στον πρώτο λογαριασμό. Πριν ενεργοποιηθεί, πραγματοποιήθηκε νέο backtest αποκλειστικά για την ίδια χρονική περίοδο του live trading, ώστε να επιβεβαιωθεί η σύγκλιση (convergence) μεταξύ ιστορικών αποτελεσμάτων και πραγματικής εκτέλεσης. Μόνο μετά από αυτή την επιβεβαίωση τοποθετήθηκαν προσωπικά κεφάλαια.
Ο λογαριασμός λειτουργεί με πραγματικά προσωπικά κεφάλαια ($5.000), contract size 100.000 units και μόχλευση 1:500. Η στρατηγική παραμένει απολύτως ίδια — η έκθεση απλώς κλιμακώνεται αναλογικά με το contract size και το μέγεθος του λογαριασμού.
Στάδιο 3 – Institutional Track Record (Darwinex Zero JUZE)
Ο τρίτος λογαριασμός δημιουργήθηκε τον Μάρτιο του 2025 με διαφορετικό στόχο: όχι να δοκιμαστεί νέα στρατηγική, αλλά να ξεκινήσει η δημιουργία ενός μακροχρόνιου institutional track record, το οποίο σκοπεύω να διατηρήσω τουλάχιστον έως το 2030.
Η στρατηγική εξακολουθεί να χρησιμοποιεί ακριβώς τα ίδια entry, stop-loss και take-profit. Η βασική διαφορά είναι το περιβάλλον μόχλευσης 1:30, το οποίο επιβάλλει σημαντικά μικρότερο position sizing — η συνολική έκθεση είναι περίπου στο ένα τρίτο της αντίστοιχης των λογαριασμών 1:500. Κατά συνέπεια, το μικρότερο drawdown που παρατηρείται στον Darwinex Zero δεν οφείλεται σε διαφορετική στρατηγική ή σε διαφορετικό statistical edge· είναι η φυσική συνέπεια της μικρότερης μόχλευσης και της αναλογικής μείωσης της έκθεσης.
Φιλοσοφία Ανάπτυξης
Οι τρεις λογαριασμοί αποτελούν τρία διαδοχικά στάδια εξέλιξης της ίδιας στρατηγικής. Ο καθένας δημιουργήθηκε για να απαντήσει σε ένα διαφορετικό ερευνητικό ερώτημα:
• Μπορεί το statistical edge να επιβεβαιωθεί σε πραγματικές συνθήκες αγοράς;
• Συμφωνεί η πραγματική απόδοση με τα ιστορικά αποτελέσματα όταν χρησιμοποιούνται προσωπικά κεφάλαια;
• Μπορεί η ίδια στρατηγική να δημιουργήσει ένα πολυετές institutional track record σε συντηρητικό περιβάλλον μόχλευσης;
Για τον λόγο αυτό, οι τρεις λογαριασμοί δεν πρέπει να αξιολογούνται ως τρεις ανεξάρτητες στρατηγικές. Αποτελούν τρία στάδια επαλήθευσης του ίδιου systematic trading model, με αμετάβλητη λογική συναλλαγών και μοναδικές διαφοροποιήσεις το περιβάλλον εκτέλεσης, το contract size, τη μόχλευση και το position sizing.
Αρχή Αναλογικής Κλιμάκωσης Ρίσκου (Risk Scaling Principle)
Η στρατηγική παραμένει απολύτως ίδια και στους τρεις λογαριασμούς. Τα κριτήρια εισόδου, τα stop-loss, τα take-profit και η διαχείριση των θέσεων δεν μεταβάλλονται. Αυτό που μεταβάλλεται είναι αποκλειστικά η κεφαλαιακή έκθεση (capital exposure), η οποία καθορίζεται από το contract size, τη διαθέσιμη μόχλευση, το μέγεθος του λογαριασμού και, κατά συνέπεια, το position sizing.
Με άλλα λόγια, οι τρεις λογαριασμοί αποτελούν διαφορετικές υλοποιήσεις διαχείρισης κινδύνου (risk implementations) του ίδιου systematic trading model. Οι διαφορές τους αντικατοπτρίζουν διαφορετικά επίπεδα ανάληψης κινδύνου και κεφαλαιακής αποδοτικότητας, όχι διαφορετική ποιότητα της στρατηγικής. Αυτό επιτρέπει την αξιολόγηση του ίδιου trading edge κάτω από διαφορετικούς επιχειρησιακούς και κανονιστικούς περιορισμούς, διατηρώντας αμετάβλητη τη βασική λογική συναλλαγών.
Ioannis Christopoulos
Strategy Description
The three accounts shown on my profile () are not three different strategies. They are a single strategy that has evolved through three successive stages of live validation.
In terms of methodology, this is a fully systematic model based on price action and market reaction patterns (bar formation). It uses no technical indicators, no martingale, no grid, and no averaging-down of any kind. It operates as a portfolio of independent subsystems across multiple timeframes.
From the first day of its design, the objective was never to build a system that works on one specific currency or timeframe, but to identify a repeatable statistical pattern (statistical edge) that remains functional across all Major and Minor FX pairs, across all available timeframes, and across the entire available historical sample.
The development philosophy was not based on optimization for specific markets or periods, but on the search for the most generalized and robust statistical advantage possible — one capable of maintaining its behavior under different market conditions.
For this reason, the core logic of the strategy has never changed during its evolution. All three accounts use exactly the same entry criteria, the same stop-loss, and the same take-profit. The only elements that differ are the execution environment (broker specifications), the leverage, the contract size and, consequently, the position sizing.
Stage 1 – Live Proof of Concept (Funded InstaTrader)
The first account went live in December 2023 through a funded contest account, designed to answer the first and most important research question: can the statistical edge observed in historical data survive under real market conditions?
The account operates with a contract size of 10,000 units and 1:500 leverage. This stage constitutes the first live confirmation that the theoretical model works in the real market.
Stage 2 – Personal Capital Validation (Key To Markets)
The second account was created in September 2024, only after more than 100 real trades had been completed on the first account. Before it was activated, a new backtest was run exclusively over the same period as the live trading, in order to confirm the convergence between historical results and actual execution. Personal capital was committed only after this confirmation.
The account operates with real personal capital ($5,000), a contract size of 100,000 units and 1:500 leverage. The strategy remains exactly the same — exposure is simply scaled proportionally to the contract size and the account equity.
Stage 3 – Institutional Track Record (Darwinex Zero JUZE)
The third account was created in March 2025 with a different objective: not to test a new strategy, but to begin building a long-term institutional track record, which I intend to maintain at least until 2030.
The strategy continues to use exactly the same entries, stop-loss and take-profit. The key difference is the 1:30 leverage environment, which imposes significantly smaller position sizing — total exposure is approximately one third of that used on the 1:500 accounts. Consequently, the lower drawdown observed on Darwinex Zero is not the result of a different strategy or a different statistical edge; it is the natural consequence of the lower leverage and the proportional reduction in exposure.
Development Philosophy
The three accounts represent three successive stages in the evolution of the same strategy. Each one was created to answer a different research question:
• Can the statistical edge be confirmed under real market conditions?
• Does live performance agree with historical results when personal capital is at risk?
• Can the same strategy build a multi-year institutional track record in a conservative leverage environment?
For this reason, the three accounts should not be evaluated as three independent strategies. They are three validation stages of the same systematic trading model, with unchanged trading logic and with the execution environment, contract size, leverage and position sizing as the only differentiating factors.
Risk Scaling Principle
The strategy remains exactly the same across all three accounts. The entry criteria, stop-loss, take-profit and trade management do not change. What changes is exclusively the capital exposure, which is determined by the contract size, the available leverage, the account size and, consequently, the position sizing.
In other words, the three accounts are different risk implementations of the same systematic trading model. Their differences reflect different levels of risk-taking and capital efficiency — not different strategy quality. This allows the same trading edge to be evaluated under different operational and regulatory constraints, while the core trading logic remains unchanged.
Ioannis Christopoulos
When evaluating a trading strategy, most investors focus on total return, win rate, or recent performance. While these metrics are important, they rarely tell the whole story...
Ioannis Christopoulos
A win rate alone is not enough. Expectancy reveals whether a trading strategy possesses a genuine statistical advantage.
https://forexbot.gr/en/insights/expectancy-the-number-that-reveals-a-real-edge
Ioannis Christopoulos
ForexBot GR - JUZE vs S&P 500
Ioannis Christopoulos
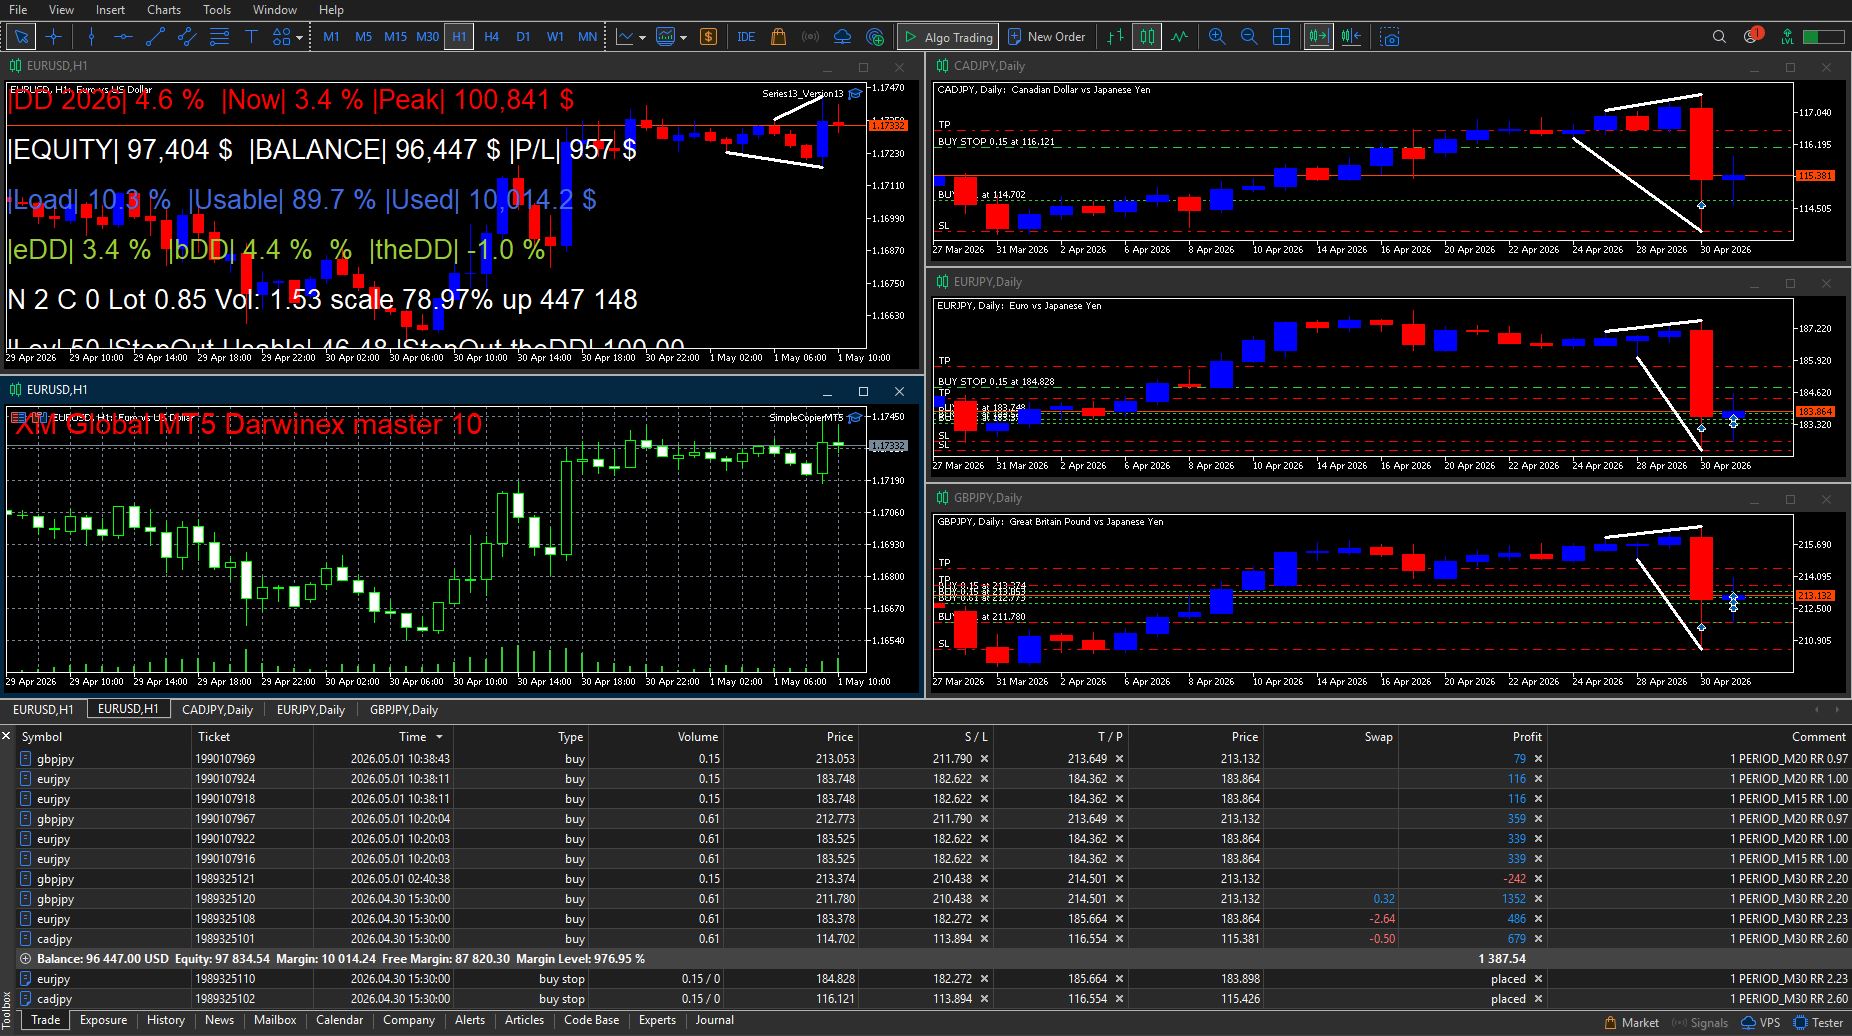
Today's trades on Darwinex Account 2026
Ioannis Christopoulos
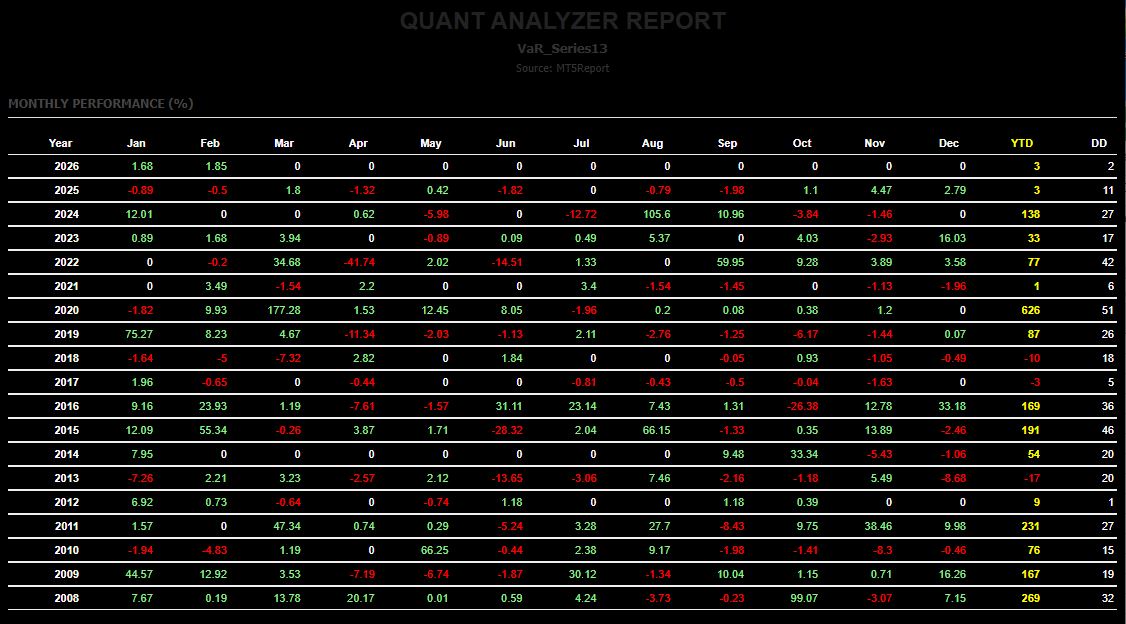
Monthly Wins and Looses % over 15+years
Ioannis Christopoulos
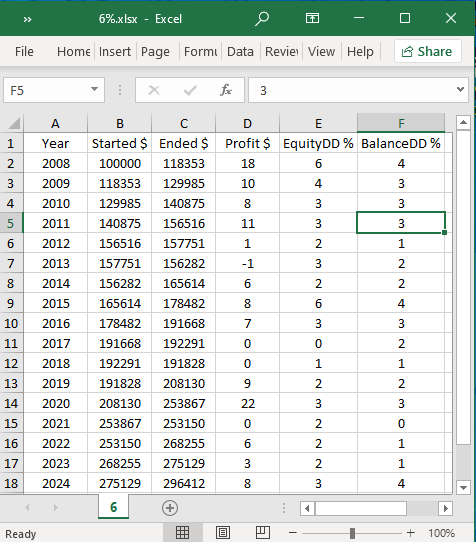
How much should cost a Strategy Targeting 6% Annual Return on $500K Prop Firm Capital ?
If a strategy can generate an average annual return of around 6%, then on a $500,000 capital allocation this translates to approximately $30,000 per year. In such a framework, a reasonable annual licensing fee for running the strategy would typically fall between 10% and 30% of the generated profit, or roughly $5,000–$8,000 per year.
Ioannis Christopoulos
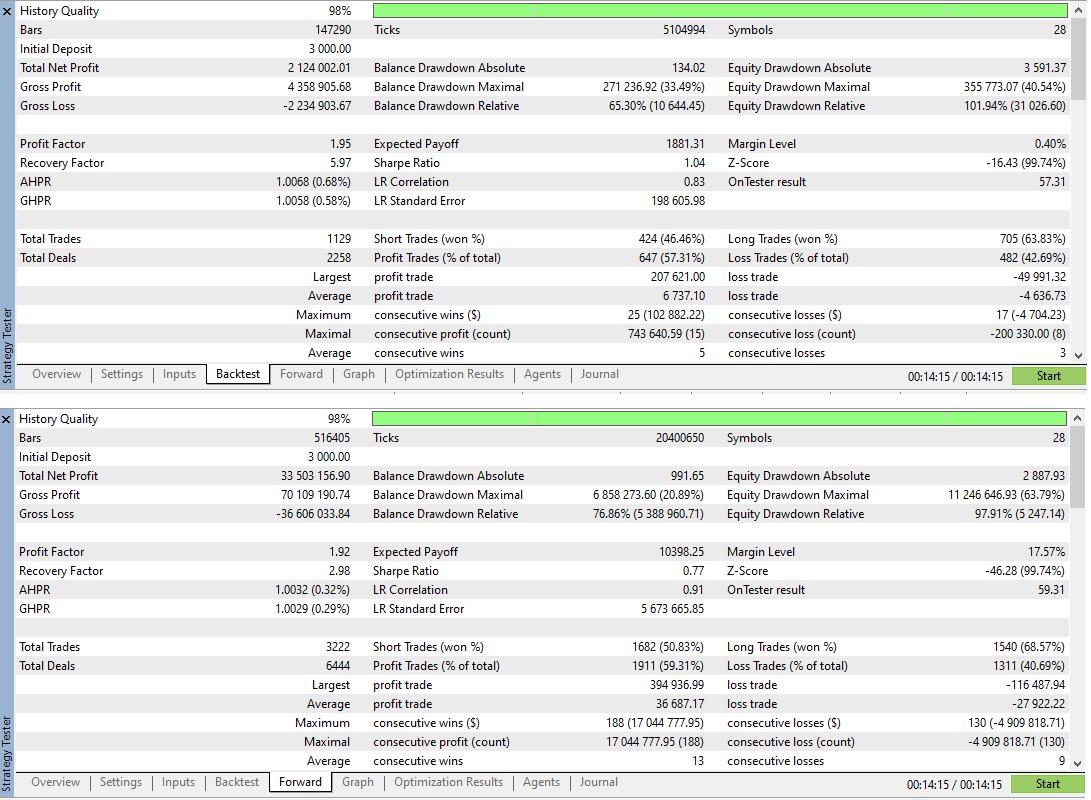
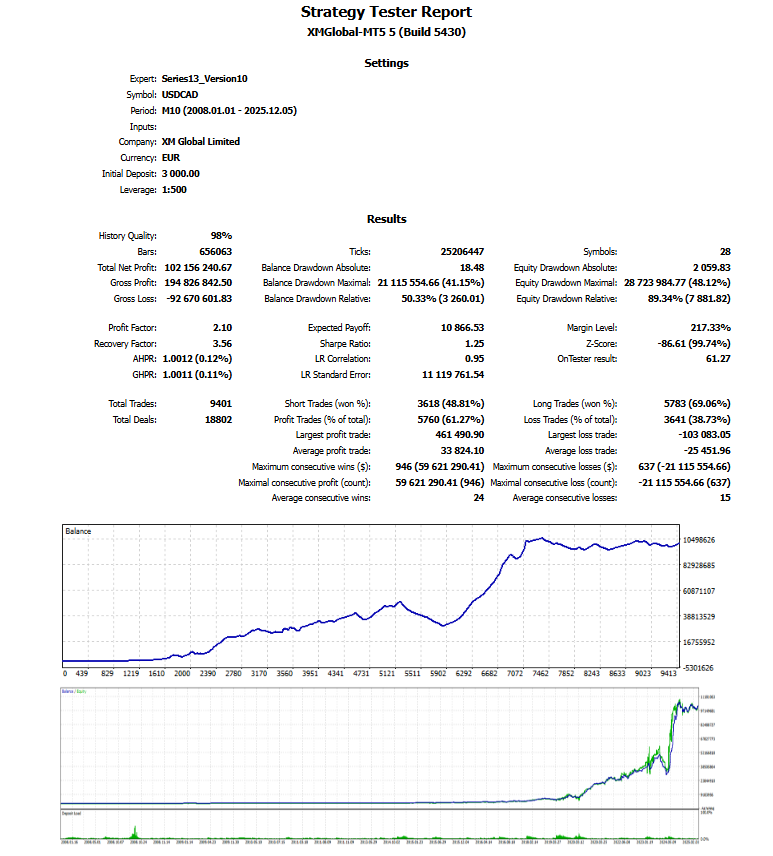
4 years Backtest (2008-2012) 14 years Forward (2012-2026) 2 years Live
Ioannis Christopoulos
📊 ForexBot.GR – ZuluRank #494 (Top 0.2%)
Ioannis Christopoulos
Not Curve fiting
Ioannis Christopoulos
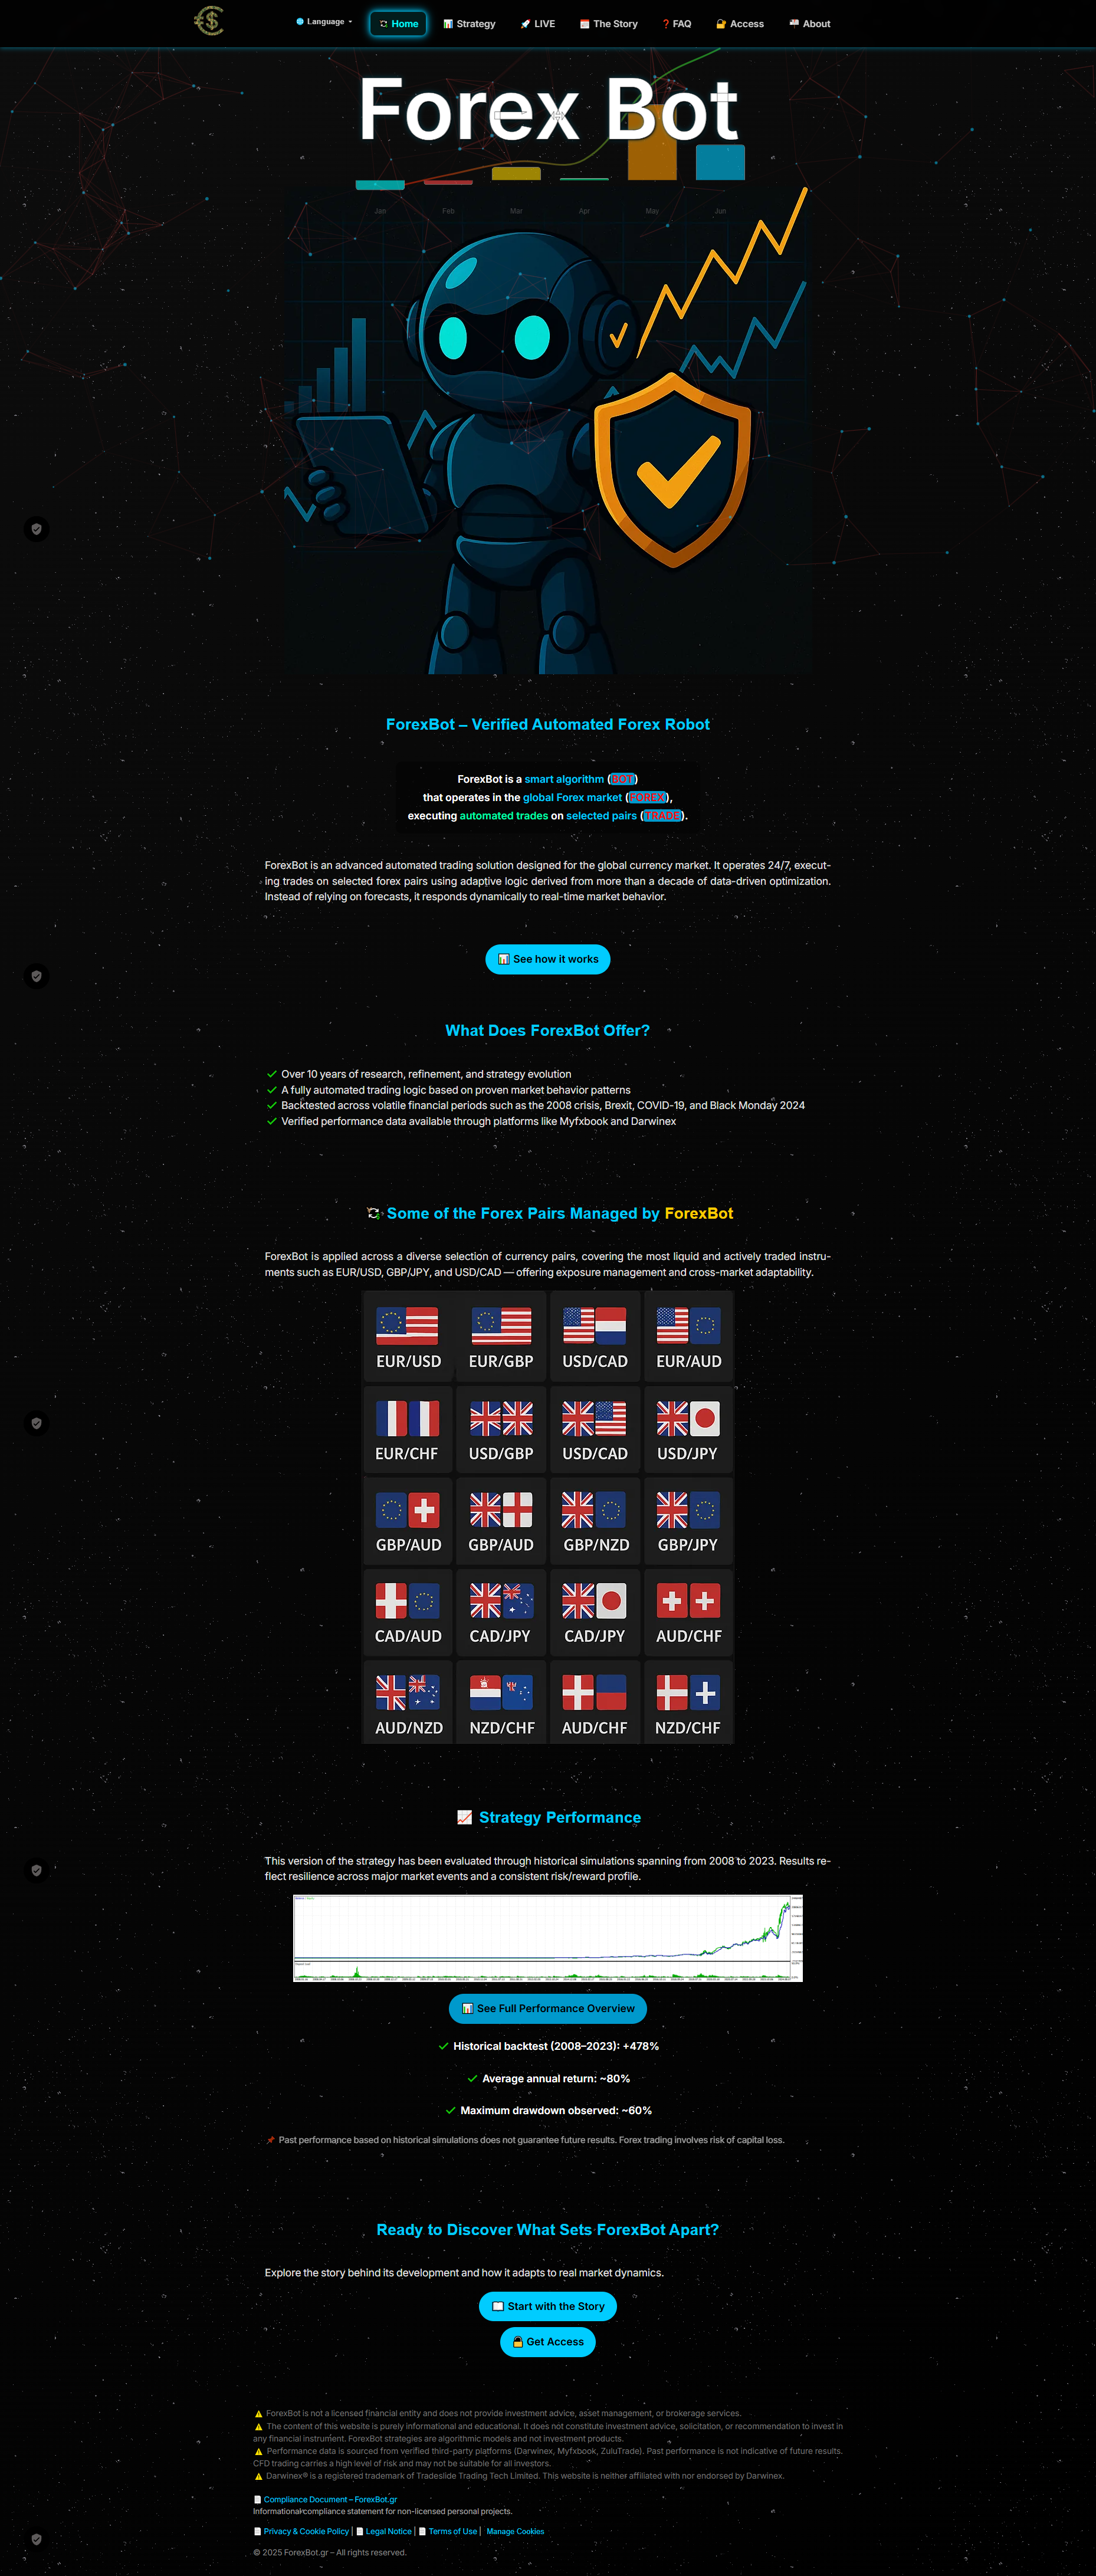
https://forexbot.gr/
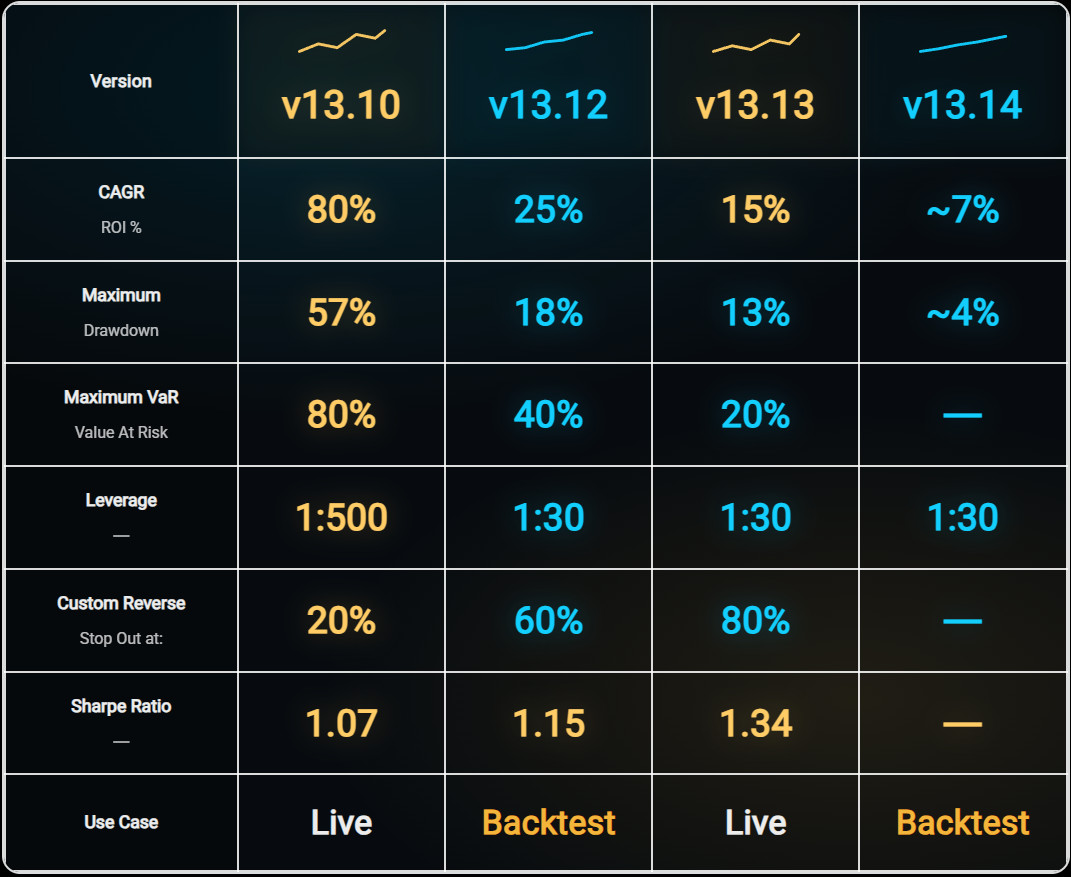
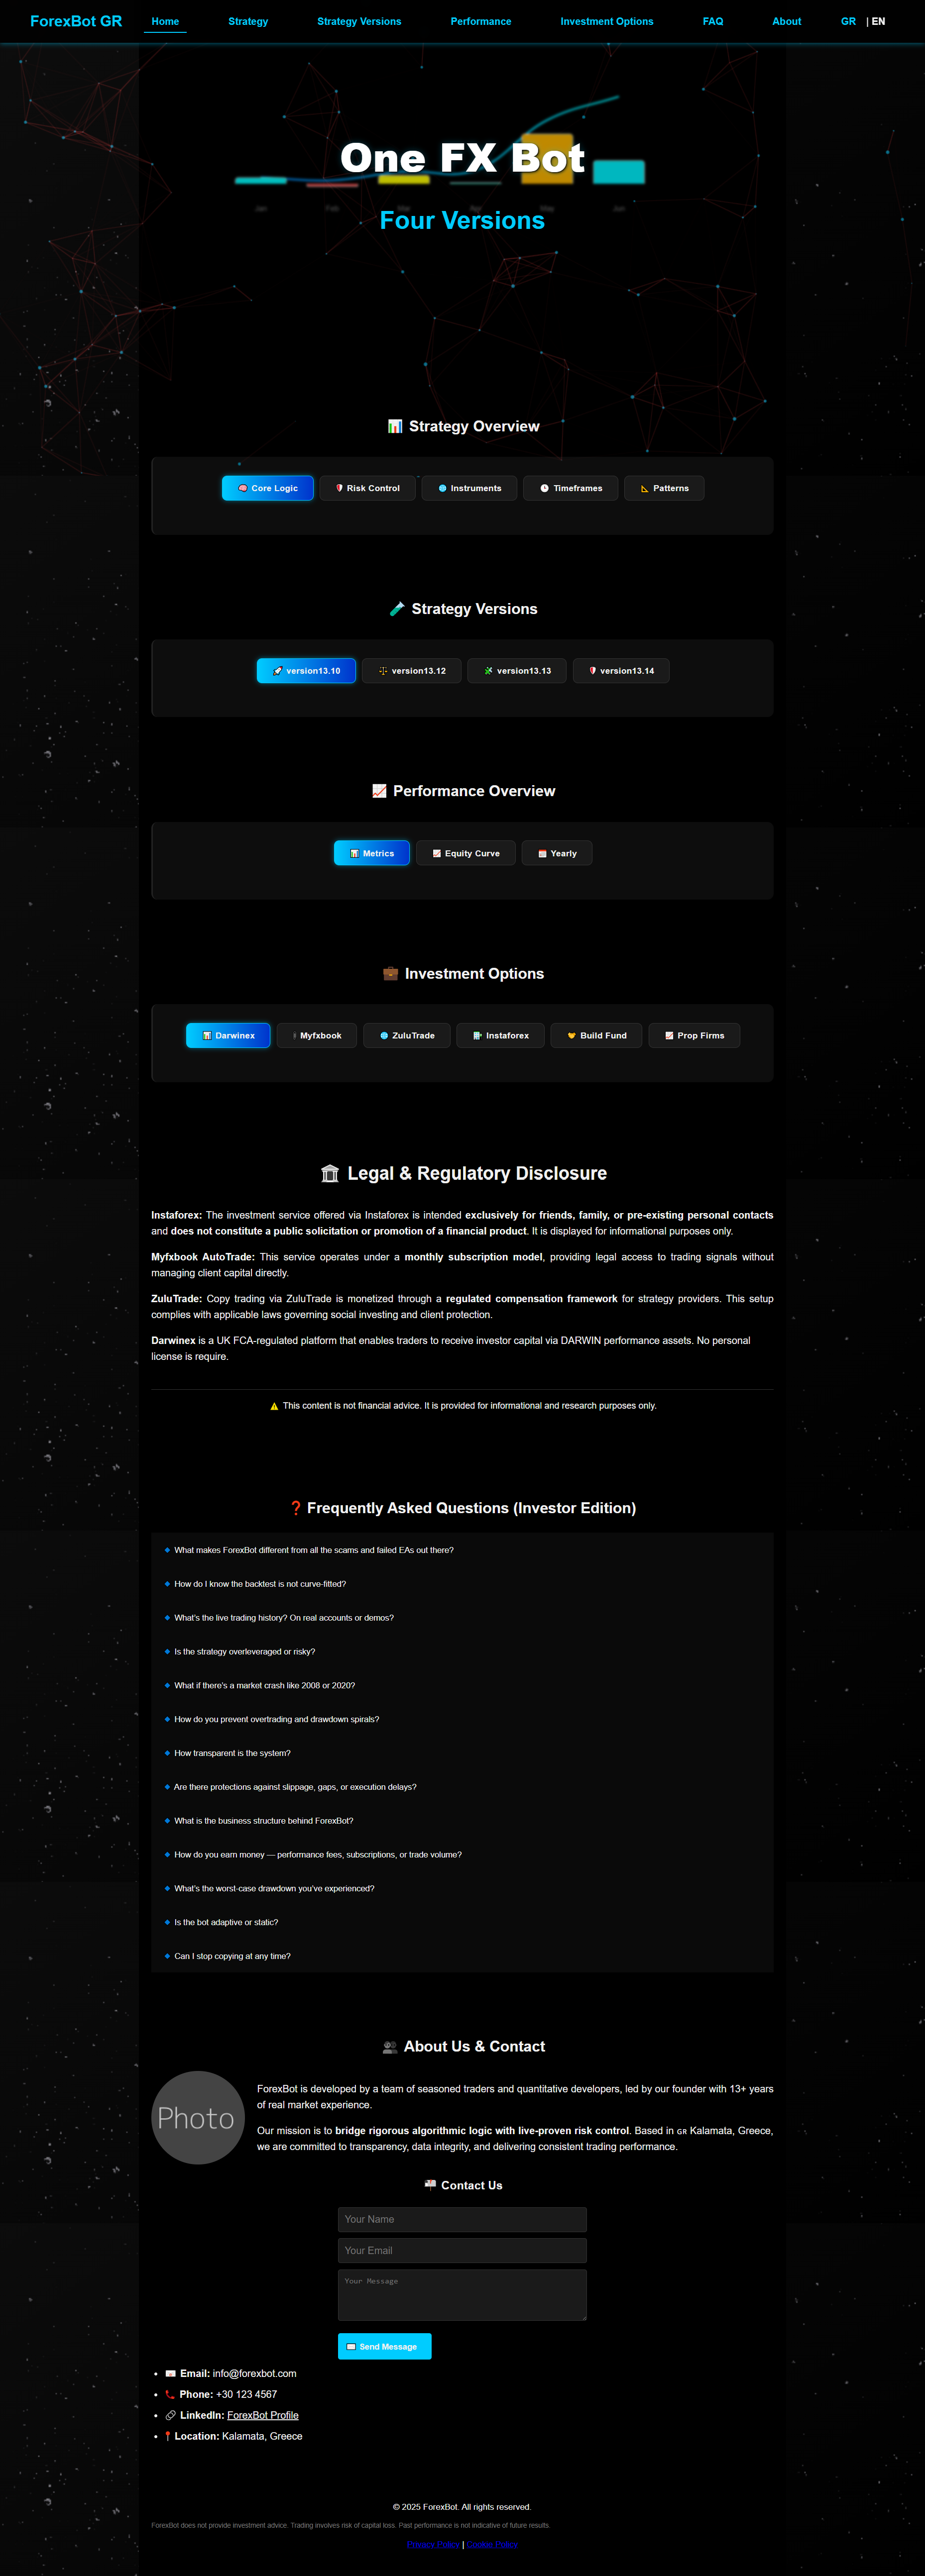
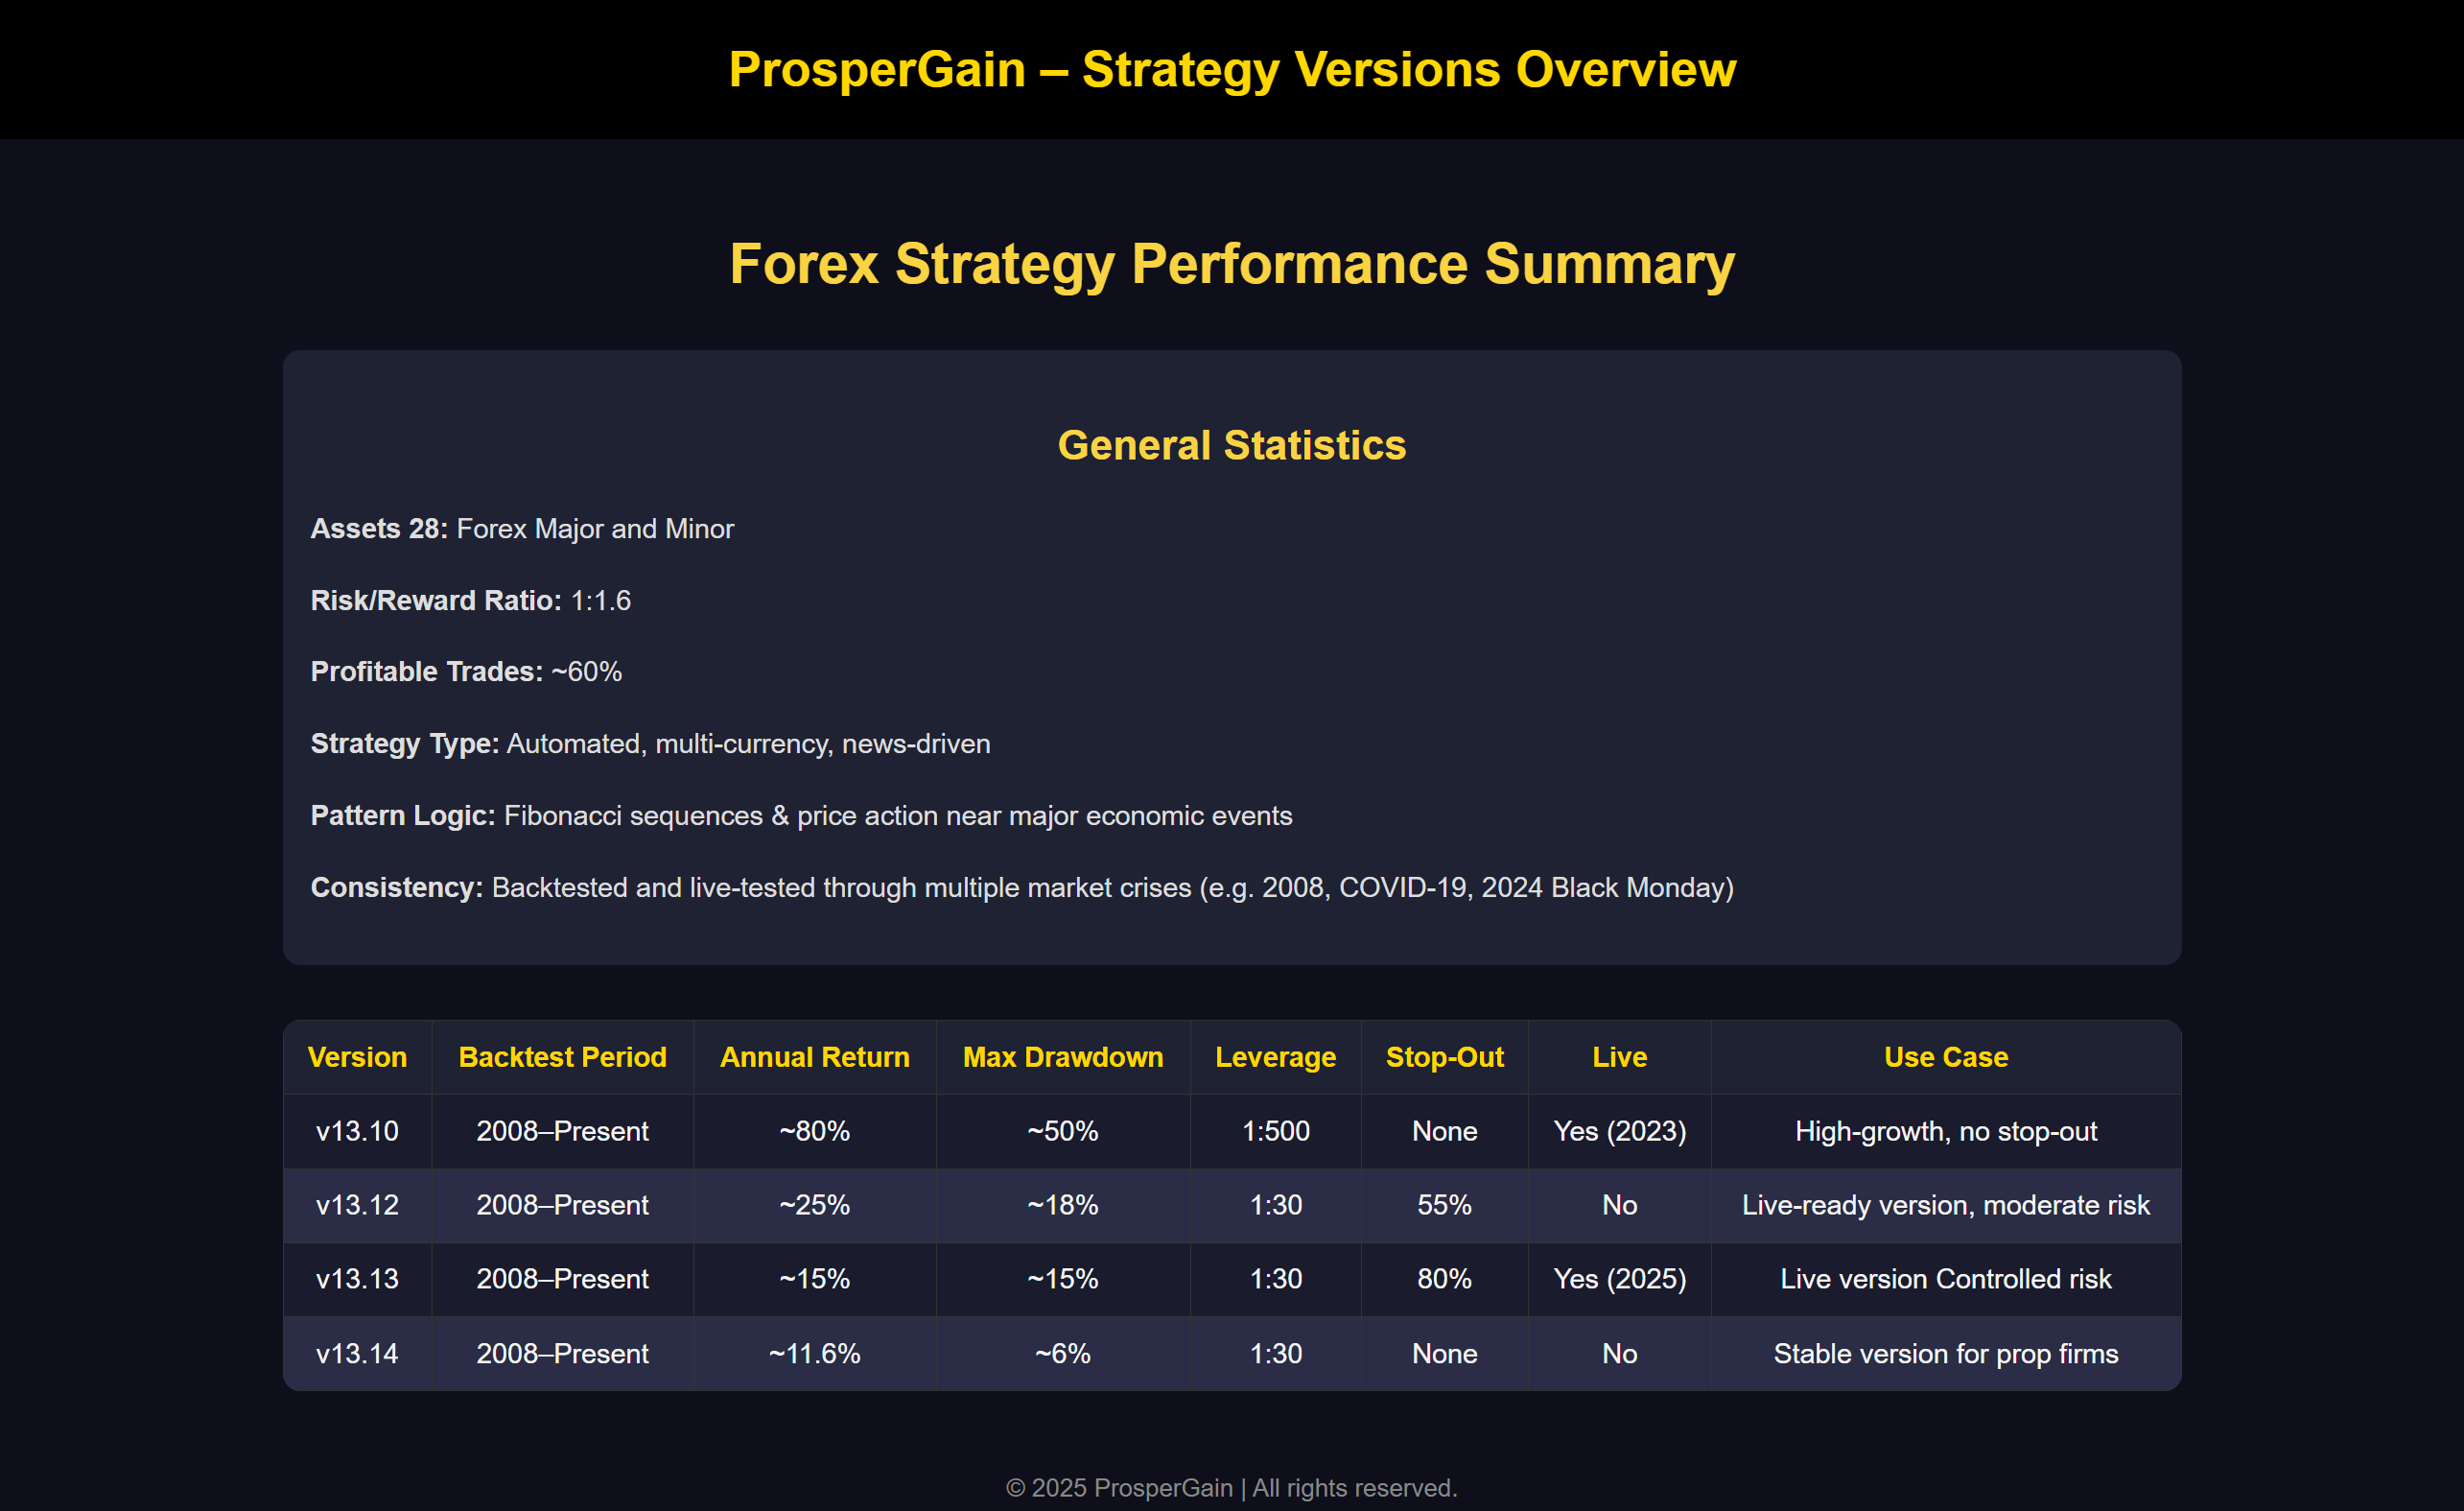
ForexBot is a fully automated forex trading system, combining AI and statistical precision. Featuring four optimized versions (v13.10–v13.14), each tailored for different risk levels, it offers consistent returns with transparent, verifiable performance from 2008 to today.
Ioannis Christopoulos
ALL my Ea's run the same strategy that is based on Railway track pattern, Price action and Fibonacci sequence with different Risk Controls, Trading ALL Forex Major and Minor pairs


On leverage 1:30 I have a custom Stop Out, that closes the trades that are in profit, as the Usable Margin % drops.
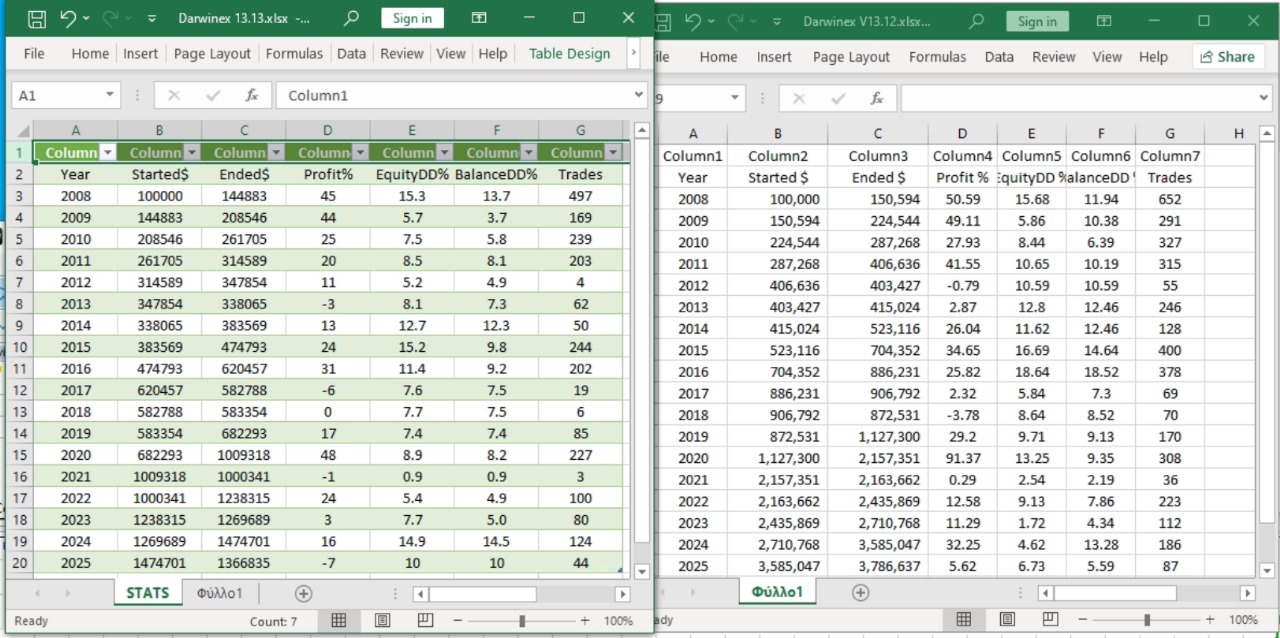
At the 13.12 version this stop out is at 55% and I have an average annual return 25% with MaxDD 20%

Version 13.13 the stop out is at 80%. That means that the EA will use a controlled Value At Risk (VaR) and that one is adjusted to Darwinex Risk Engine, returning an average 15% annual with MAX 15% DD

I have the v13.13 running Live on Darwinex Zero for 2 months, but in my 17 Years backtest you can see the results.

The same strategy version 13.10 is also trading with a Live account on 1:500 Leverage trading my own funds on Instaforex (10K) (16months)and Key To Markets.(5K)(6months) both free(with no risk control ), where the DD can go 20-40 and 60 %
Ioannis Christopoulos
The EA I have created trades mainly on major news.
In 17 years of simulation it has shown that before every doubling of my capital there is a drop of the order of 20% from the peak of the capital. The same happened in August 2024 as shown in the image.
The same happened every year with economic announcements that shocked the market except for 2008 and 2015 where in 2008 there were 3 consecutive drops of the order of 20% (60%) and in 2015 2 consecutive drops of the order of 20% (40) you can see them in the video below.
https://youtu.be/ixF2MSYmeo0?si=FJ6bWQTmMdxNxq-X
Ioannis Christopoulos
Global markets fell sharply today after former US President Donald Trump announced sweeping tariffs on several US trading partners. China responded immediately, imposing a 34% tariff on all US goods, escalating the trade war and sending investors into a panic. ​ In the United States, the S&P 500, Nasdaq and Dow Jones industrial averages all recorded their worst daily losses of 2020, with the Nasdaq down 6%. Technology companies such as Apple and Nvidia suffered heavy losses, with a combined market capitalization loss of around $470 billion.​ In Europe, stock markets followed the downward trend, with the STOXX 600 index down 4.8%, while banking stocks suffered significant losses. In Asia, markets were also negatively affected, with the Nikkei index down 2.8%. ​ Energy markets were not left untouched, as oil prices fell more than 6%, while shares of energy companies, such as Woodside Energy and Santos in Australia, recorded losses of almost 9% and 8.6% respectively. ​ These developments have increased concerns about a possible global recession, with economists warning of the long-term effects of a prolonged trade war. The International Monetary Bank called for restraint, highlighting the risks to global growth.​ Overall, the announcement of new tariffs and China's retaliation have caused turmoil in the markets, with investors worried about the escalation of the trade war and its impact on the global economy.
12