I'm an architect, I love the lines. I am passionate about financial trading, foreign exchange, investment projects, and especially studying the nature of the financial markets.
One day, a novice trader opened a forex trading account with a broker and decided to try his luck at trading. He read a few articles and watched a few videos on forex trading and thought he understood the basics...
MA Quadratic Weighted ( MA QW ) Indicator MT5 - Basic Trading Signals: Buy Signal: Go long when the bold line of the MA QW Metatrader 5 forex indicator turns lime green. Exit buy trade: Close all buy orders if while a bullish trend is ongoing, the bold line of the MA QW indicator is colored dark orange. Sell Signal: Go short when the bold line of the MA QW Metatrader 5 forex indicator turns dark orange. Exit sell trade: Close all sell orders if while a bearish trend is ongoing, the bold
An unintentional error is one that has nothing to do with the trader's adopted trading strategy or methods of analysis. The typical example of an unintended error is when a trader accidentally pushes the "Sell" button instead of the "Buy" button when intending to buy...
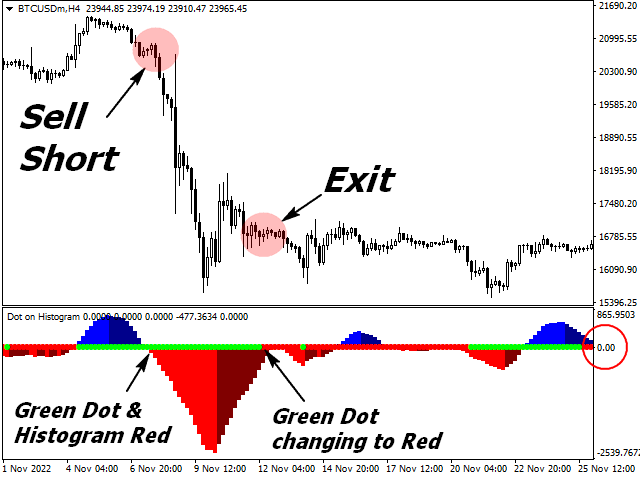
Take long position when you see green dot on zero line AND blue histogram lines. And sell your position, when you see green dot on zero line AND red histogram lines. https://www.mql5.com/en/market/product/94556
The EA working 35 minute after London session and stop trade or close all trade 3hour after London session you need zero spread account with little comission , iam using TIME SERVER FOR THIS EA PARAMETER: Start time 15.35 > server time End time 18.35 > server time Lot 0.01 > deault lot is 0.01 Start break even 40 > if you running profit 40 point expert will modif your SL to offset Offset break even 2 > offset 2 point on profit --------------------------------------------- Thank
The RSI with Trend Catcher signal is an easy-to-follow mt4 indicator that works like the traditional RSI. The RSI Trend Catcher plots a signal line similar to RSI but with some alterations. The indicator tells you overbought oversold areas and presents buying and selling opportunities. In addition, it catches the bullish and bearish divergences and locate trends better than the traditional RSI indicator. The RSI trend catcher consists of three colors; red, green, and yellow, with each color
Knowing the time remaining for a candle to end can be very useful on multiple occasions. The MT4 platform shows the current time but it does not show the remaining time in the current candle. This indicator shows candle end time and current spread, allows you to see on chart the remaining time before the next candle bar starts to form. In short term trading, especially those lasting less than a day, timing becomes one of the most important aspects of trade entry and exit
The MultiTrader Expert Advisor for MetaTrader4 platform is a multi-purpose trading utility. It gives the user with a wealth of information within the dashboard that the user can use to take trades. Plus, the program provides alerts to inform the user of an available trading opportunity in different symbols. Meanwhile, the user can use the provided information or the alerts to enter trades or he can use his own analysis and then use the tool to execute the trades. As the dashboard encompasses the
Bollinger Bands MACD indicator MT5 - is a basic MACD (Moving Average Convergence Divergence) indicator variation, which helps in detecting the trend change points and measuring the current trend's strength. The indicator is drawn in the separate window on the chart and consists of two lines (blue and red) and the dots, which can be either green or magenta. The change of the dots' color is a good signal provider, while the width of gap between the two lines
Bollinger Bands MACD indicator MT4 - is a basic MACD (Moving Average Convergence Divergence) indicator variation, which helps in detecting the trend change points and measuring the current trend's strength. The indicator is drawn in the separate window on the chart and consists of two lines (blue and red) and the dots, which can be either green or magenta. The change of the dots' color is a good signal provider, while the width of gap between the two lines indicates the strength of the current
Trend on All Timeframes MetaTrader indicator MT5 — a multi-timeframe indicator that is based on three standard indicators: Stochastic oscillator , RSI (Relative Strength Index), and CCI (Commodity Channel Index). It displays current trend directions for M1, M5, M15, M30, H1, H4, D1, W1, and MN1 timeframes. When you follow such an indicator you have a clear picture of the trends across all important timeframes. It doesn't matter which timeframe you
Volume Profile is a very useful indicator — it allows you to spot the price levels where important price action took place. It is similar to support and resistance levels but with a different logic. Volume Profile indicator for MT4 presented below will show you the concentration of price action at the various price levels. What Is Volume Profile Indicator? Volume Profile indicator (also called Market Profile in some cases) is a handy tool for checking price action on a chart. One of the first